

Bucks vs Lakers Live Score (18 Jan, 2027)
Game Information
League
NBA
Season
1
Date
January 17, 2027
Tipoff
9:00 PM EST
Status
Scheduled
Team Stats
 MIL
Game Comparison
LAL

-Points-
-Rebounds-
-Assists-
-Field Goal %-
-3-Point %-
-Free Throw %-
Injury Report
H2H / Season Series
Last 5 Games






NBA Standings
Eastern Conference — Central


Western Conference — Pacific
| Team | W | L | PCT | GB | STRK |
|---|---|---|---|---|---|
 Golden State | 4 | 2 | .667 | - | W3 |
 LA Clippers | 2 | 1 | .667 | 0.5 | W1 |
| LA Lakers | 2 | 3 | .400 | 1.5 | L2 |
 Phoenix | 1 | 4 | .200 | 2.5 | L2 |
 Sacramento | 0 | 5 | .000 | 3.5 | L5 |
Rosters
Bucks
4th in Central Division
VS
Lakers
1st in Pacific Division
Guard
#11

Tyler Herro
#13

Ryan Rollins
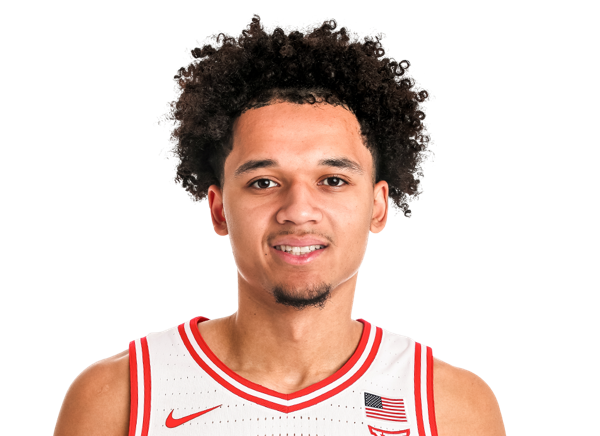
Brayden Burries
#25

Kasparas Jakucionis
#20

AJ Green
#5
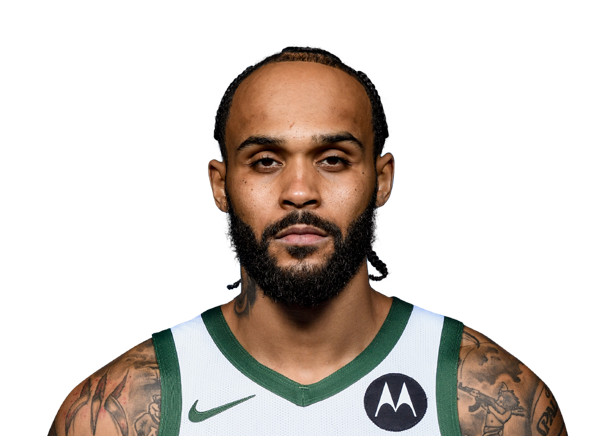
Gary Trent Jr.
Forward
#24

Jaime Jaquez Jr.
#18

Kyle Kuzma
#15
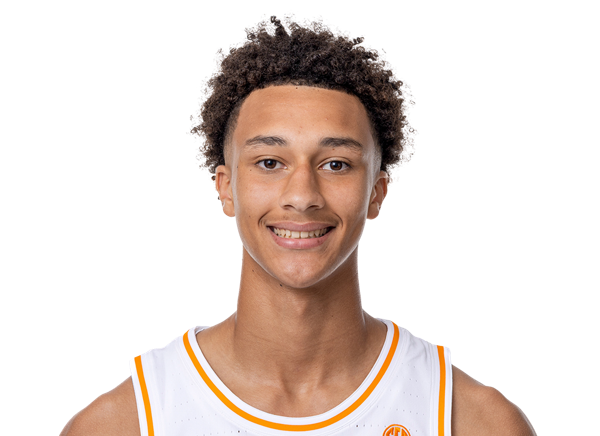
Nate Ament
#21

Ousmane Dieng
#23

Bogoljub Markovic
Center
#9
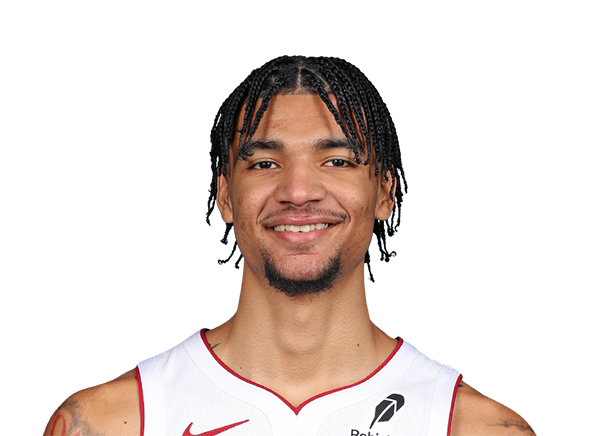
Kel'el Ware
#3

Myles Turner
#00

Jericho Sims
Guard
#77

Luka Doncic
#15

Austin Reaves
#10
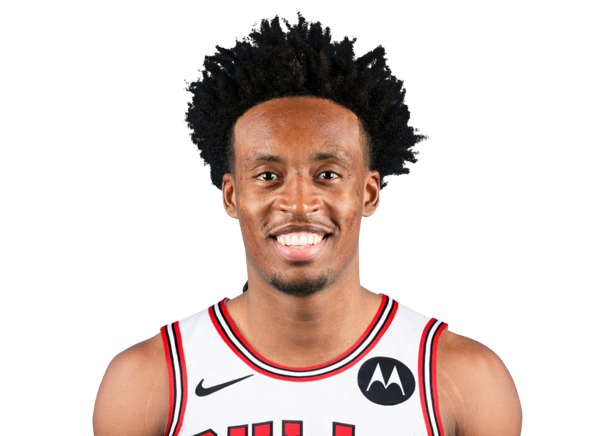
Collin Sexton
#4
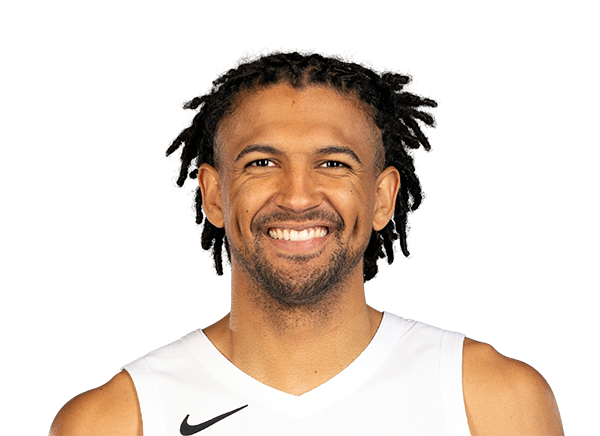
Matisse Thybulle
#5

Quentin Grimes
#7

Jaden Hardy
#9

Bronny James
#30
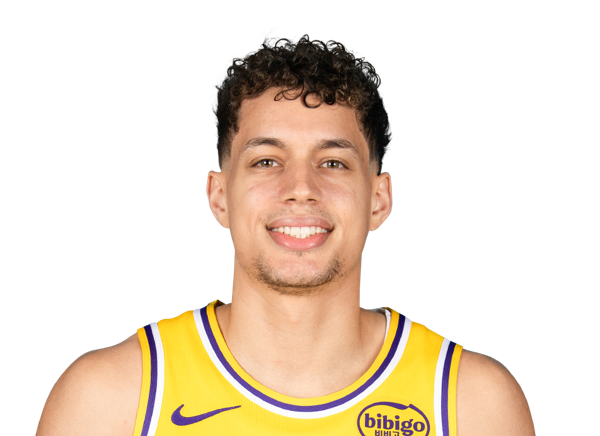
Chris Manon
#43
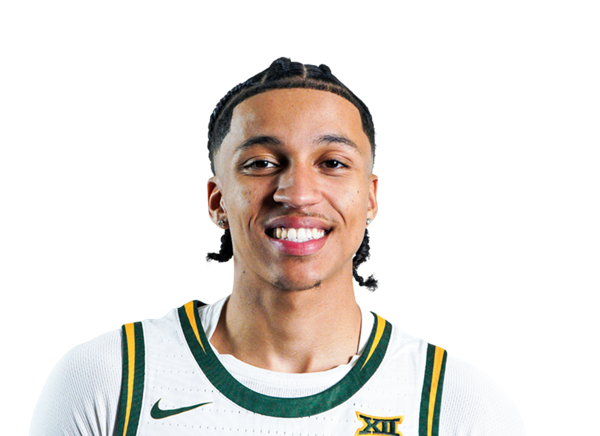
Cameron Carr
Center
#14
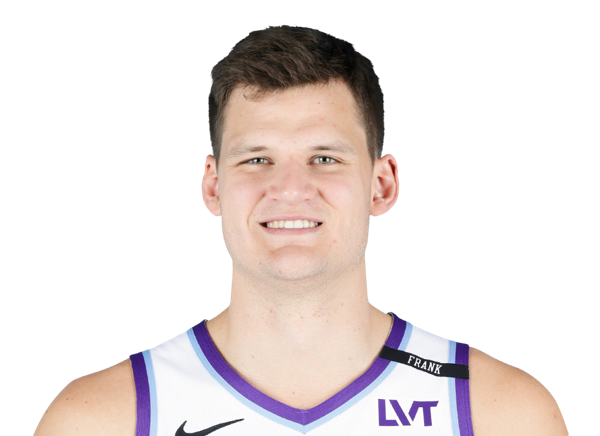
Walker Kessler

Lawson Lovering
Forward
#11
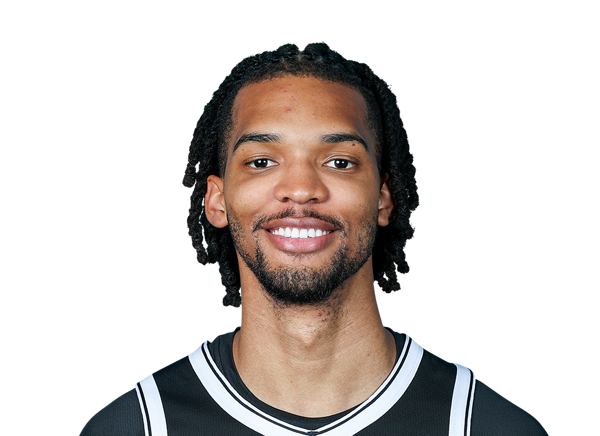
Ziaire Williams
#54

Sandro Mamukelashvili
#12

Jake LaRavia
#55

Kevon Looney
#2

Jarred Vanderbilt
#1

Adou Thiero
Team Statistics
Bucks
4th in Central Division
VS
Lakers
1st in Pacific Division
General
49.6
Rebounds Per Game
40.1
1.6
Assist To Turnover Ratio
1.4
22.6
Fouls Per Game
23.9
7
Games Played
8
0
Games Started
0
0
Minutes
0
0.0
Minutes Per Game
0.0
347
Rebounds
321
347
Rebounds
321
Offensive
71.2
Free Throw Percentage
78.5
33.3
3-Point Field Goal Percentage
39.7
40.9
Average Field Goals Made
42.4
94.3
Average Field Goals Attempted
81.5
14.6
Average 3-Point Field Goals Made
14.9
43.7
Average 3-Point Field Goals Attempted
37.5
14.9
Average Free Throws Made
22.9
20.9
Average Free Throws Attempted
29.1
111.1
Points Per Game
122.5
15.0
Offensive Rebounds Per Game
10.1
25.7
Assists Per Game
25.4
16.1
Turnovers Per Game
17.6
52.0
2-Point Field Goal Percentage
62.5
1.179
Scoring Efficiency
1.503
0.51
Shooting Efficiency
0.61
43.3
Field Goal Percentage
52.0
184.0
2-Point Field Goals Made
220.0
354.0
2-Point Field Goals Attempted
352.0
778
Points
980
105
Offensive Rebounds
81
180
Assists
203
113
Turnovers
141
286
Field Goals Made
339
660
Field Goals Attempted
652
104
Free Throws Made
183
146
Free Throws Attempted
233
102
3-Point Field Goals Made
119
306
3-Point Field Goals Attempted
300
33.3
3-Point Field Goal Percentage
39.7
26.3
2-Point Field Goals Made per Game
27.5
50.6
2-Point Field Goals Attempted per Game
44.0
Defensive
34.6
Defensive Rebounds Per Game
30.0
4.6
Blocks Per Game
6.4
5.6
Steals Per Game
10.1
242
Defensive Rebounds
240
39
Steals
81
32
Blocks
51