

Clippers vs Nets Live Score (30 Jan, 2027)
Game Information
League
NBA
Season
1
Date
January 29, 2027
Tipoff
7:30 PM EST
Status
Scheduled
Team Stats
 LAC
Game Comparison
BKN

-Points-
-Rebounds-
-Assists-
45Field Goal %42
-3-Point %-
-Free Throw %-
Game Leaders
LACBKN
 —#
Points
—
—#
—#Rebounds
—
—#
—#Assists
—
—#
Injury Report
H2H / Season Series
Last 5 Games






NBA Standings
Western Conference — Pacific
| Team | W | L | PCT | GB | STRK |
|---|---|---|---|---|---|
 LA Lakers | 4 | 2 | .667 | - | L1 |
 Golden State | 3 | 3 | .500 | 1 | W3 |
 Phoenix | 1 | 3 | .250 | 2 | L2 |
| LA Clippers | 1 | 4 | .200 | 2.5 | L4 |
 Sacramento | 0 | 5 | .000 | 3.5 | L5 |
Eastern Conference — Atlantic
| Team | W | L | PCT | GB | STRK |
|---|---|---|---|---|---|
 Philadelphia | 5 | 1 | .833 | - | W2 |
 Boston | 4 | 1 | .800 | 0.5 | W4 |
 Toronto | 3 | 2 | .600 | 1.5 | L1 |
 New York | 2 | 4 | .333 | 3 | L1 |
| Brooklyn | 0 | 5 | .000 | 4.5 | L5 |
Rosters
Clippers
4th in Pacific Division
VS
Nets
5th in Atlantic Division
Guard
#10

Darius Garland
#1
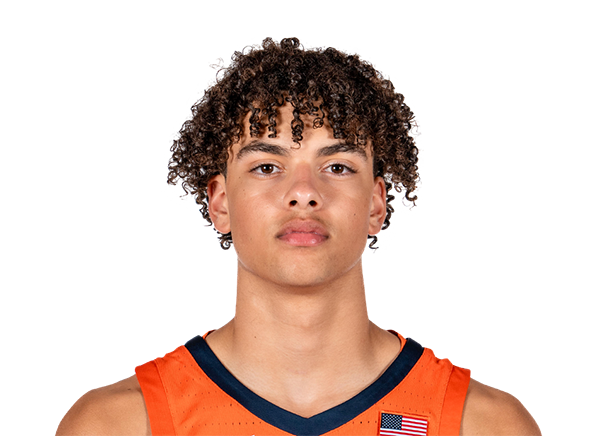
Keaton Wagler
#4
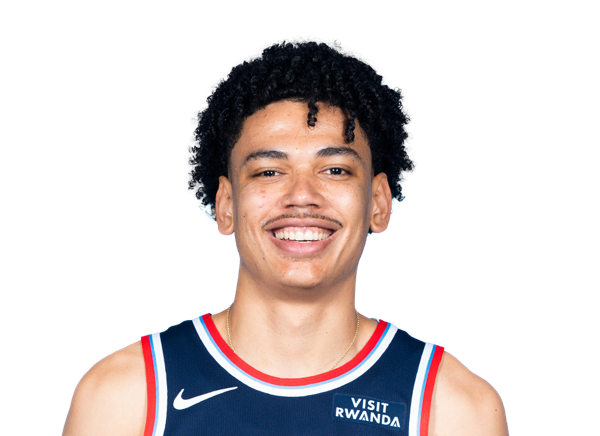
Kobe Sanders
#8

Kris Dunn
#9

Gradey Dick
#31
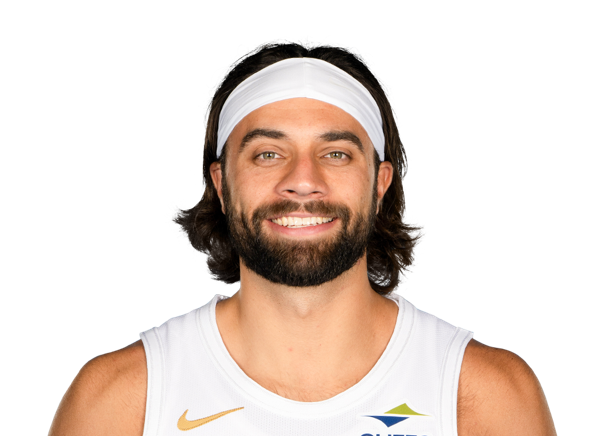
Max Strus
#21
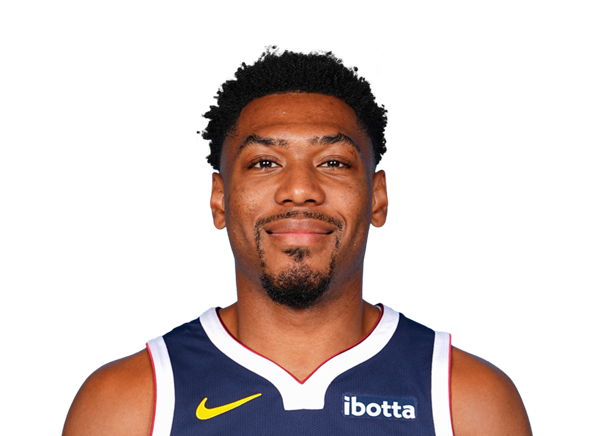
Jalen Pickett
#24

Cam Christie
#20

Blake Wesley
#3
Bradley Beal
#22
Jordan Miller
Forward
#28
Rui Hachimura
#5
Derrick Jones Jr.
#23
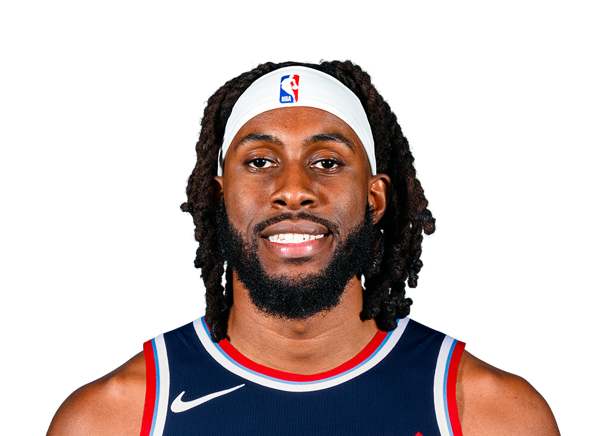
Isaiah Jackson
#18
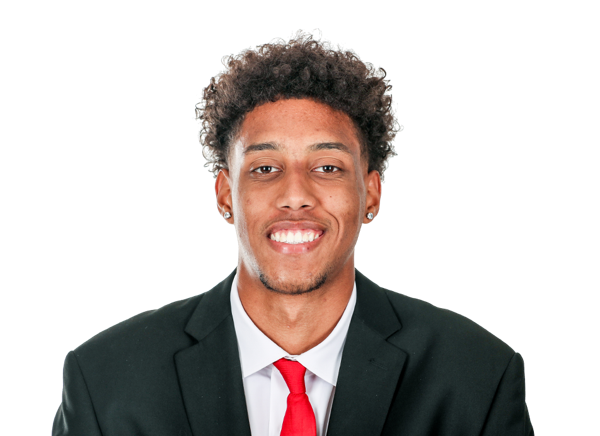
Baba Miller
#12
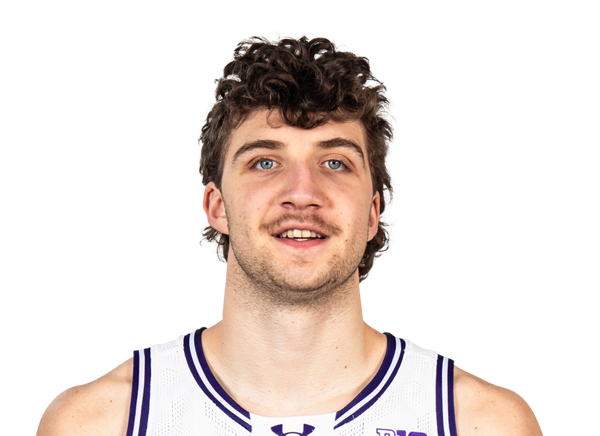
Nick Martinelli
#7
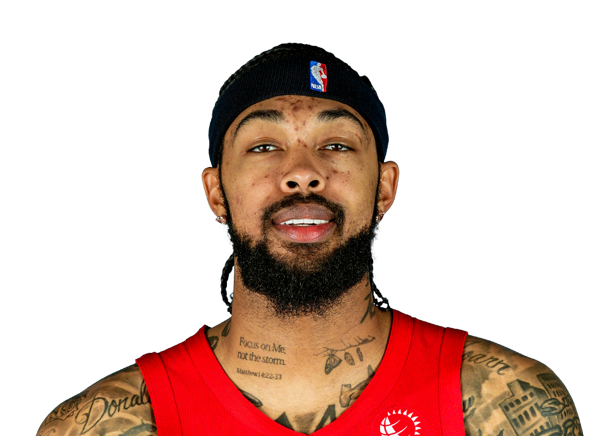
Brandon Ingram
Center
#11
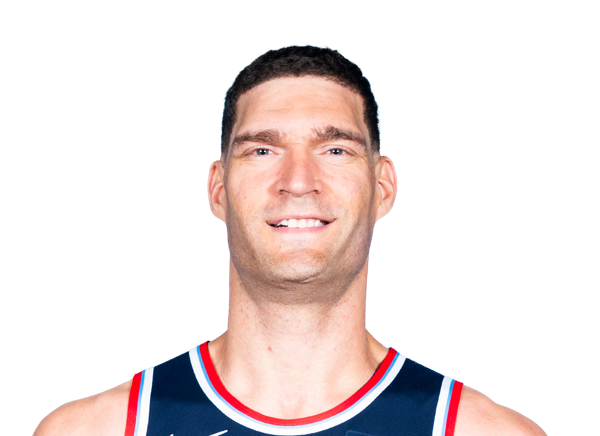
Brook Lopez
#14
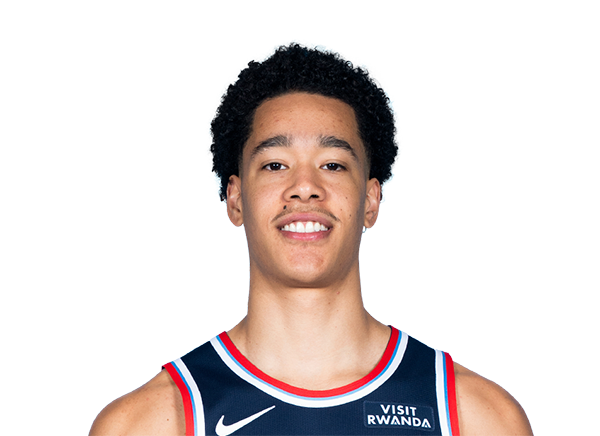
Yanic Konan Niederhauser
Forward
#30
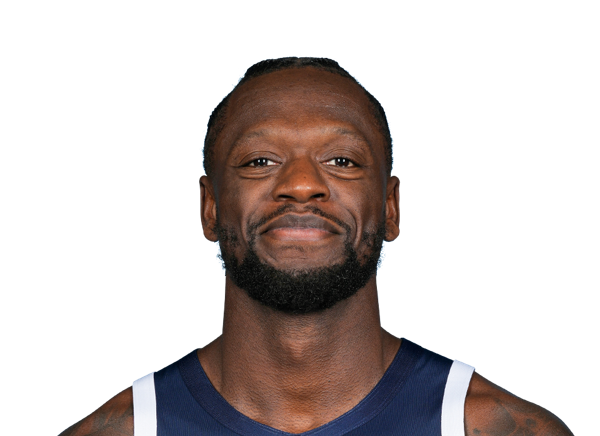
Julius Randle
#17
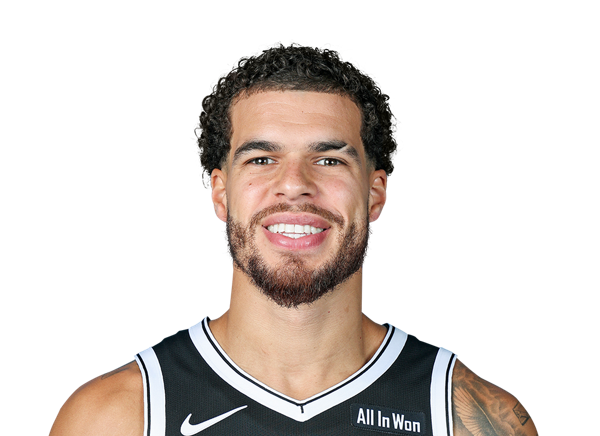
Michael Porter Jr.
#31

Chaney Johnson
#21
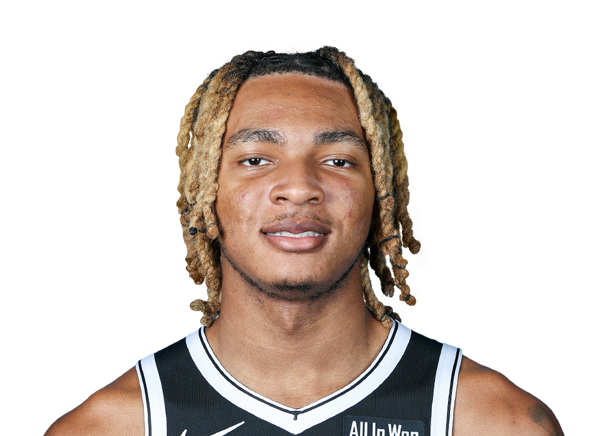
Noah Clowney
#00

Josh Minott
#2
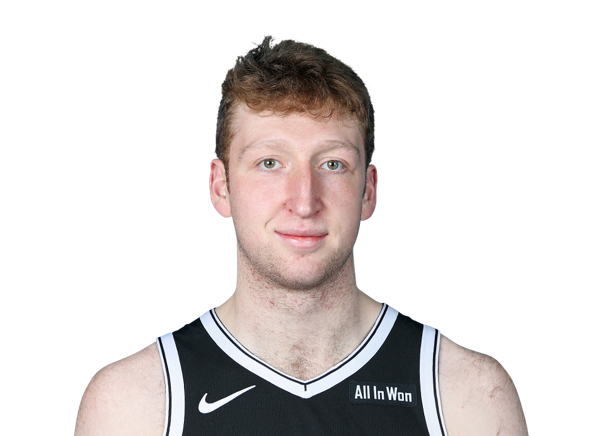
Danny Wolf
#9

Joshua Jefferson
#34

Tyler Bilodeau
Guard
#10
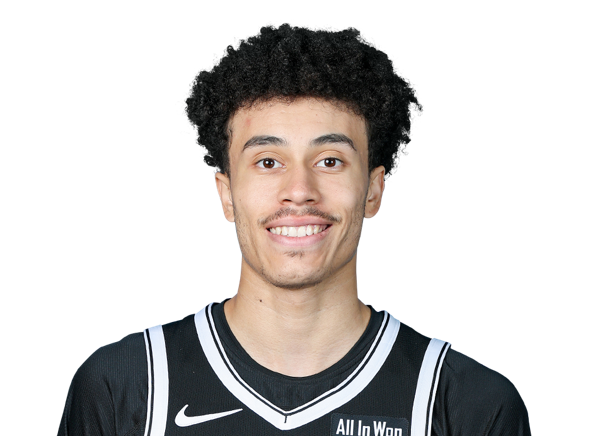
Nolan Traore
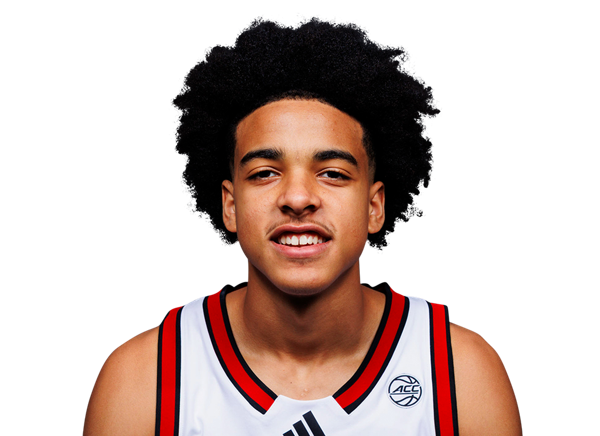
Mikel Brown Jr.
#1

Keon Ellis
#8
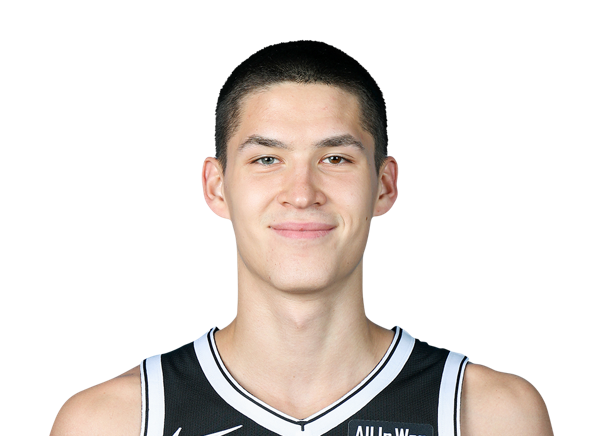
Egor Demin
#77

Ben Saraf
#14

Terance Mann
#4

Drake Powell
Center
#13
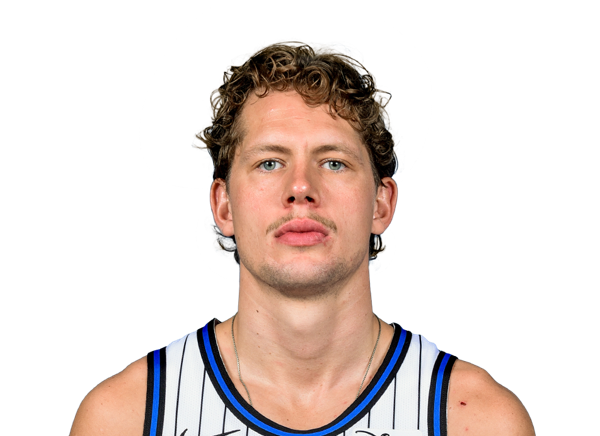
Moritz Wagner
#20
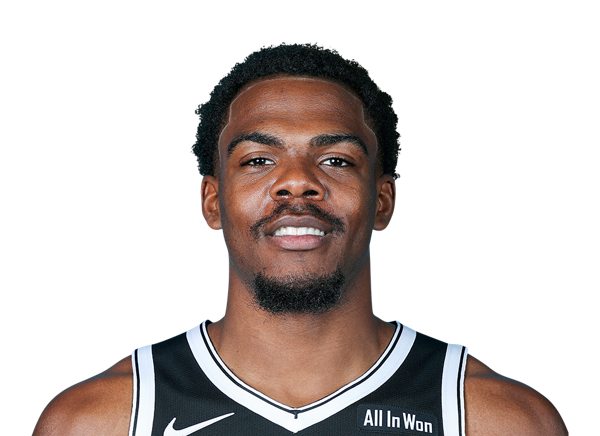
Day'Ron Sharpe
Team Statistics
Clippers
4th in Pacific Division
VS
Nets
5th in Atlantic Division
General
40.7
Rebounds Per Game
43.6
1.3
Assist To Turnover Ratio
1.3
22.1
Fouls Per Game
25.6
7
Games Played
7
0
Games Started
0
0
Minutes
0
0.0
Minutes Per Game
0.0
285
Rebounds
305
285
Rebounds
305
Offensive
81.3
Free Throw Percentage
76.9
38.4
3-Point Field Goal Percentage
35.0
37.7
Average Field Goals Made
35.0
83.9
Average Field Goals Attempted
83.9
13.4
Average 3-Point Field Goals Made
14.1
35.0
Average 3-Point Field Goals Attempted
40.4
19.3
Average Free Throws Made
21.4
23.7
Average Free Throws Attempted
27.9
108.1
Points Per Game
105.6
11.0
Offensive Rebounds Per Game
11.3
25.0
Assists Per Game
22.4
19.6
Turnovers Per Game
17.3
49.7
2-Point Field Goal Percentage
48.0
1.290
Scoring Efficiency
1.259
0.53
Shooting Efficiency
0.50
45.0
Field Goal Percentage
41.7
170.0
2-Point Field Goals Made
146.0
342.0
2-Point Field Goals Attempted
304.0
757
Points
739
77
Offensive Rebounds
79
175
Assists
157
137
Turnovers
121
264
Field Goals Made
245
587
Field Goals Attempted
587
135
Free Throws Made
150
166
Free Throws Attempted
195
94
3-Point Field Goals Made
99
245
3-Point Field Goals Attempted
283
38.4
3-Point Field Goal Percentage
35.0
24.3
2-Point Field Goals Made per Game
20.9
48.9
2-Point Field Goals Attempted per Game
43.4
Defensive
29.7
Defensive Rebounds Per Game
32.3
4.1
Blocks Per Game
5.0
10.6
Steals Per Game
8.7
208
Defensive Rebounds
226
74
Steals
61
29
Blocks
35