

Kings vs Pistons Live Score (31 Jan, 2027)
Game Information
League
NBA
Season
1
Date
January 31, 2027
Tipoff
3:00 PM EST
Status
Scheduled
Team Stats
 SAC
Game Comparison
DET

-Points-
-Rebounds-
-Assists-
45Field Goal %45
-3-Point %-
-Free Throw %-
Game Leaders
SACDET
 —#
Points
—
—#
—#Rebounds
—
—#
—#Assists
—
—#
Injury Report
H2H / Season Series
Last 5 Games









NBA Standings
Western Conference — Pacific
| Team | W | L | PCT | GB | STRK |
|---|---|---|---|---|---|
 LA Lakers | 4 | 2 | .667 | - | L1 |
 Golden State | 3 | 3 | .500 | 1 | W3 |
 Phoenix | 1 | 3 | .250 | 2 | L2 |
 LA Clippers | 1 | 4 | .200 | 2.5 | L4 |
| Sacramento | 0 | 6 | .000 | 4 | L6 |




Rosters
Kings
4th in Pacific Division
VS
Pistons
1st in Central Division
Guard
#5
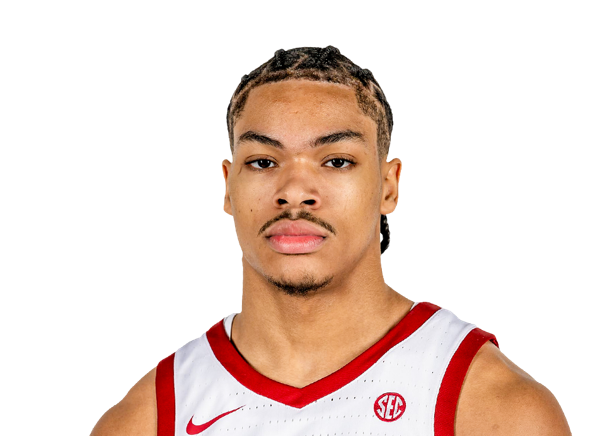
Darius Acuff Jr.
#8

Zach LaVine
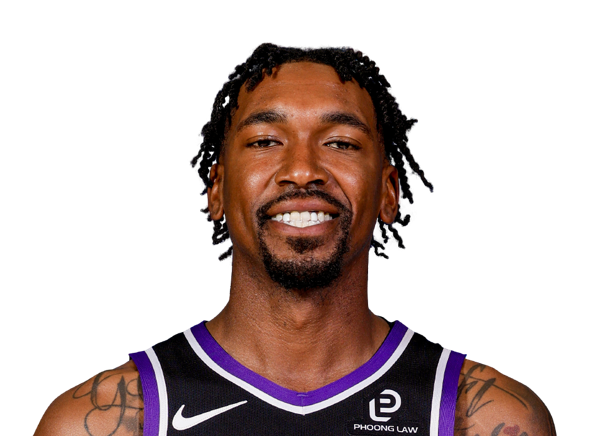
Malik Monk
#34

Emanuel Sharp
#29

Daeqwon Plowden
#10
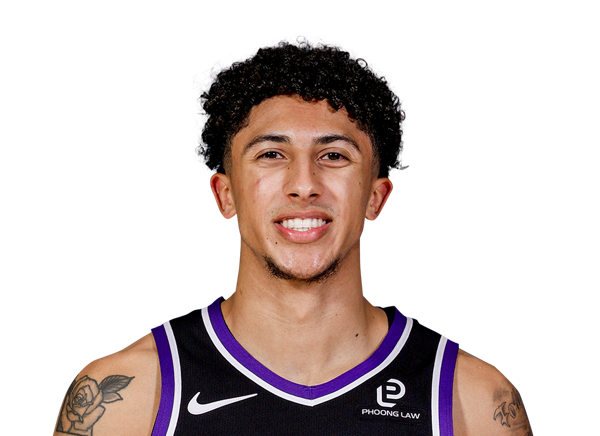
Nique Clifford
#25
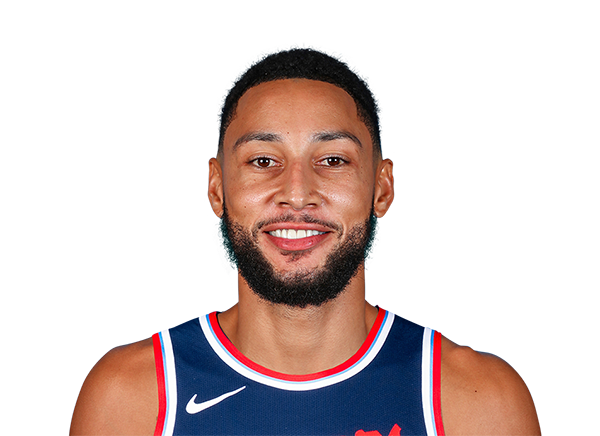
Ben Simmons
Forward
#11

Domantas Sabonis
#15

De'Andre Hunter
#9
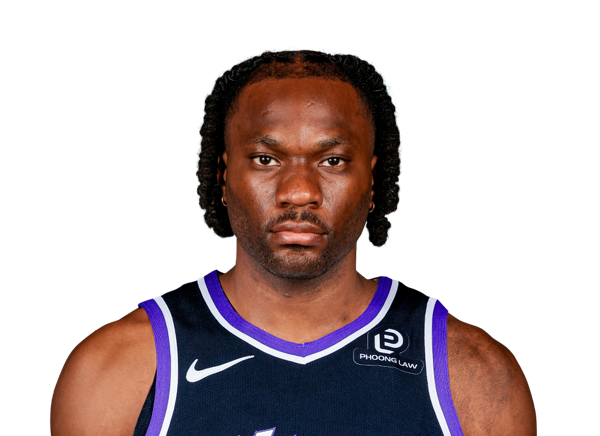
Precious Achiuwa
#13
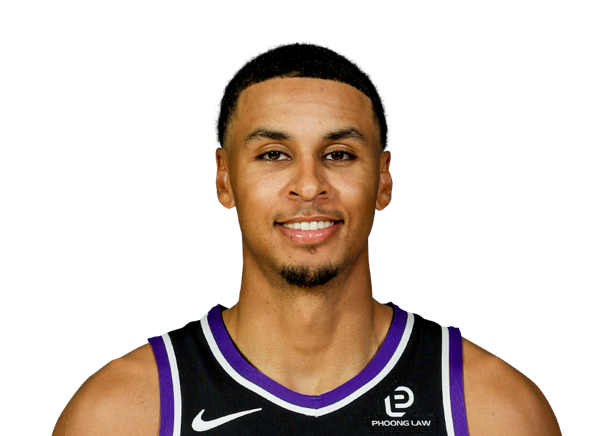
Keegan Murray
#19
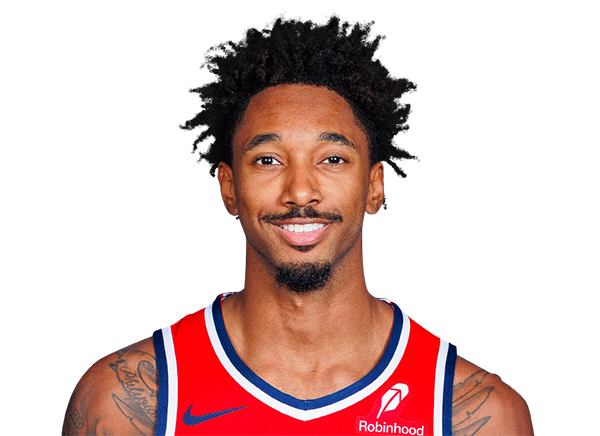
Leaky Black
#22

Jonathan Mogbo
#33
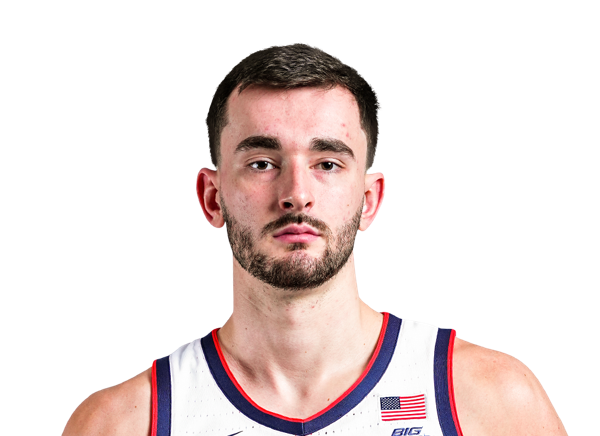
Alex Karaban
Center
#32
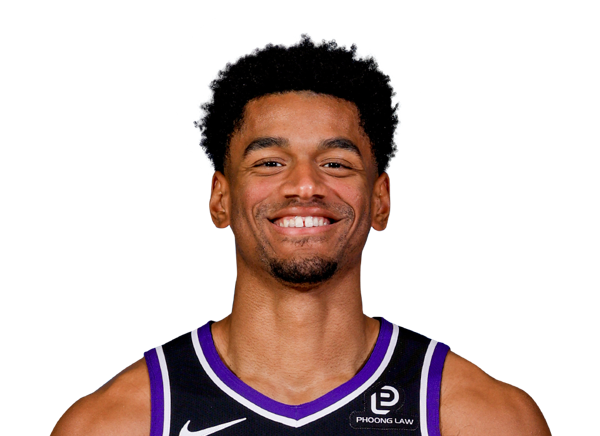
Dylan Cardwell
#42

Maxime Raynaud
Guard
#2

Cade Cunningham
#9
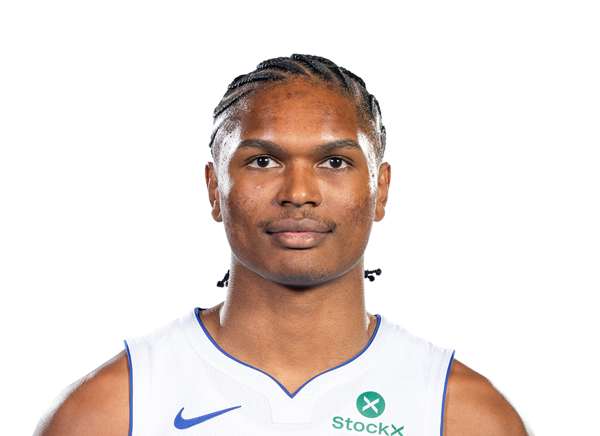
Ausar Thompson
#24

Daniss Jenkins
#27

Kevin Huerter
#31

Javonte Green
#17

Isaiah Joe
#8

Chaz Lanier
#23
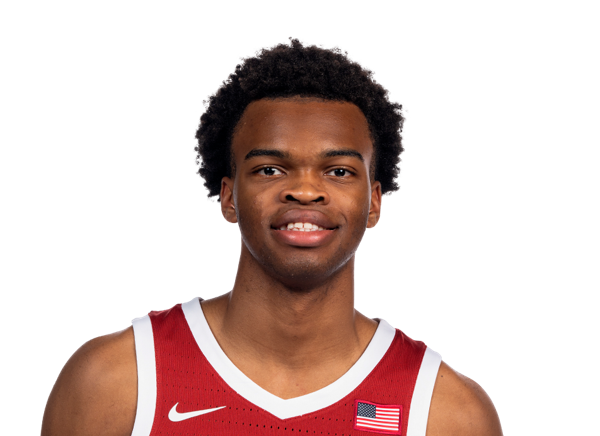
Ebuka Okorie
#94

Elijah Harkless
Forward
#55
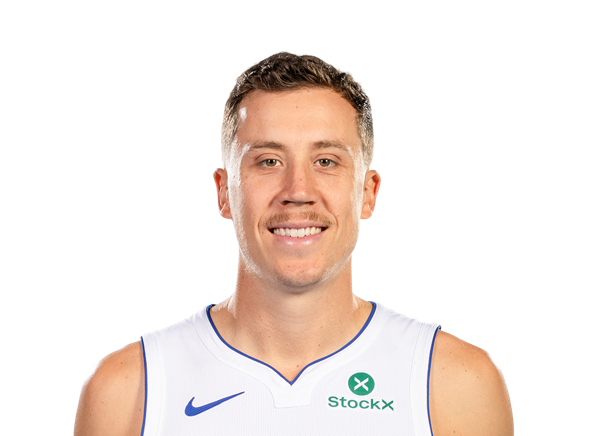
Duncan Robinson
#7
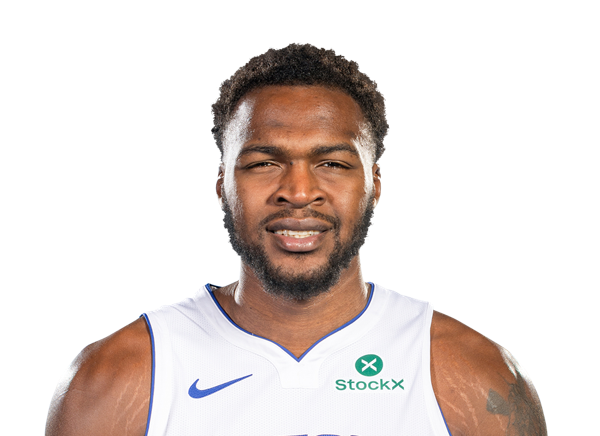
Paul Reed
#20
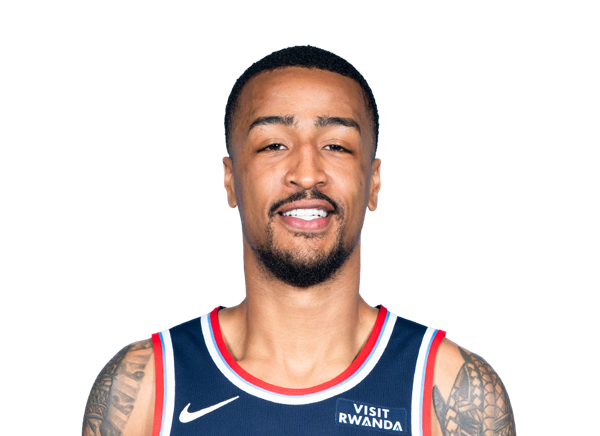
John Collins
#5
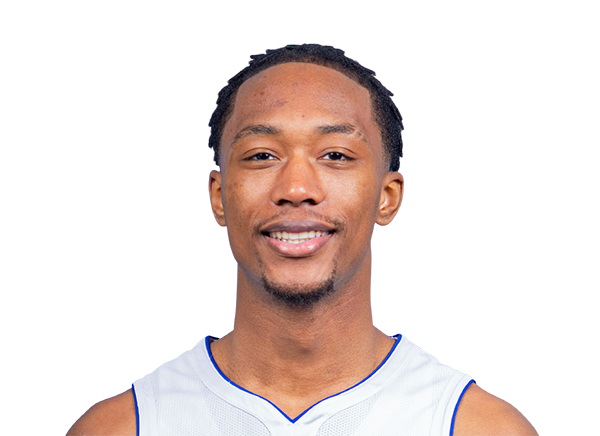
Ronald Holland II
#35

Tolu Smith
#12

Taurean Prince
Center

Jalen Duren
#13

Isaac Jones
Team Statistics
Kings
4th in Pacific Division
VS
Pistons
1st in Central Division
General
40.9
Rebounds Per Game
44.0
1.5
Assist To Turnover Ratio
1.9
23.5
Fouls Per Game
22.4
8
Games Played
8
0
Games Started
0
0
Minutes
0
0.0
Minutes Per Game
0.0
327
Rebounds
352
327
Rebounds
352
Offensive
75.1
Free Throw Percentage
75.9
32.5
3-Point Field Goal Percentage
37.8
40.1
Average Field Goals Made
39.8
88.8
Average Field Goals Attempted
85.0
11.6
Average 3-Point Field Goals Made
13.9
35.8
Average 3-Point Field Goals Attempted
36.8
17.4
Average Free Throws Made
17.8
23.1
Average Free Throws Attempted
23.4
109.3
Points Per Game
111.1
11.1
Offensive Rebounds Per Game
10.3
24.4
Assists Per Game
26.9
16.1
Turnovers Per Game
14.5
53.8
2-Point Field Goal Percentage
53.6
1.231
Scoring Efficiency
1.307
0.52
Shooting Efficiency
0.55
45.2
Field Goal Percentage
46.8
228.0
2-Point Field Goals Made
207.0
424.0
2-Point Field Goals Attempted
386.0
874
Points
889
89
Offensive Rebounds
82
195
Assists
215
129
Turnovers
116
321
Field Goals Made
318
710
Field Goals Attempted
680
139
Free Throws Made
142
185
Free Throws Attempted
187
93
3-Point Field Goals Made
111
286
3-Point Field Goals Attempted
294
32.5
3-Point Field Goal Percentage
37.8
28.5
2-Point Field Goals Made per Game
25.9
53.0
2-Point Field Goals Attempted per Game
48.3
Defensive
29.8
Defensive Rebounds Per Game
33.8
2.9
Blocks Per Game
6.5
7.8
Steals Per Game
9.3
238
Defensive Rebounds
270
62
Steals
74
23
Blocks
52