

Knicks vs 76ers Live Score (12 Feb, 2027)
Game Information
League
NBA
Season
1
Date
February 11, 2027
Tipoff
7:00 PM EST
Status
Scheduled
Team Stats
 NY
Game Comparison
PHI
-Points-
-Rebounds-
-Assists-
44Field Goal %45
-3-Point %-
-Free Throw %-
Game Leaders
NYPHI
 —#
Points
—
—#
—#
Rebounds
—
—#
—#
Assists
—
—#
Injury Report
H2H / Season Series
Last 5 Games




NBA Standings
Eastern Conference — Atlantic
| Team | W | L | PCT | GB | STRK |
|---|---|---|---|---|---|
 Boston | 10 | 2 | .833 | - | W5 |
| Philadelphia | 10 | 3 | .769 | 0.5 | W1 |
| New York | 6 | 5 | .545 | 3.5 | L1 |
 Toronto | 5 | 7 | .417 | 5 | L3 |
 Brooklyn | 3 | 8 | .273 | 6.5 | W1 |
Rosters
Knicks
3rd in Atlantic Division
VS
76ers
1st in Atlantic Division
Guard
#5

Jose Alvarado
#25

Mikal Bridges
#11

Jalen Brunson
#00

Jordan Clarkson
#3
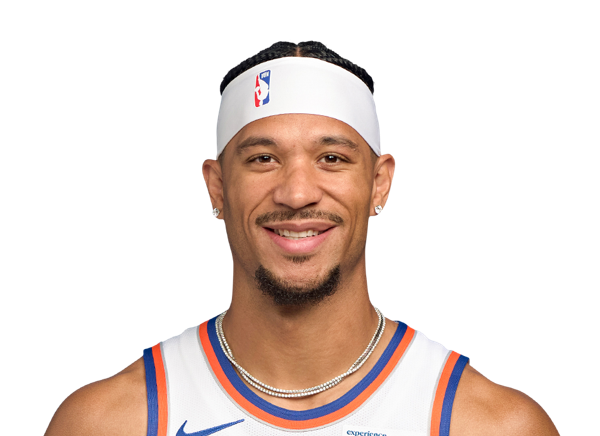
Josh Hart
Jack Kayil
#13

Tyler Kolek
#2

Miles McBride
#9
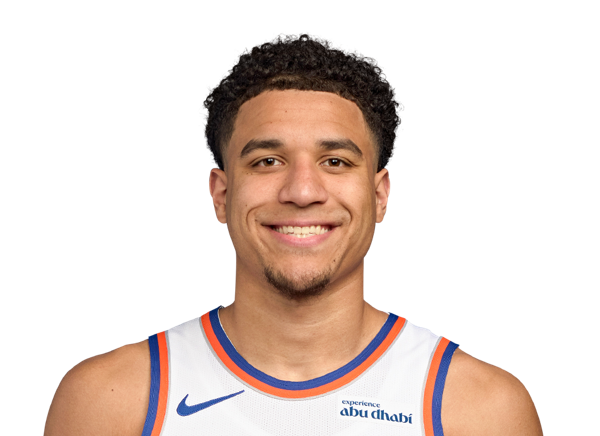
Kevin McCullar Jr.
#44

Landry Shamet
Forward
#8
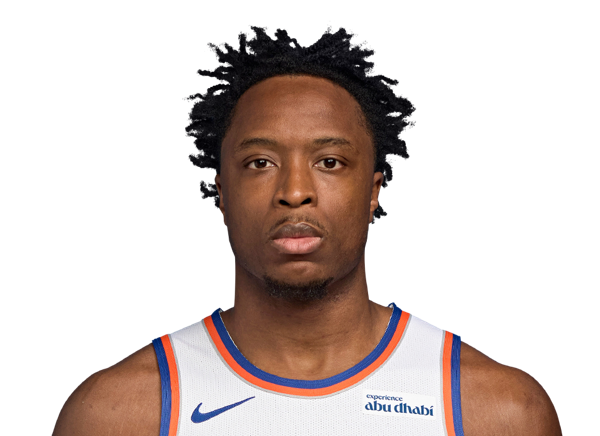
OG Anunoby
#4
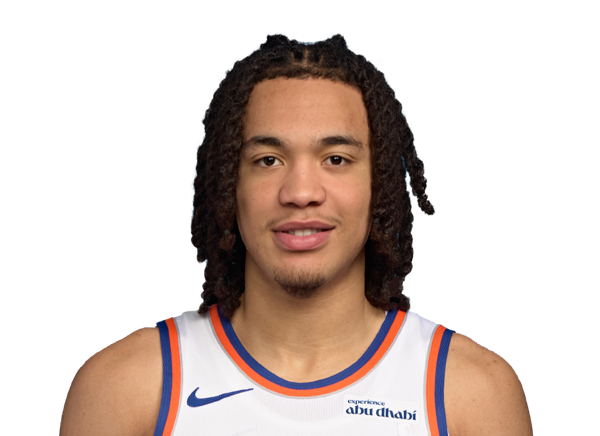
Pacome Dadiet
#51
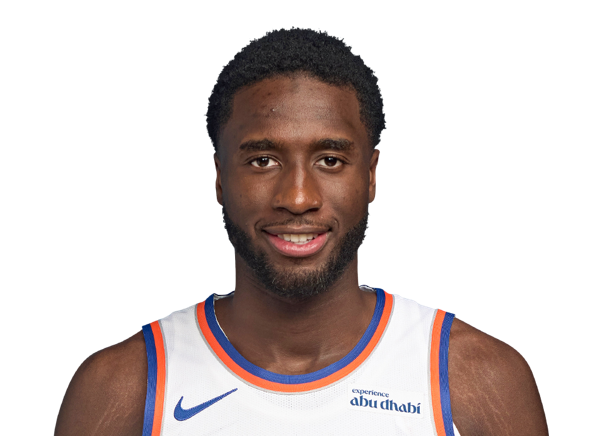
Mohamed Diawara
#50

Trey Jemison III

Tyler Nickel
Center

Andre Drummond
#32
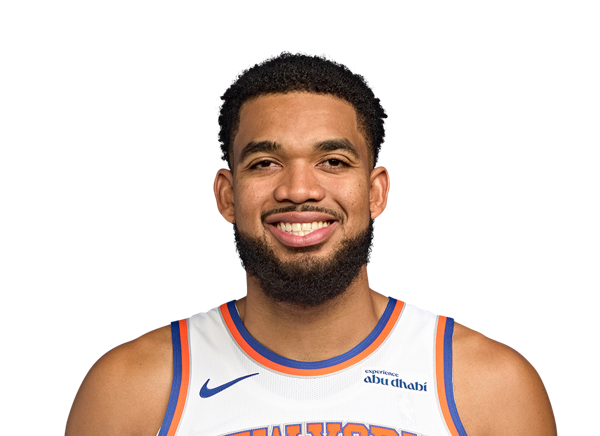
Karl-Anthony Towns
Guard

Tyrese Maxey
#7

Jaylen Brown
#77
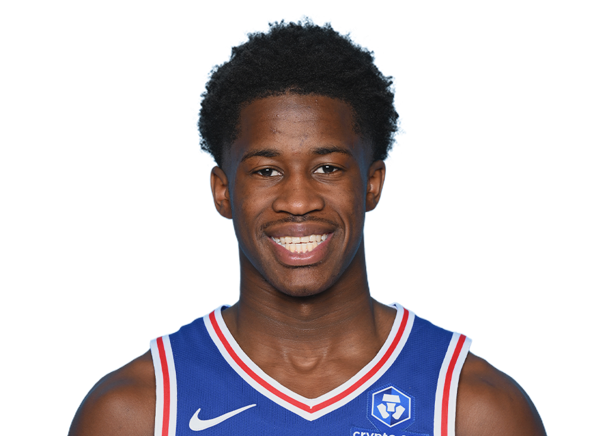
VJ Edgecombe
#5
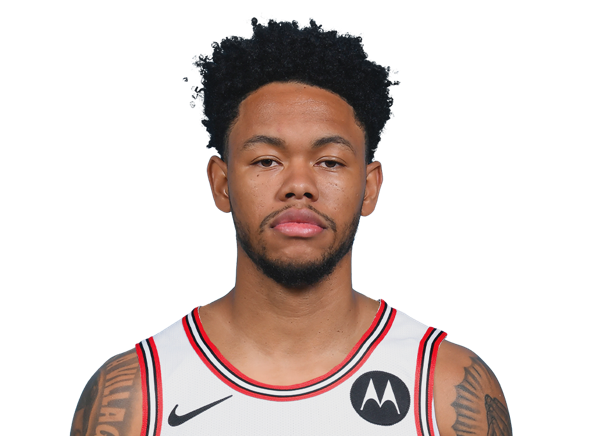
Anfernee Simons
#1

Kentavious Caldwell-Pope
#00

Labaron Philon Jr.
#12

Rayan Rupert
#8

Caleb Love
Center
#21

Joel Embiid
#30

Adem Bona
#99

Tacko Fall
#55

Ariel Hukporti
Forward
#23
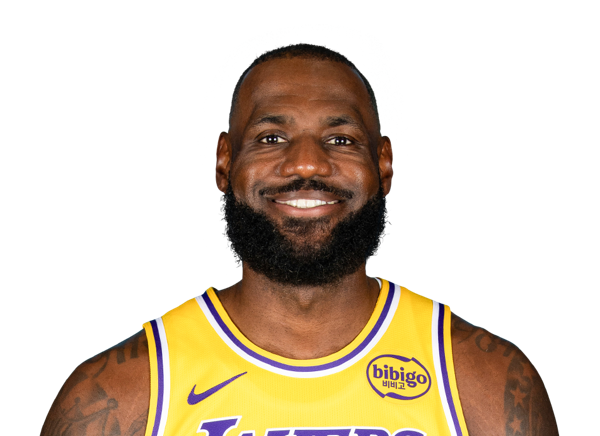
LeBron James
#33
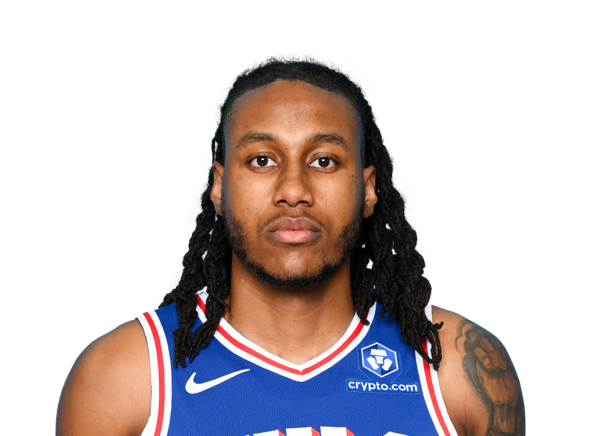
Jabari Walker
#45

Dean Wade
#11

Justin Edwards
#25

Dominick Barlow
Team Statistics
Knicks
3rd in Atlantic Division
VS
76ers
1st in Atlantic Division
General
47.8
Rebounds Per Game
42.9
2.0
Assist To Turnover Ratio
2.2
20.7
Fouls Per Game
20.9
13
Games Played
14
0
Games Started
0
0
Minutes
0
0.0
Minutes Per Game
0.0
622
Rebounds
600
622
Rebounds
600
Offensive
79.7
Free Throw Percentage
78.2
36.1
3-Point Field Goal Percentage
35.1
38.7
Average Field Goals Made
40.1
88.8
Average Field Goals Attempted
87.9
14.7
Average 3-Point Field Goals Made
12.1
40.7
Average 3-Point Field Goals Attempted
34.4
17.8
Average Free Throws Made
20.2
22.4
Average Free Throws Attempted
25.9
109.9
Points Per Game
112.6
13.6
Offensive Rebounds Per Game
10.0
26.8
Assists Per Game
26.3
13.2
Turnovers Per Game
12.1
49.9
2-Point Field Goal Percentage
52.5
1.238
Scoring Efficiency
1.281
0.52
Shooting Efficiency
0.53
43.6
Field Goal Percentage
45.7
312.0
2-Point Field Goals Made
393.0
625.0
2-Point Field Goals Attempted
748.0
1429
Points
1576
177
Offensive Rebounds
140
348
Assists
368
171
Turnovers
170
503
Field Goals Made
562
1154
Field Goals Attempted
1230
232
Free Throws Made
283
291
Free Throws Attempted
362
191
3-Point Field Goals Made
169
529
3-Point Field Goals Attempted
482
36.1
3-Point Field Goal Percentage
35.1
24.0
2-Point Field Goals Made per Game
28.1
48.1
2-Point Field Goals Attempted per Game
53.4
Defensive
34.2
Defensive Rebounds Per Game
32.9
4.2
Blocks Per Game
4.2
7.5
Steals Per Game
8.1
445
Defensive Rebounds
460
98
Steals
114
54
Blocks
59