

Knicks vs Celtics Live Score (14 Jan, 2027)
Game Information
League
NBA
Season
1
Date
January 13, 2027
Tipoff
7:00 PM EST
Status
Scheduled
Team Stats
 NY
Game Comparison
BOS

-Points-
-Rebounds-
-Assists-
-Field Goal %-
-3-Point %-
-Free Throw %-
H2H / Season Series
Last 5 Games





NBA Standings
Eastern Conference — Atlantic
| Team | W | L | PCT | GB | STRK |
|---|---|---|---|---|---|
| Boston | 3 | 0 | 1.000 | - | W3 |
 Brooklyn | 3 | 1 | .750 | 0.5 | L1 |
 Toronto | 2 | 1 | .667 | 1 | W2 |
 Philadelphia | 1 | 2 | .333 | 2 | L2 |
| New York | 0 | 4 | .000 | 3.5 | L4 |
Rosters
Knicks
3rd in Atlantic Division
VS
Celtics
2nd in Atlantic Division
Guard
#5

Jose Alvarado
#25

Mikal Bridges
#11

Jalen Brunson
#00

Jordan Clarkson
#3
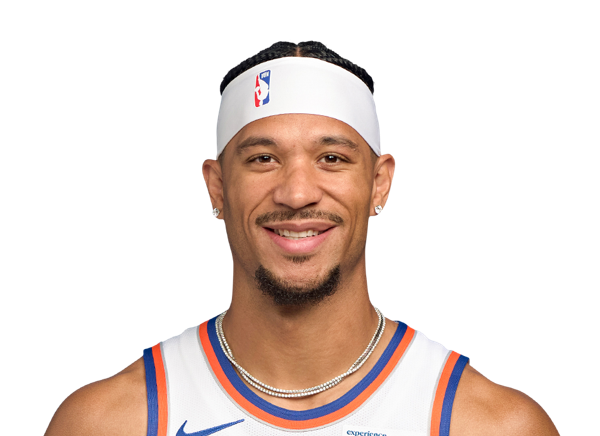
Josh Hart

Jack Kayil
#13

Tyler Kolek
#2

Miles McBride
#9
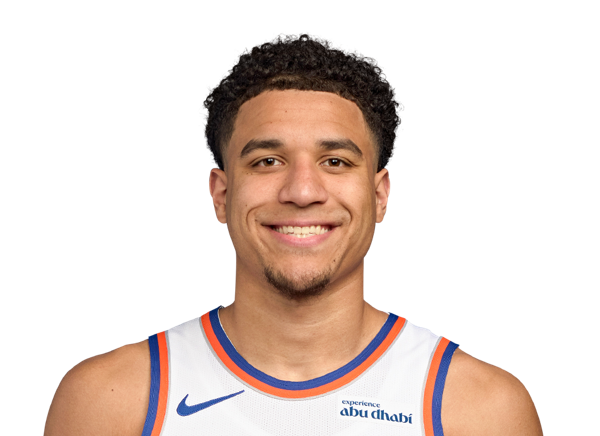
Kevin McCullar Jr.
#44

Landry Shamet
Forward
#8

OG Anunoby
#4
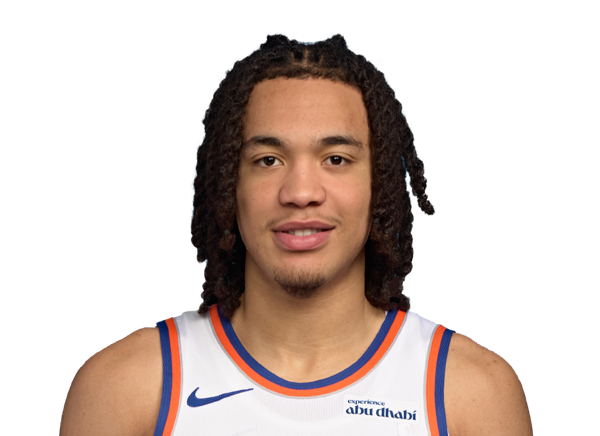
Pacome Dadiet
#51
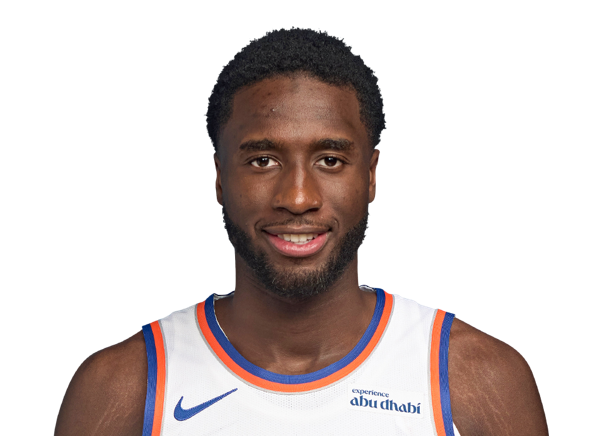
Mohamed Diawara
#50

Trey Jemison III

Tyler Nickel
Center

Andre Drummond
#32
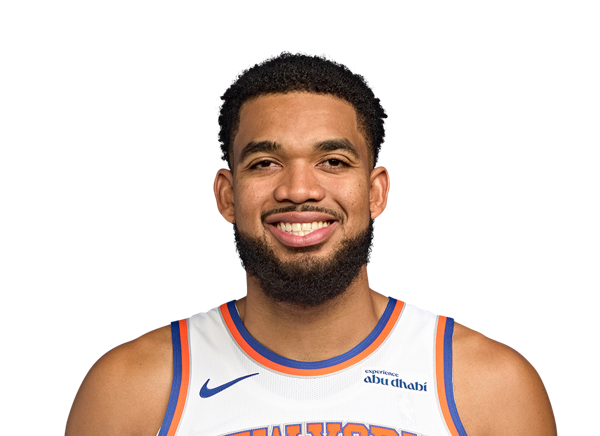
Karl-Anthony Towns
Forward

Jayson Tatum
#13

Paul George
#30

Sam Hauser
#12

Chris Cenac Jr.
#20
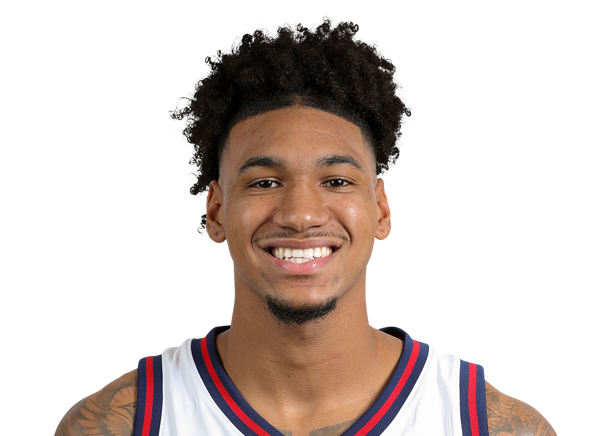
Dillon Mitchell
Guard
#11

Payton Pritchard
#9
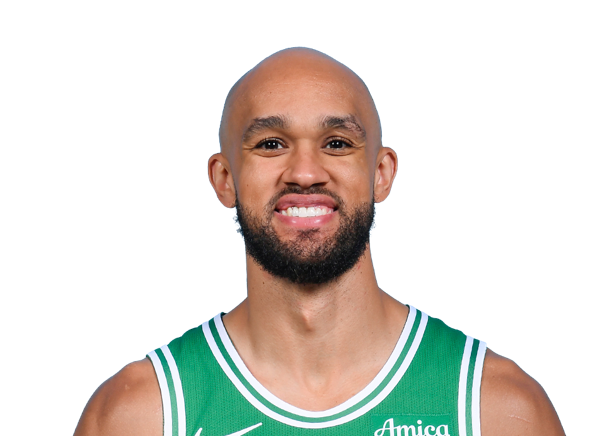
Derrick White
#55

Baylor Scheierman
#27

Jordan Walsh
#28

Hugo Gonzalez
#45

Mike Conley
#8

Ron Harper Jr.
#99
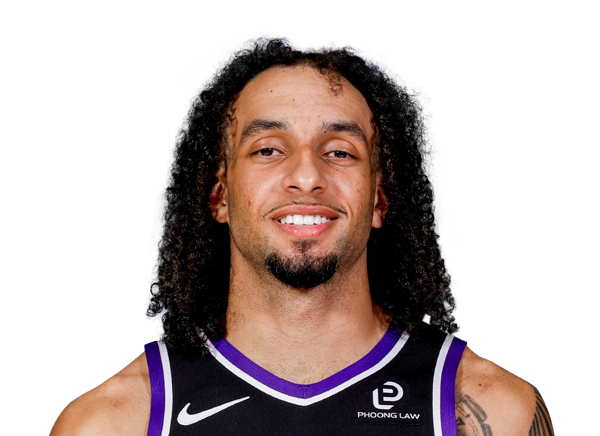
Devin Carter
Center
#88

Neemias Queta
#52

Luka Garza
#4

Mitchell Robinson
Team Statistics
Knicks
3rd in Atlantic Division
VS
Celtics
2nd in Atlantic Division
General
48.3
Rebounds Per Game
43.9
1.8
Assist To Turnover Ratio
1.8
21.9
Fouls Per Game
23.4
8
Games Played
8
0
Games Started
0
0
Minutes
0
0.0
Minutes Per Game
0.0
386
Rebounds
351
386
Rebounds
351
Offensive
77.5
Free Throw Percentage
78.1
36.6
3-Point Field Goal Percentage
35.3
38.0
Average Field Goals Made
39.5
88.5
Average Field Goals Attempted
87.6
14.6
Average 3-Point Field Goals Made
14.3
40.0
Average 3-Point Field Goals Attempted
40.4
19.4
Average Free Throws Made
21.0
25.0
Average Free Throws Attempted
26.9
110.0
Points Per Game
114.3
14.4
Offensive Rebounds Per Game
13.4
26.0
Assists Per Game
26.5
14.4
Turnovers Per Game
14.4
48.2
2-Point Field Goal Percentage
53.4
1.243
Scoring Efficiency
1.304
0.51
Shooting Efficiency
0.53
42.9
Field Goal Percentage
45.1
187.0
2-Point Field Goals Made
202.0
388.0
2-Point Field Goals Attempted
378.0
880
Points
914
115
Offensive Rebounds
107
208
Assists
212
115
Turnovers
115
304
Field Goals Made
316
708
Field Goals Attempted
701
155
Free Throws Made
168
200
Free Throws Attempted
215
117
3-Point Field Goals Made
114
320
3-Point Field Goals Attempted
323
36.6
3-Point Field Goal Percentage
35.3
23.4
2-Point Field Goals Made per Game
25.3
48.5
2-Point Field Goals Attempted per Game
47.3
Defensive
33.9
Defensive Rebounds Per Game
30.5
4.4
Blocks Per Game
4.0
7.4
Steals Per Game
8.6
271
Defensive Rebounds
244
59
Steals
69
35
Blocks
32