

Knicks vs Suns Live Score (1 Jan, 2027)
Game Information
League
NBA
Season
1
Date
December 31, 2026
Tipoff
9:00 PM EST
Status
Scheduled
Team Stats
 NY
Game Comparison
PHX
-Points-
-Rebounds-
-Assists-
44Field Goal %48
-3-Point %-
-Free Throw %-
Game Leaders
NYPHX
 —#
Points
—
—#
—#
Rebounds
—
—#
—#
Assists
—
—#
Injury Report
Phoenix Suns
H2H / Season Series
Last 5 Games





NBA Standings
Eastern Conference — Atlantic
| Team | W | L | PCT | GB | STRK |
|---|---|---|---|---|---|
 Philadelphia | 13 | 3 | .813 | - | W4 |
 Boston | 11 | 4 | .733 | 1.5 | L2 |
| New York | 9 | 6 | .600 | 3.5 | W3 |
 Toronto | 5 | 10 | .333 | 7.5 | L6 |
 Brooklyn | 3 | 11 | .214 | 9 | L3 |
Western Conference — Pacific
| Team | W | L | PCT | GB | STRK |
|---|---|---|---|---|---|
 LA Lakers | 13 | 3 | .813 | - | L1 |
 Golden State | 8 | 8 | .500 | 5 | L5 |
| Phoenix | 7 | 7 | .500 | 5 | W2 |
 LA Clippers | 4 | 10 | .286 | 8 | L2 |
 Sacramento | 1 | 13 | .071 | 11 | L7 |
Rosters
Knicks
3rd in Atlantic Division
VS
Suns
2nd in Pacific Division
Guard
#5

Jose Alvarado
#25

Mikal Bridges
#11

Jalen Brunson
#00

Jordan Clarkson
#3
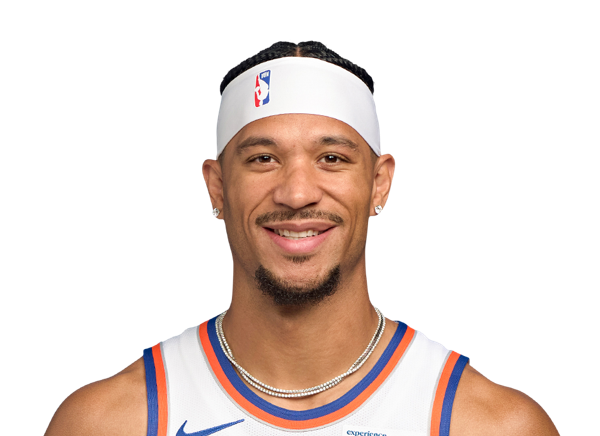
Josh Hart
Jack Kayil
#13

Tyler Kolek
#2

Miles McBride
#9
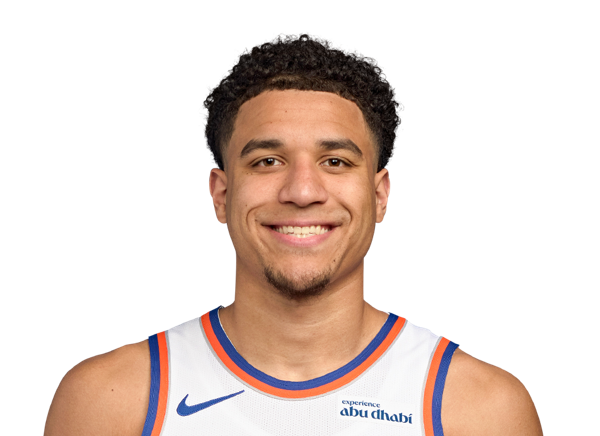
Kevin McCullar Jr.
#44

Landry Shamet
Forward
#8
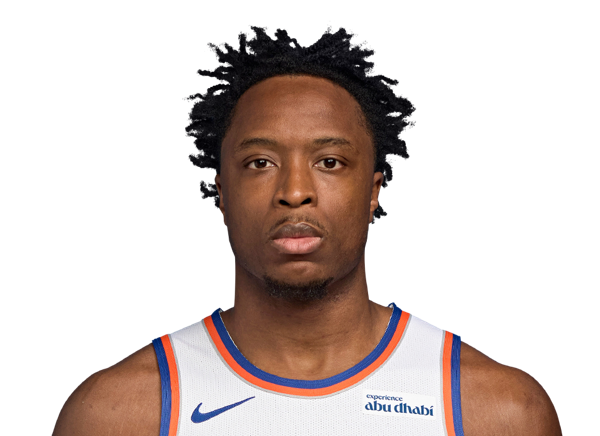
OG Anunoby
#4
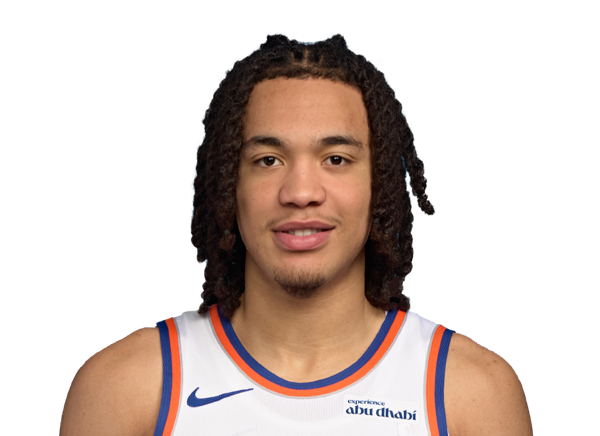
Pacome Dadiet
#51
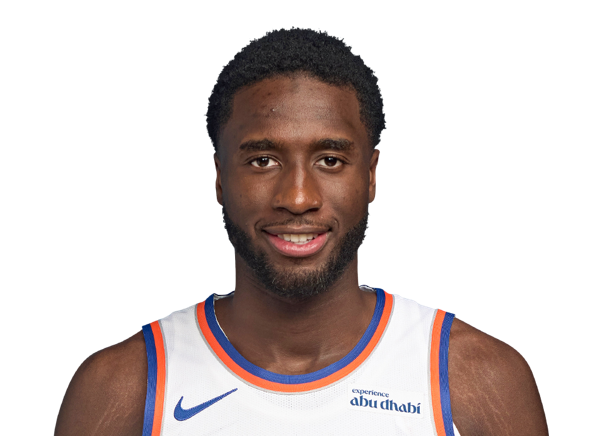
Mohamed Diawara
#50

Trey Jemison III

Tyler Nickel
Center

Andre Drummond
#32
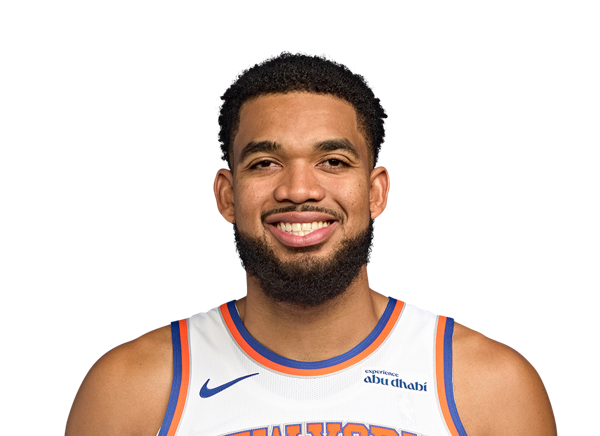
Karl-Anthony Towns
Guard
#15
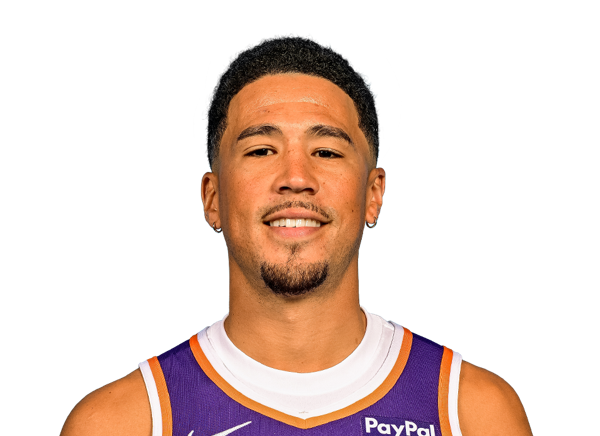
Devin Booker
#4

Jalen Green
#12

Collin Gillespie
#8

Luke Kennard
#23

Jordan Goodwin
#17

Jamaree Bouyea
#61
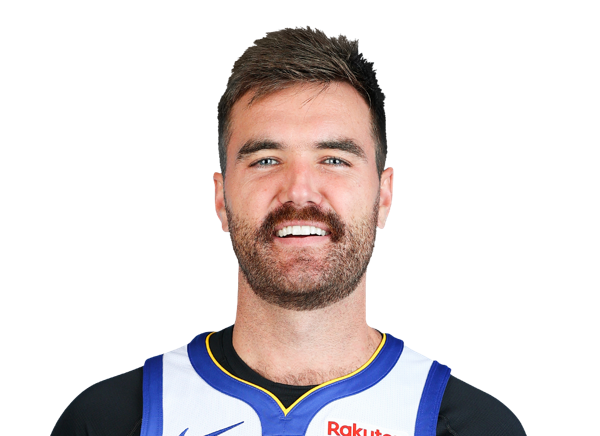
Pat Spencer
Forward
#3

Dillon Brooks
#22
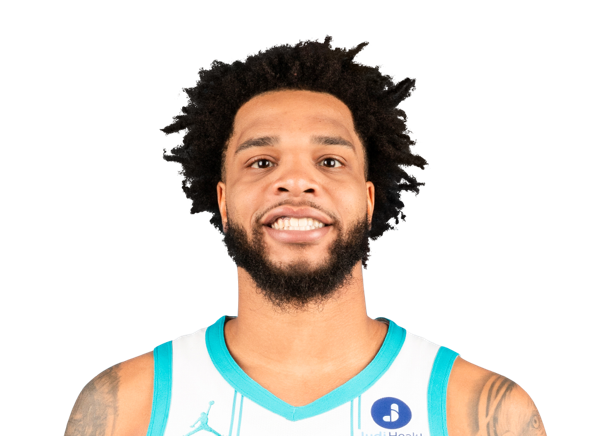
Miles Bridges
#11
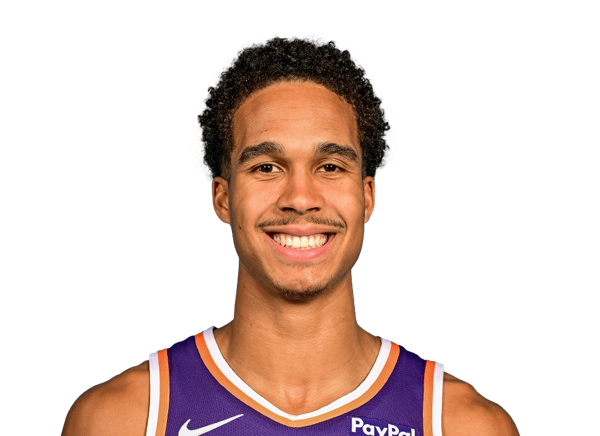
Oso Ighodaro

Ryan Dunn
#18

Koa Peat
#20

Rasheer Fleming
Center
#10
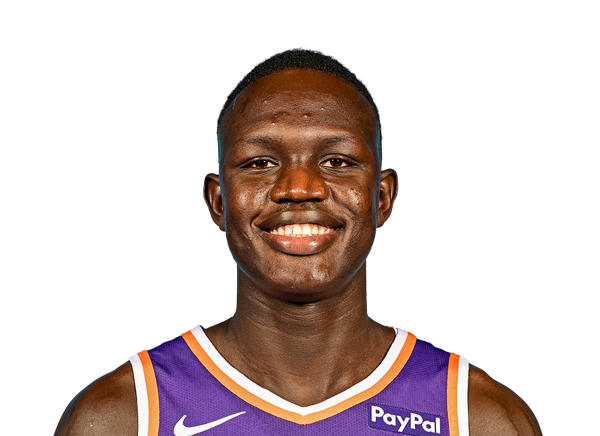
Khaman Maluach
#26

Duop Reath
#25

Mark Williams
Team Statistics
Knicks
3rd in Atlantic Division
VS
Suns
2nd in Pacific Division
General
46.7
Rebounds Per Game
40.8
2.0
Assist To Turnover Ratio
2.1
20.4
Fouls Per Game
21.7
16
Games Played
15
0
Games Started
0
0
Minutes
0
0.0
Minutes Per Game
0.0
747
Rebounds
612
747
Rebounds
612
Offensive
80.7
Free Throw Percentage
75.8
37.0
3-Point Field Goal Percentage
36.6
38.7
Average Field Goals Made
42.0
87.8
Average Field Goals Attempted
88.6
14.8
Average 3-Point Field Goals Made
13.6
40.0
Average 3-Point Field Goals Attempted
37.1
16.5
Average Free Throws Made
16.3
20.4
Average Free Throws Attempted
21.5
108.7
Points Per Game
113.9
12.9
Offensive Rebounds Per Game
11.4
26.5
Assists Per Game
27.5
13.1
Turnovers Per Game
13.0
50.0
2-Point Field Goal Percentage
55.2
1.239
Scoring Efficiency
1.285
0.53
Shooting Efficiency
0.55
44.1
Field Goal Percentage
47.4
382.0
2-Point Field Goals Made
426.0
764.0
2-Point Field Goals Attempted
772.0
1739
Points
1708
207
Offensive Rebounds
171
424
Assists
413
209
Turnovers
195
619
Field Goals Made
630
1404
Field Goals Attempted
1329
264
Free Throws Made
244
327
Free Throws Attempted
322
237
3-Point Field Goals Made
204
640
3-Point Field Goals Attempted
557
37.0
3-Point Field Goal Percentage
36.6
23.9
2-Point Field Goals Made per Game
28.4
47.8
2-Point Field Goals Attempted per Game
51.5
Defensive
33.8
Defensive Rebounds Per Game
29.4
4.5
Blocks Per Game
3.9
7.1
Steals Per Game
7.8
540
Defensive Rebounds
441
114
Steals
117
72
Blocks
59