

Lakers vs Celtics Live Score (3 Feb, 2027)
Game Information
League
NBA
Season
1
Date
February 2, 2027
Tipoff
8:00 PM EST
Status
Scheduled
Team Stats
 LAL
Game Comparison
BOS
-Points-
-Rebounds-
-Assists-
52Field Goal %46
-3-Point %-
-Free Throw %-
Game Leaders
LALBOS
 —#
Points
—
—#
—#
Rebounds
—
—#
—#
Assists
—
—#
Injury Report
Los Angeles Lakers
H2H / Season Series
Last 5 Games





NBA Standings
Western Conference — Pacific
| Team | W | L | PCT | GB | STRK |
|---|---|---|---|---|---|
| LA Lakers | 6 | 2 | .750 | - | W2 |
 Golden State | 5 | 3 | .625 | 1 | W5 |
 Phoenix | 1 | 4 | .200 | 3.5 | L3 |
 LA Clippers | 1 | 6 | .143 | 4.5 | L6 |
 Sacramento | 1 | 6 | .143 | 4.5 | W1 |
Eastern Conference — Atlantic
| Team | W | L | PCT | GB | STRK |
|---|---|---|---|---|---|
 Philadelphia | 7 | 1 | .875 | - | W4 |
| Boston | 5 | 2 | .714 | 1.5 | L1 |
 Toronto | 4 | 3 | .571 | 2.5 | W1 |
 New York | 3 | 4 | .429 | 3.5 | W1 |
 Brooklyn | 1 | 6 | .143 | 5.5 | L1 |
Rosters
Lakers
1st in Pacific Division
VS
Celtics
2nd in Atlantic Division
Guard
#77

Luka Doncic
#15

Austin Reaves
#10
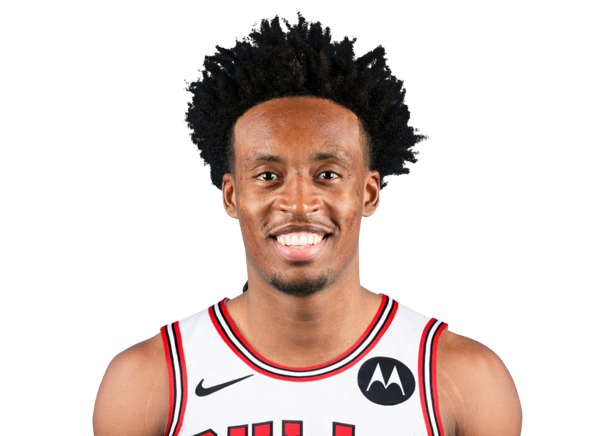
Collin Sexton
#5

Quentin Grimes
#4
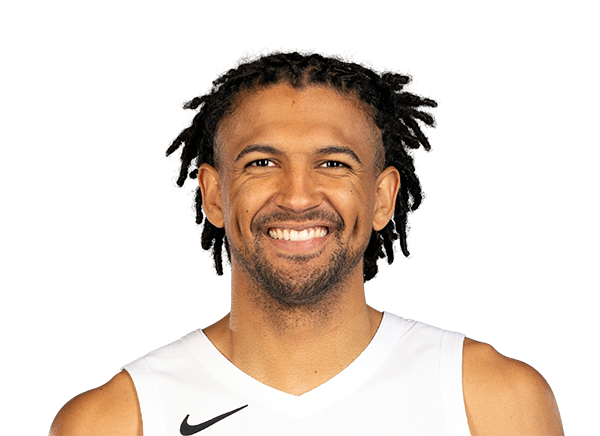
Matisse Thybulle
#7

Jaden Hardy
#9

Bronny James
#30
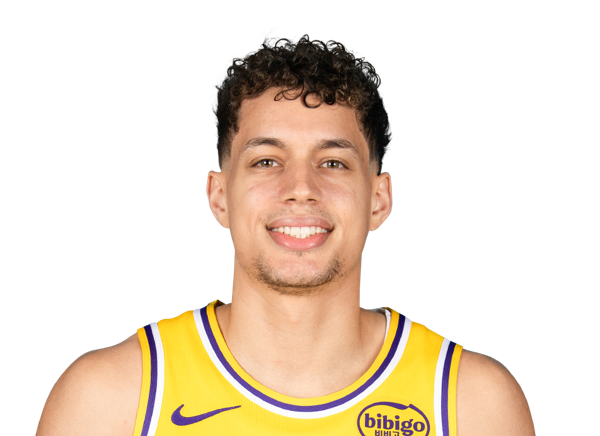
Chris Manon
#43
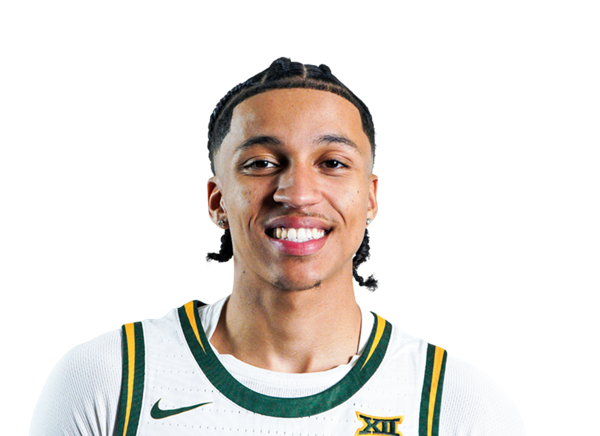
Cameron Carr
Center
#14
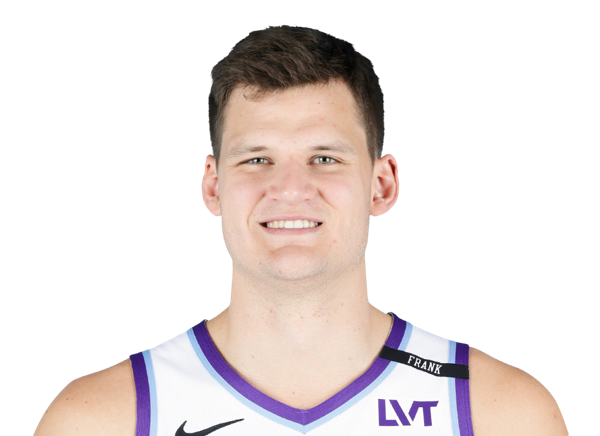
Walker Kessler

Lawson Lovering
Forward
#11
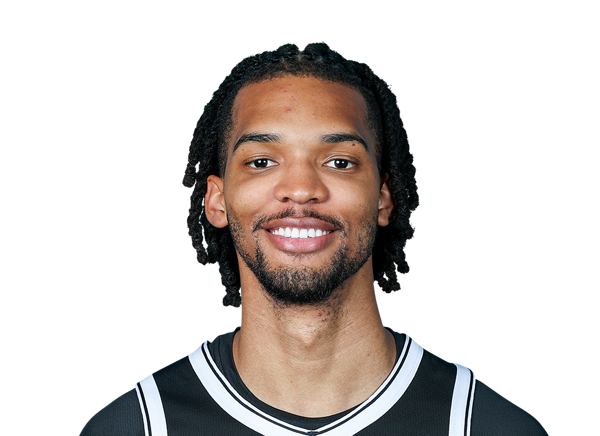
Ziaire Williams
#54

Sandro Mamukelashvili
#12

Jake LaRavia
#2

Jarred Vanderbilt
#1

Adou Thiero
#55
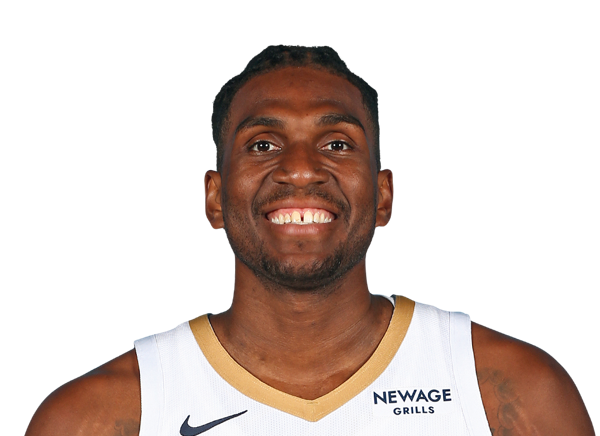
Kevon Looney
Forward

Jayson Tatum
#13
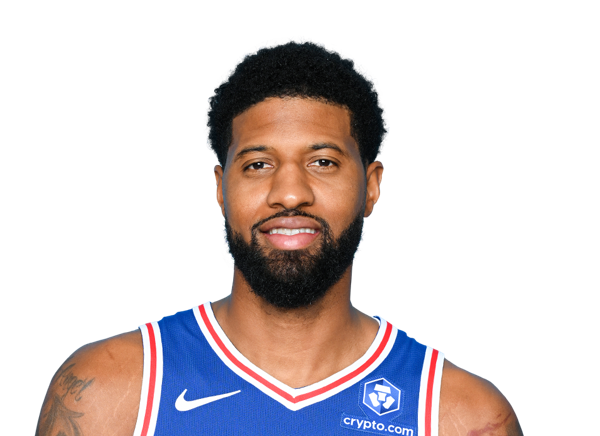
Paul George
#30

Sam Hauser
#12
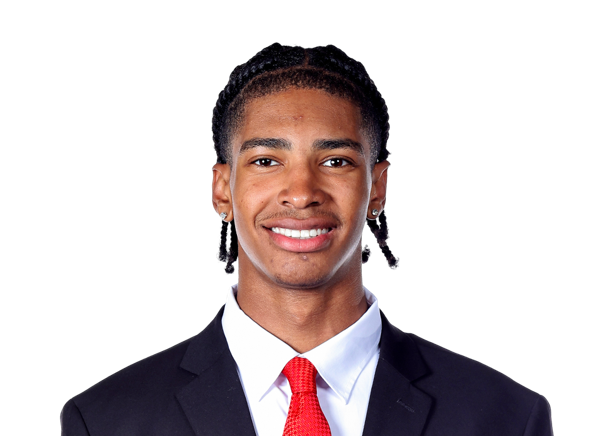
Chris Cenac Jr.
#20
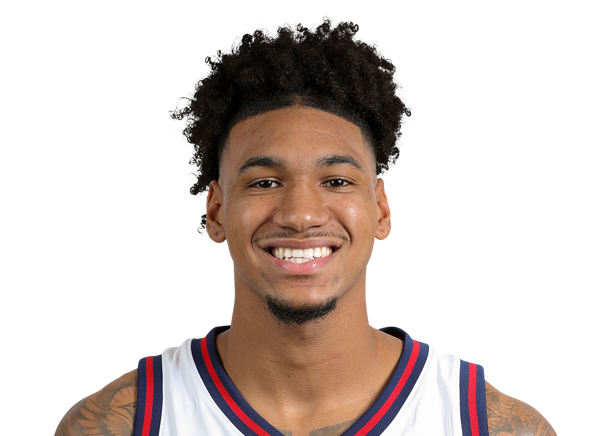
Dillon Mitchell
Guard
#11
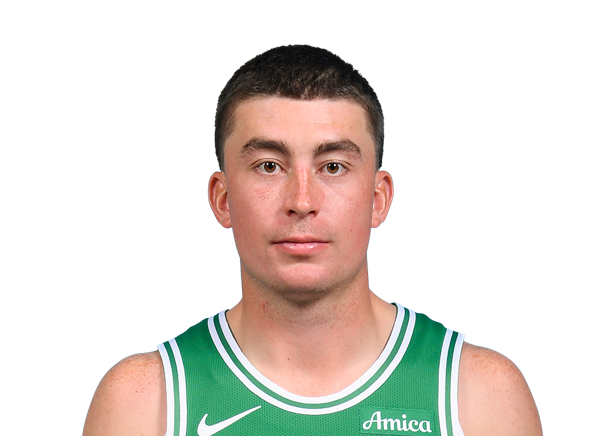
Payton Pritchard
#9
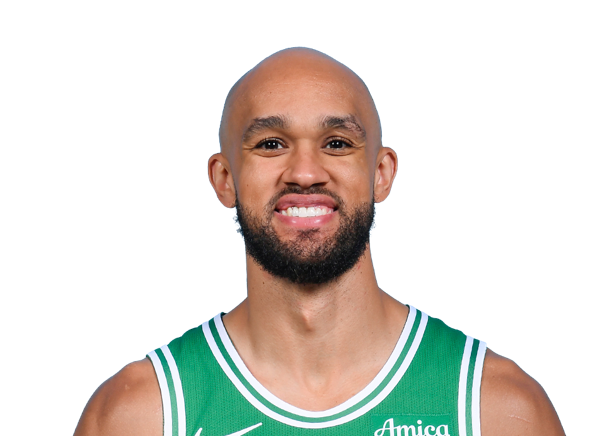
Derrick White
#55
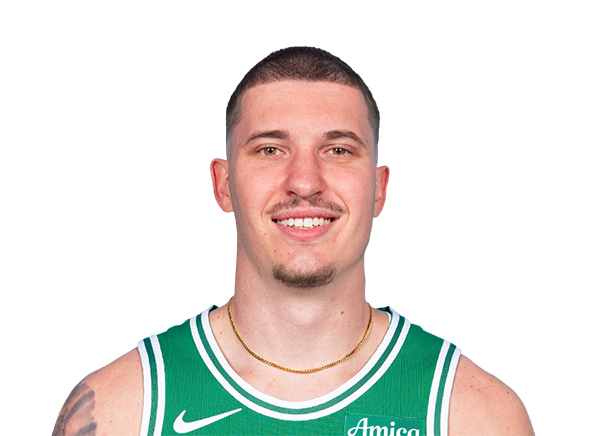
Baylor Scheierman
#27

Jordan Walsh
#28
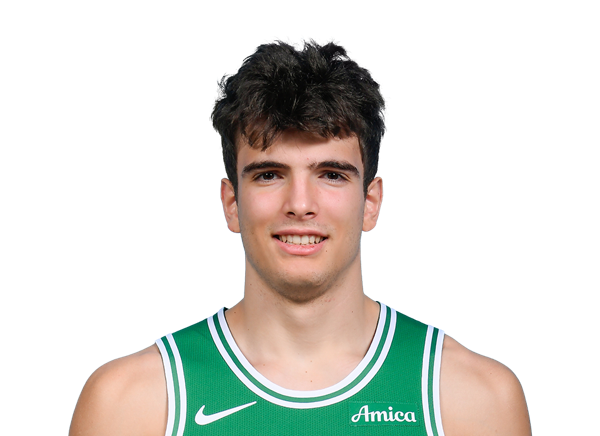
Hugo Gonzalez
#45
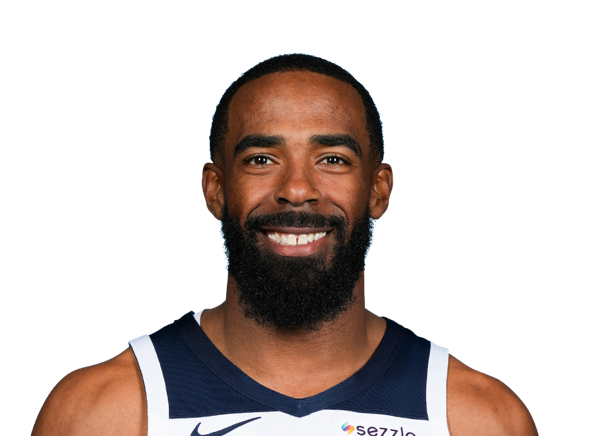
Mike Conley
#8

Ron Harper Jr.
#99
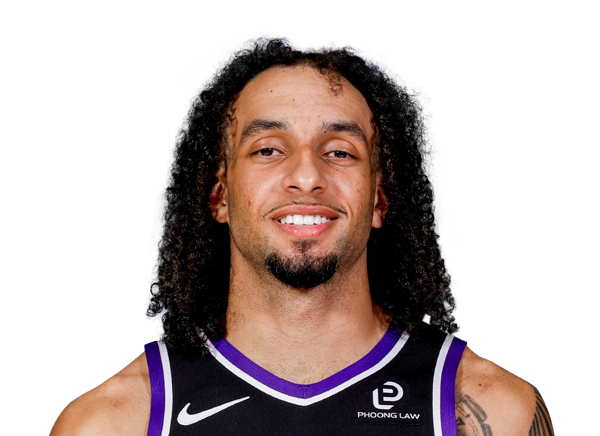
Devin Carter
Center
#88
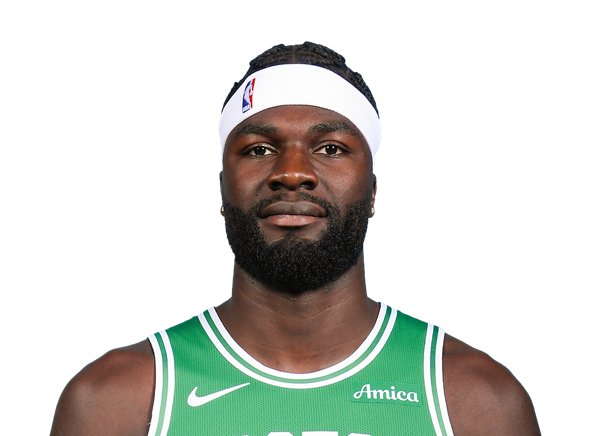
Neemias Queta
#52
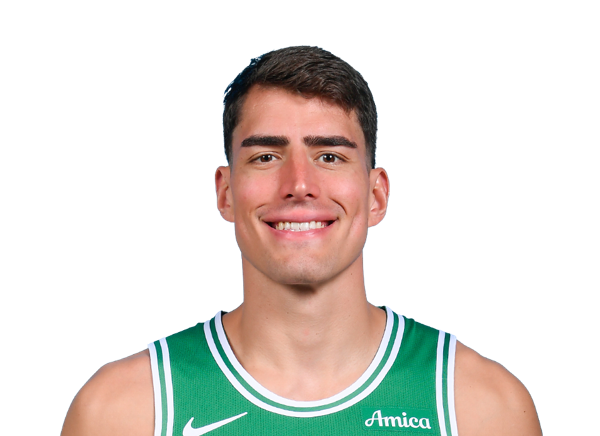
Luka Garza
#4

Mitchell Robinson
Team Statistics
Lakers
1st in Pacific Division
VS
Celtics
2nd in Atlantic Division
General
40.8
Rebounds Per Game
45.3
1.5
Assist To Turnover Ratio
2.0
23.4
Fouls Per Game
21.1
14
Games Played
13
0
Games Started
0
0
Minutes
0
0.0
Minutes Per Game
0.0
571
Rebounds
589
571
Rebounds
589
Offensive
80.4
Free Throw Percentage
78.7
38.3
3-Point Field Goal Percentage
38.5
42.1
Average Field Goals Made
40.4
83.8
Average Field Goals Attempted
87.8
14.2
Average 3-Point Field Goals Made
16.5
37.1
Average 3-Point Field Goals Attempted
43.0
24.3
Average Free Throws Made
18.2
30.2
Average Free Throws Attempted
23.2
122.8
Points Per Game
115.5
11.4
Offensive Rebounds Per Game
13.5
24.7
Assists Per Game
27.4
16.0
Turnovers Per Game
13.9
59.8
2-Point Field Goal Percentage
53.3
1.465
Scoring Efficiency
1.316
0.59
Shooting Efficiency
0.55
50.3
Field Goal Percentage
46.0
391.0
2-Point Field Goals Made
310.0
654.0
2-Point Field Goals Attempted
582.0
1719
Points
1502
159
Offensive Rebounds
175
346
Assists
356
224
Turnovers
181
590
Field Goals Made
525
1173
Field Goals Attempted
1141
340
Free Throws Made
237
423
Free Throws Attempted
301
199
3-Point Field Goals Made
215
519
3-Point Field Goals Attempted
559
38.3
3-Point Field Goal Percentage
38.5
27.9
2-Point Field Goals Made per Game
23.8
46.7
2-Point Field Goals Attempted per Game
44.8
Defensive
29.4
Defensive Rebounds Per Game
31.8
6.4
Blocks Per Game
4.9
11.0
Steals Per Game
8.4
412
Defensive Rebounds
414
154
Steals
109
89
Blocks
64