

Lakers vs Kings Live Score (5 Nov, 2026)
Game Information
League
NBA
Season
2027
Date
November 4, 2026
Tipoff
10:00 PM EST
Status
Scheduled
LAL Record
6-2
SAC Record
1-6
Venue
Golden 1 Center
Location
Sacramento, CA
Arena Type
Indoor
Broadcast
Spectrum Sports Net
Team Stats
 LAL
Game Comparison
SAC

-Points-
-Rebounds-
-Assists-
52Field Goal %46
-3-Point %-
-Free Throw %-
Game Leaders
LALSAC
 —#
Points
—
—#
—#Rebounds
—
—#
—#Assists
—
—#
Injury Report
Los Angeles Lakers
H2H / Season Series
Last 5 Games







NBA Standings
Western Conference — Pacific
| Team | W | L | PCT | GB | STRK |
|---|---|---|---|---|---|
| LA Lakers | 6 | 2 | .750 | - | W2 |
 Golden State | 5 | 3 | .625 | 1 | W5 |
 Phoenix | 1 | 4 | .200 | 3.5 | L3 |
 LA Clippers | 1 | 6 | .143 | 4.5 | L6 |
| Sacramento | 1 | 6 | .143 | 4.5 | W1 |
Rosters
Lakers
1st in Pacific Division
VS
Kings
4th in Pacific Division
Guard
#77

Luka Doncic
#15

Austin Reaves
#10
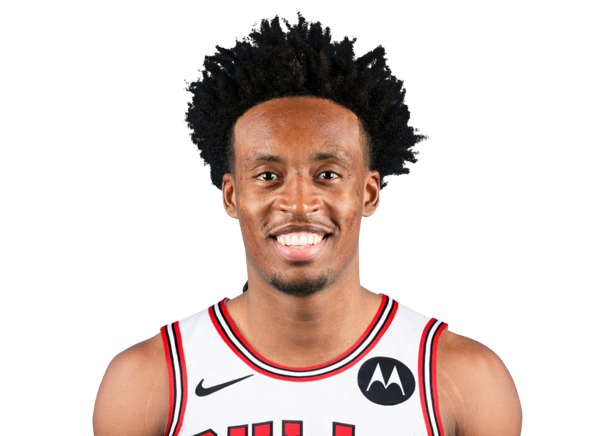
Collin Sexton
#4
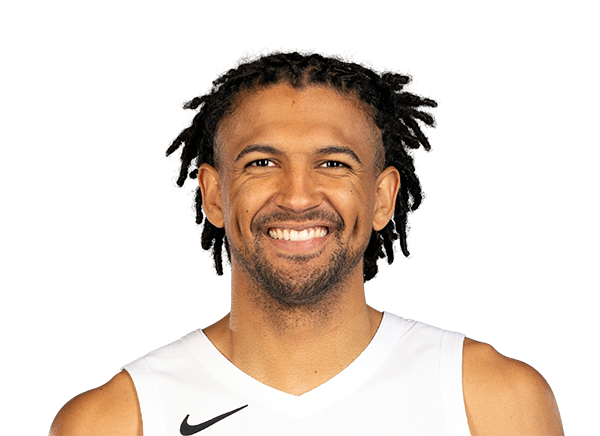
Matisse Thybulle
#5

Quentin Grimes
#7

Jaden Hardy
#9

Bronny James
#30
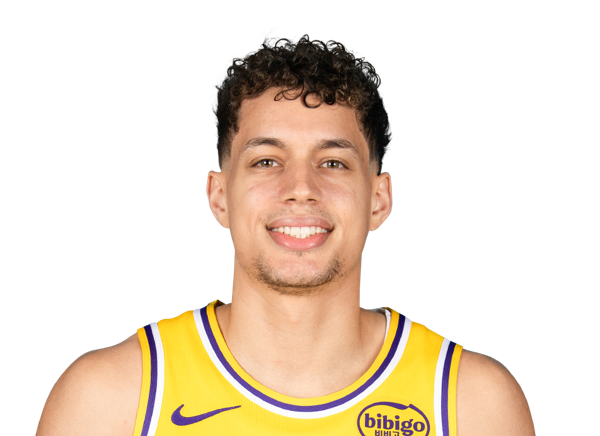
Chris Manon
#43
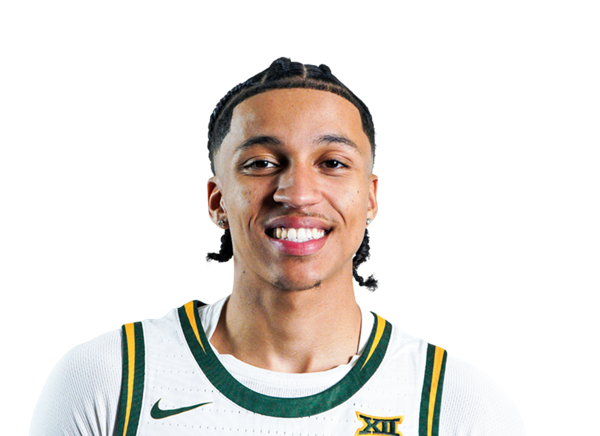
Cameron Carr
Center
#14
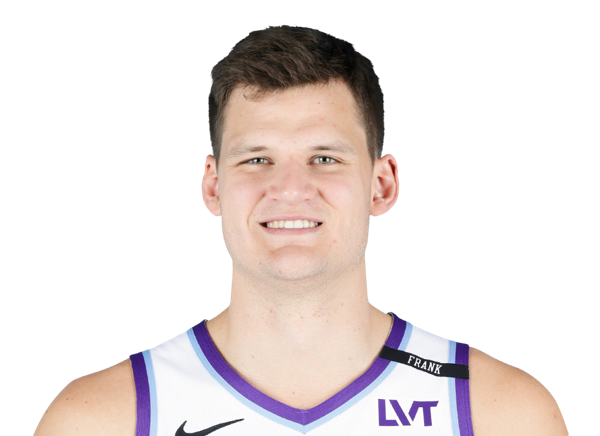
Walker Kessler

Lawson Lovering
Forward
#11

Ziaire Williams
#54

Sandro Mamukelashvili
#12

Jake LaRavia
#55
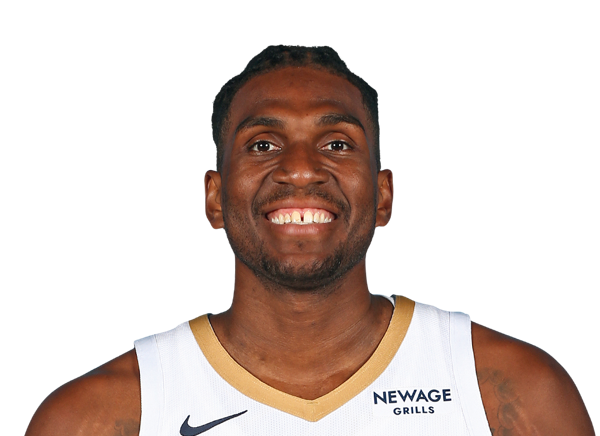
Kevon Looney
#2

Jarred Vanderbilt
#1

Adou Thiero
Guard
#5
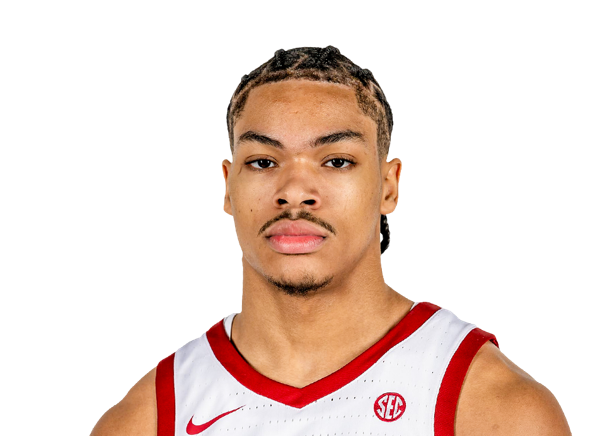
Darius Acuff Jr.
#8

Zach LaVine

Malik Monk
#34

Emanuel Sharp
#29

Daeqwon Plowden
#10
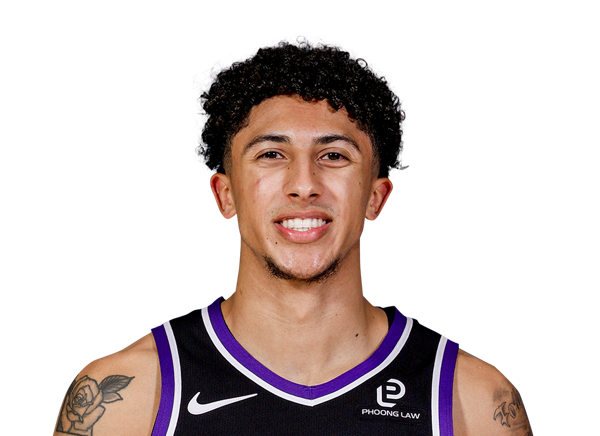
Nique Clifford
#25
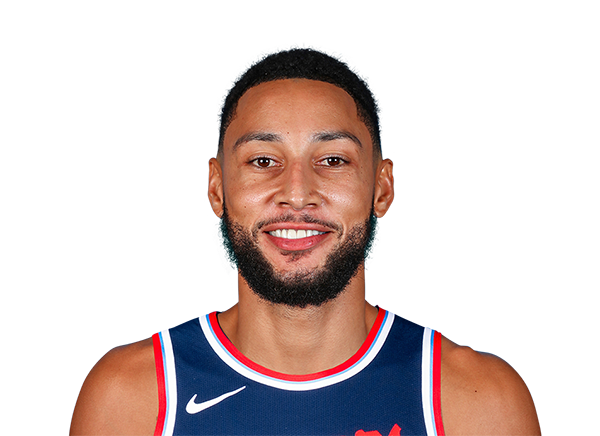
Ben Simmons
Forward
#11

Domantas Sabonis
#15

De'Andre Hunter
#9
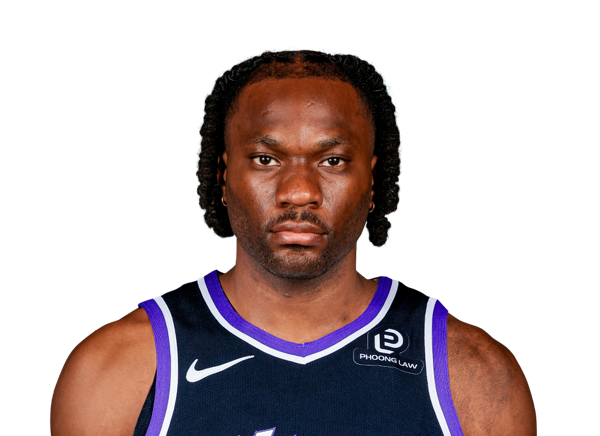
Precious Achiuwa
#13
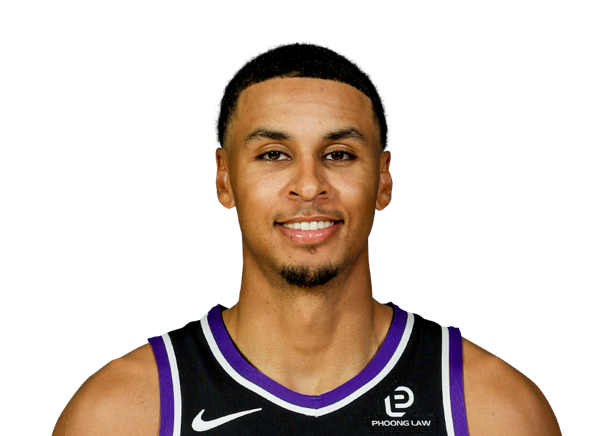
Keegan Murray
#19
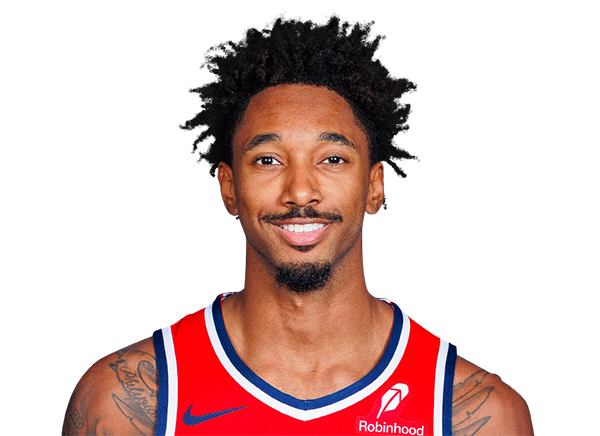
Leaky Black
#22

Jonathan Mogbo
#33
Alex Karaban
Center
#42

Maxime Raynaud
Team Statistics
Lakers
1st in Pacific Division
VS
Kings
4th in Pacific Division
General
40.1
Rebounds Per Game
40.1
1.4
Assist To Turnover Ratio
1.5
23.9
Fouls Per Game
23.4
8
Games Played
7
0
Games Started
0
0
Minutes
0
0.0
Minutes Per Game
0.0
321
Rebounds
281
321
Rebounds
281
Offensive
78.5
Free Throw Percentage
75.2
39.7
3-Point Field Goal Percentage
32.7
42.4
Average Field Goals Made
40.9
81.5
Average Field Goals Attempted
88.6
14.9
Average 3-Point Field Goals Made
11.6
37.5
Average 3-Point Field Goals Attempted
35.4
22.9
Average Free Throws Made
16.9
29.1
Average Free Throws Attempted
22.4
122.5
Points Per Game
110.1
10.1
Offensive Rebounds Per Game
10.6
25.4
Assists Per Game
24.6
17.6
Turnovers Per Game
16.0
62.5
2-Point Field Goal Percentage
55.1
1.503
Scoring Efficiency
1.244
0.61
Shooting Efficiency
0.53
52.0
Field Goal Percentage
46.1
220.0
2-Point Field Goals Made
205.0
352.0
2-Point Field Goals Attempted
372.0
980
Points
771
81
Offensive Rebounds
74
203
Assists
172
141
Turnovers
112
339
Field Goals Made
286
652
Field Goals Attempted
620
183
Free Throws Made
118
233
Free Throws Attempted
157
119
3-Point Field Goals Made
81
300
3-Point Field Goals Attempted
248
39.7
3-Point Field Goal Percentage
32.7
27.5
2-Point Field Goals Made per Game
29.3
44.0
2-Point Field Goals Attempted per Game
53.1
Defensive
30.0
Defensive Rebounds Per Game
29.6
6.4
Blocks Per Game
2.7
10.1
Steals Per Game
8.0
240
Defensive Rebounds
207
81
Steals
56
51
Blocks
19