

Nets vs 76ers Live Score (9 Feb, 2027)
Game Information
League
NBA
Season
1
Date
February 8, 2027
Tipoff
7:00 PM EST
Status
Scheduled
Team Stats
 BKN
Game Comparison
PHI
-Points-
-Rebounds-
-Assists-
43Field Goal %45
-3-Point %-
-Free Throw %-
Game Leaders
BKNPHI
 —#
Points
—
—#
—#
Rebounds
—
—#
—#
Assists
—
—#
Injury Report

H2H / Season Series
Last 5 Games







NBA Standings
Eastern Conference — Atlantic
| Team | W | L | PCT | GB | STRK |
|---|---|---|---|---|---|
| Philadelphia | 9 | 2 | .818 | - | W1 |
 Boston | 8 | 2 | .800 | 0.5 | W3 |
 New York | 5 | 4 | .556 | 3 | W3 |
 Toronto | 5 | 5 | .500 | 3.5 | L1 |
| Brooklyn | 2 | 8 | .200 | 6.5 | L2 |
Rosters
Nets
5th in Atlantic Division
VS
76ers
1st in Atlantic Division
Forward
#17
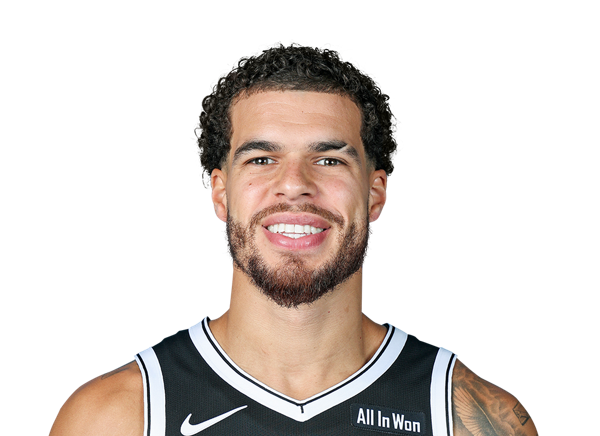
Michael Porter Jr.
#30

Julius Randle
#21
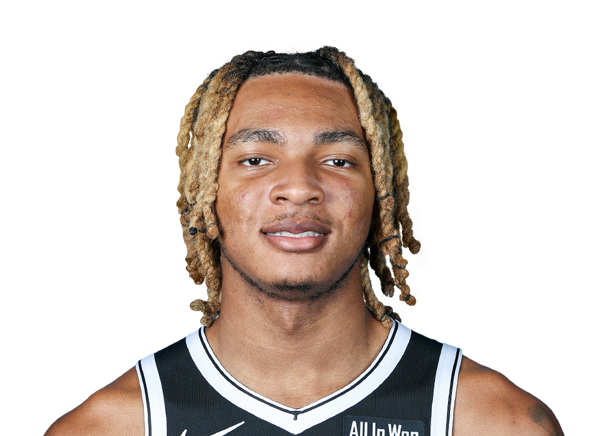
Noah Clowney
#31

Chaney Johnson
#00

Josh Minott
#2

Danny Wolf
#9

Joshua Jefferson
Guard
#10

Nolan Traore
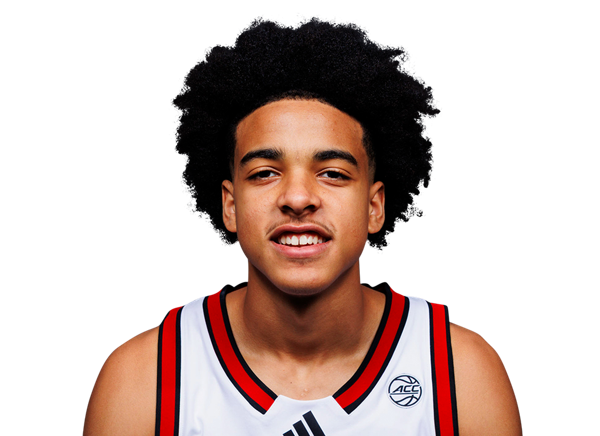
Mikel Brown Jr.
#1

Keon Ellis
#8

Egor Demin
#4

Drake Powell
#77

Ben Saraf
#14

Terance Mann
Center
#13

Moritz Wagner
#20

Day'Ron Sharpe
Guard

Tyrese Maxey
#7

Jaylen Brown
#77

VJ Edgecombe
#5
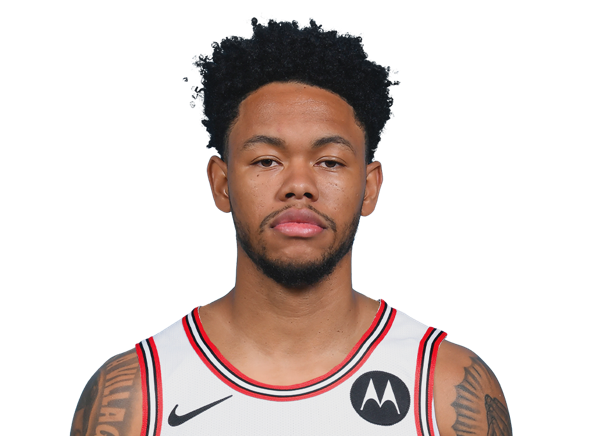
Anfernee Simons
#1

Kentavious Caldwell-Pope
#00

Labaron Philon Jr.
#12

Rayan Rupert
#8

Caleb Love
Center
#21

Joel Embiid
#30

Adem Bona
#99

Tacko Fall
#55

Ariel Hukporti
Forward
#23
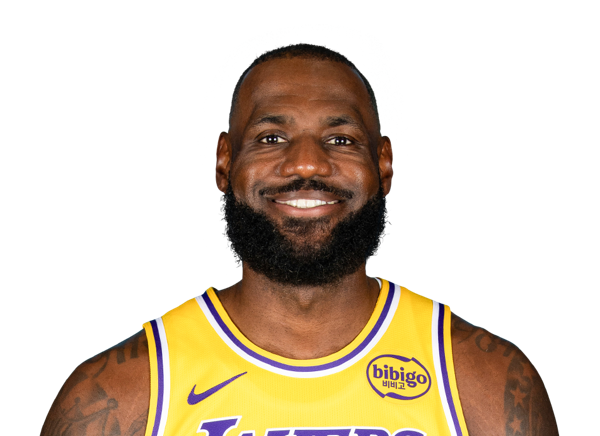
LeBron James
#33

Jabari Walker
#45

Dean Wade
#11

Justin Edwards
#25

Dominick Barlow
Team Statistics
Nets
5th in Atlantic Division
VS
76ers
1st in Atlantic Division
General
42.6
Rebounds Per Game
42.9
1.5
Assist To Turnover Ratio
2.2
26.1
Fouls Per Game
20.9
12
Games Played
14
0
Games Started
0
0
Minutes
0
0.0
Minutes Per Game
0.0
511
Rebounds
600
511
Rebounds
600
Offensive
75.8
Free Throw Percentage
78.2
35.9
3-Point Field Goal Percentage
35.1
37.1
Average Field Goals Made
40.1
83.9
Average Field Goals Attempted
87.9
14.6
Average 3-Point Field Goals Made
12.1
40.7
Average 3-Point Field Goals Attempted
34.4
21.4
Average Free Throws Made
20.2
28.3
Average Free Throws Attempted
25.9
110.2
Points Per Game
112.6
11.6
Offensive Rebounds Per Game
10.0
24.2
Assists Per Game
26.3
16.6
Turnovers Per Game
12.1
52.0
2-Point Field Goal Percentage
52.5
1.313
Scoring Efficiency
1.281
0.53
Shooting Efficiency
0.53
44.2
Field Goal Percentage
45.7
270.0
2-Point Field Goals Made
393.0
519.0
2-Point Field Goals Attempted
748.0
1322
Points
1576
139
Offensive Rebounds
140
290
Assists
368
199
Turnovers
170
445
Field Goals Made
562
1007
Field Goals Attempted
1230
257
Free Throws Made
283
339
Free Throws Attempted
362
175
3-Point Field Goals Made
169
488
3-Point Field Goals Attempted
482
35.9
3-Point Field Goal Percentage
35.1
22.5
2-Point Field Goals Made per Game
28.1
43.3
2-Point Field Goals Attempted per Game
53.4
Defensive
31.0
Defensive Rebounds Per Game
32.9
4.8
Blocks Per Game
4.2
8.6
Steals Per Game
8.1
372
Defensive Rebounds
460
103
Steals
114
57
Blocks
59