

Nets vs Pistons Live Score (15 Dec, 2026)
Game Information
League
NBA
Season
1
Date
December 14, 2026
Tipoff
7:00 PM EST
Status
Scheduled
Team Stats
 BKN
Game Comparison
DET
-Points-
-Rebounds-
-Assists-
45Field Goal %47
-3-Point %-
-Free Throw %-
Game Leaders
BKNDET
 —#
Points
—
—#
—#
Rebounds
—
—#
—#
Assists
—
—#
Injury Report
Brooklyn Nets
Detroit Pistons

H2H / Season Series
Last 5 Games







NBA Standings






Rosters
Nets
5th in Atlantic Division
VS
Pistons
1st in Central Division
Forward
#30
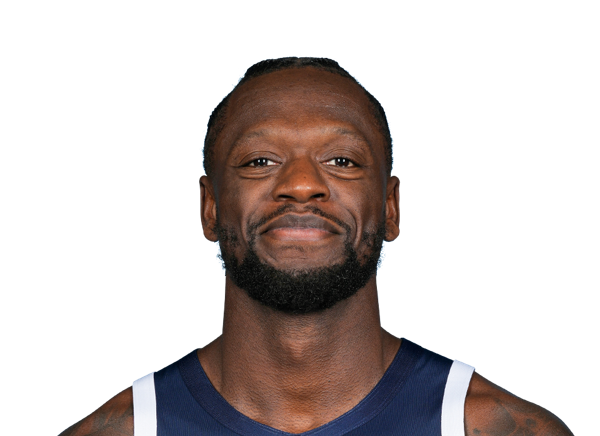
Julius Randle
#17
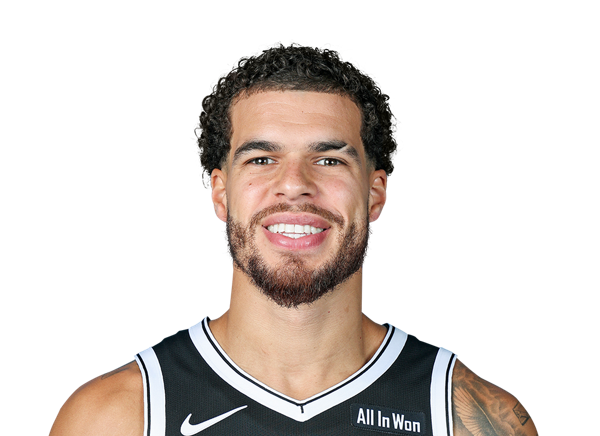
Michael Porter Jr.
#2

Danny Wolf
#21
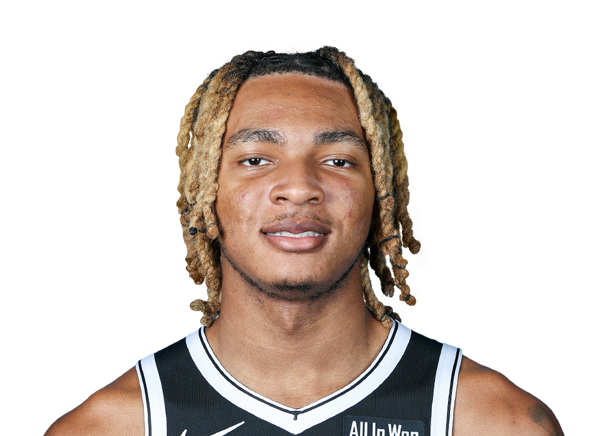
Noah Clowney
#31

Chaney Johnson
#00

Josh Minott
#9

Joshua Jefferson
#16

Grant Nelson
Guard
#10

Nolan Traore
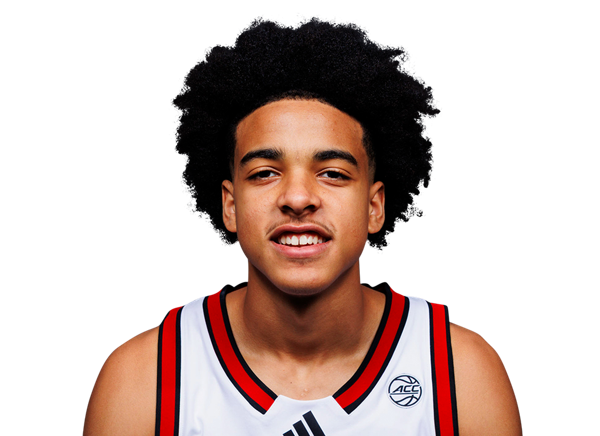
Mikel Brown Jr.
#8

Egor Demin
#1

Keon Ellis
#4

Drake Powell
#77

Ben Saraf
#14

Terance Mann
Center
#13
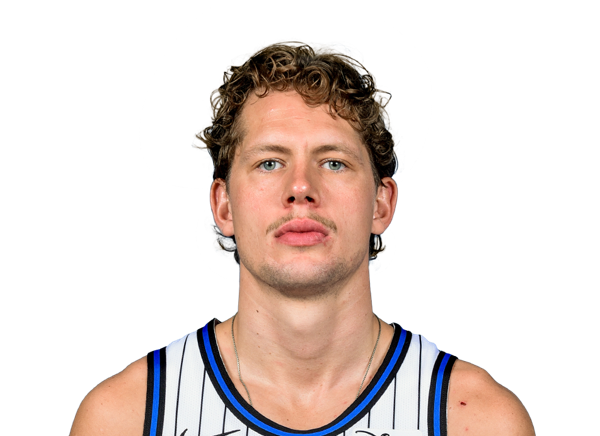
Moritz Wagner
#20
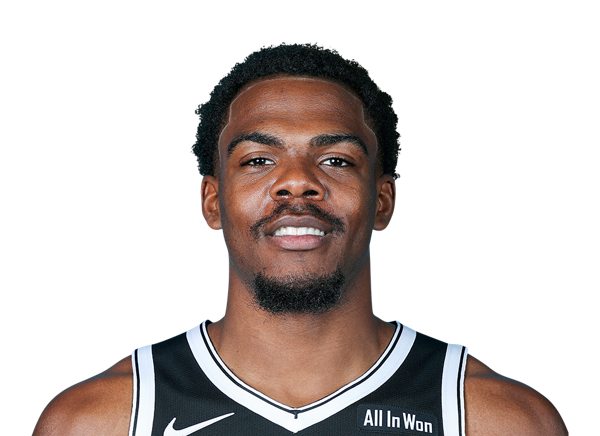
Day'Ron Sharpe
Guard
#2

Cade Cunningham
#24

Daniss Jenkins
#27

Kevin Huerter
#9
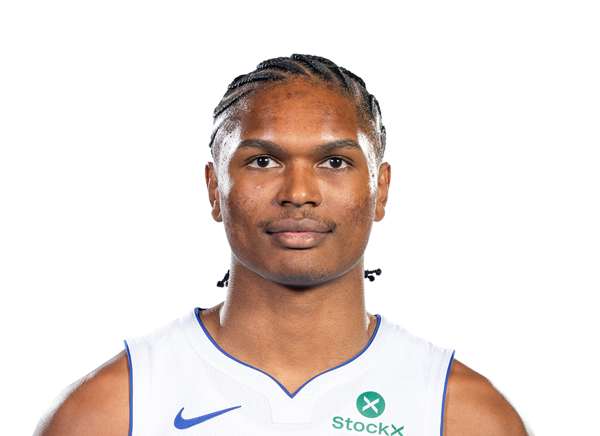
Ausar Thompson
#31

Javonte Green
#17

Isaiah Joe
#8

Chaz Lanier
#23
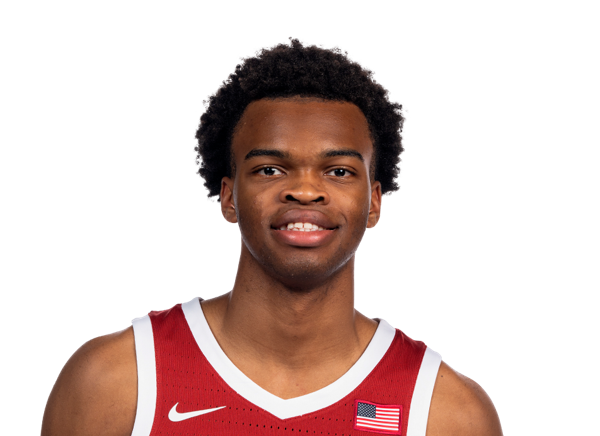
Ebuka Okorie
#94

Elijah Harkless
Forward
#55

Duncan Robinson
#7

Paul Reed
#20
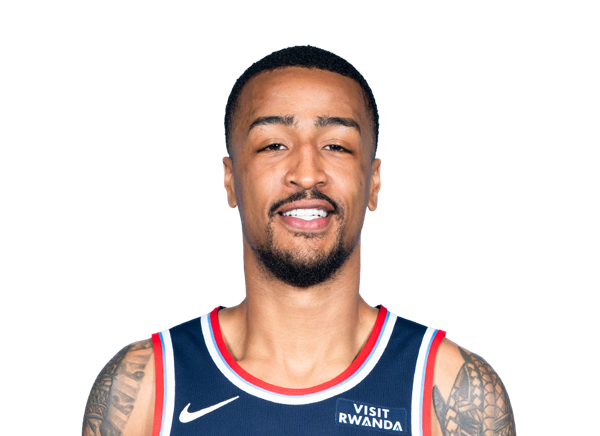
John Collins
#5
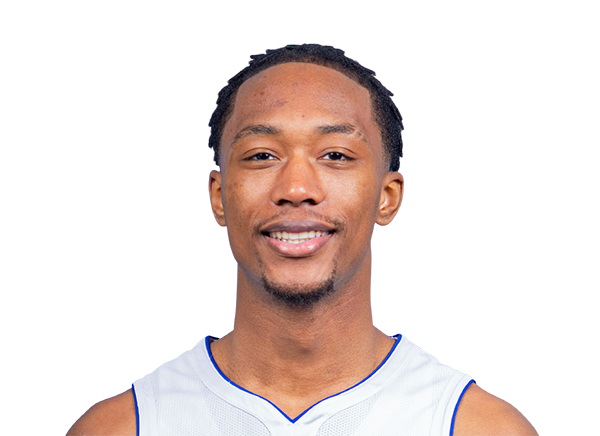
Ronald Holland II
#35

Tolu Smith
#12

Taurean Prince
Center

Jalen Duren
#13

Isaac Jones
Team Statistics
Nets
5th in Atlantic Division
VS
Pistons
1st in Central Division
General
41.3
Rebounds Per Game
43.1
1.5
Assist To Turnover Ratio
2.1
25.5
Fouls Per Game
22.9
15
Games Played
15
0
Games Started
0
0
Minutes
0
0.0
Minutes Per Game
0.0
619
Rebounds
647
619
Rebounds
647
Offensive
75.4
Free Throw Percentage
79.1
36.0
3-Point Field Goal Percentage
37.0
37.7
Average Field Goals Made
40.9
84.1
Average Field Goals Attempted
87.3
14.3
Average 3-Point Field Goals Made
13.1
39.9
Average 3-Point Field Goals Attempted
35.5
21.1
Average Free Throws Made
19.5
27.9
Average Free Throws Attempted
24.6
110.9
Points Per Game
114.5
11.5
Offensive Rebounds Per Game
11.9
24.3
Assists Per Game
27.5
16.5
Turnovers Per Game
13.2
52.9
2-Point Field Goal Percentage
53.6
1.318
Scoring Efficiency
1.311
0.53
Shooting Efficiency
0.54
44.8
Field Goal Percentage
46.9
351.0
2-Point Field Goals Made
417.0
664.0
2-Point Field Goals Attempted
778.0
1663
Points
1717
172
Offensive Rebounds
178
365
Assists
412
247
Turnovers
198
566
Field Goals Made
614
1262
Field Goals Attempted
1310
316
Free Throws Made
292
419
Free Throws Attempted
369
215
3-Point Field Goals Made
197
598
3-Point Field Goals Attempted
532
36.0
3-Point Field Goal Percentage
37.0
23.4
2-Point Field Goals Made per Game
27.8
44.3
2-Point Field Goals Attempted per Game
51.9
Defensive
29.8
Defensive Rebounds Per Game
31.3
4.7
Blocks Per Game
5.7
8.4
Steals Per Game
9.3
447
Defensive Rebounds
469
126
Steals
139
71
Blocks
86