

Nuggets vs Trail Blazers Live Score (16 Dec, 2026)
Game Information
League
NBA
Season
1
Date
December 15, 2026
Tipoff
11:00 PM EST
Status
Scheduled
Team Stats
 DEN
Game Comparison
POR
-Points-
-Rebounds-
-Assists-
48Field Goal %46
-3-Point %-
-Free Throw %-
Game Leaders
DENPOR
 —#
Points
—
—#
—#
Rebounds
—
—#
—#
Assists
—
—#
Injury Report
Denver Nuggets
Portland Trail Blazers
H2H / Season Series
Last 5 Games







NBA Standings
Western Conference — Northwest
| Team | W | L | PCT | GB | STRK |
|---|---|---|---|---|---|
 Minnesota | 11 | 5 | .688 | - | L1 |
| Portland | 10 | 5 | .667 | 0.5 | W1 |
| Denver | 8 | 5 | .615 | 1.5 | W1 |
 Oklahoma City | 9 | 6 | .600 | 1.5 | L1 |
 Utah | 3 | 13 | .188 | 8 | W2 |
Rosters
Nuggets
6th in Western Conference Division
VS
Trail Blazers
6th in Western Conference Division
Guard
#27
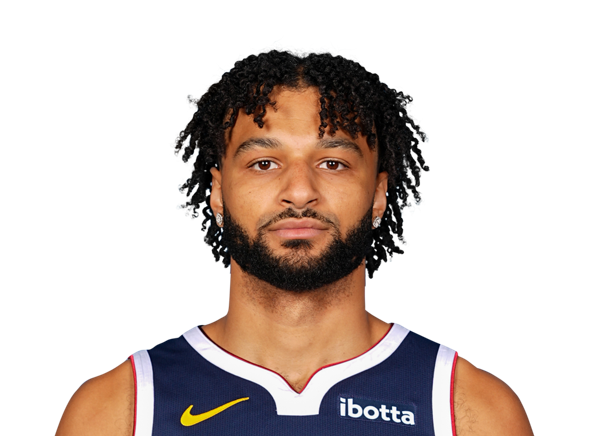
Jamal Murray

Christian Braun
#10
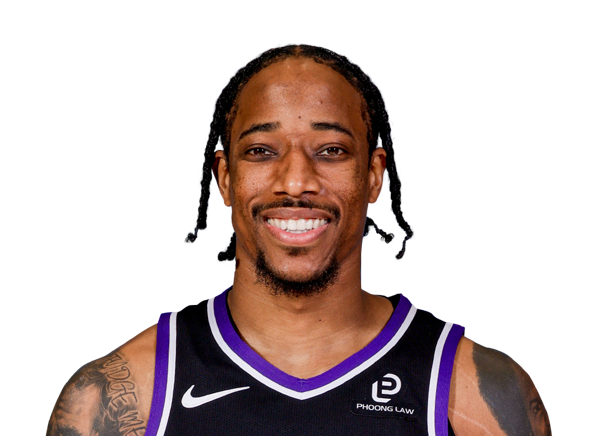
DeMar DeRozan
#5
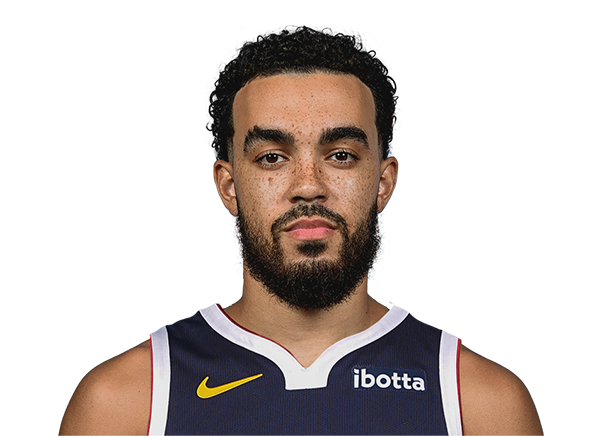
Tyus Jones
#9

Ryan Nembhard
#1
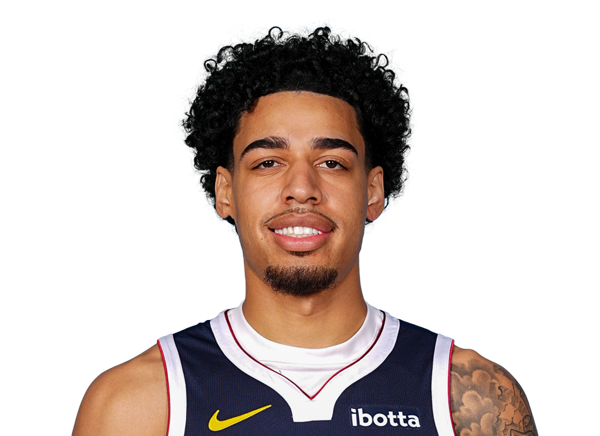
Julian Strawther
Center
#15

Nikola Jokic
Forward
#23
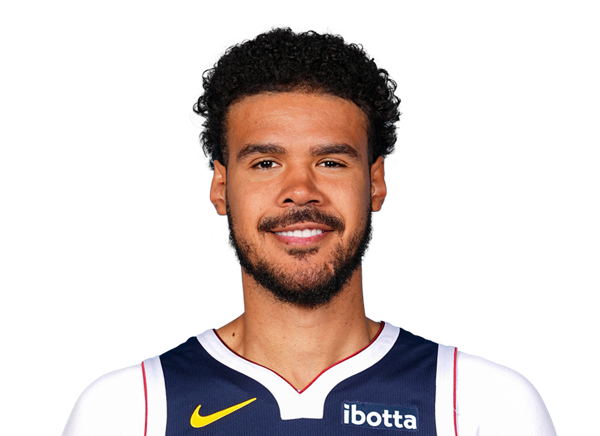
Cameron Johnson
#32

Aaron Gordon
#7
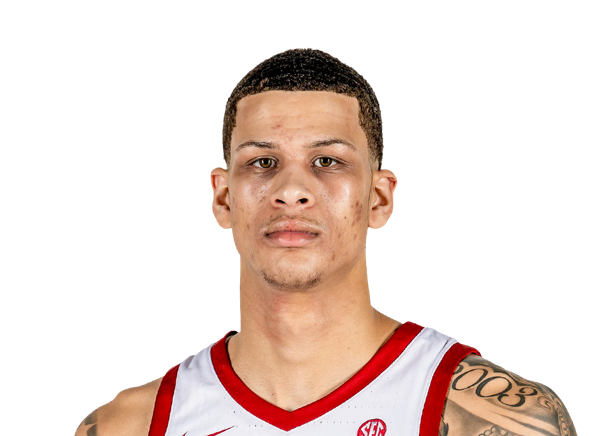
Trevon Brazile
#3

Marvin Bagley III
#13

Bryce Hopkins
#21
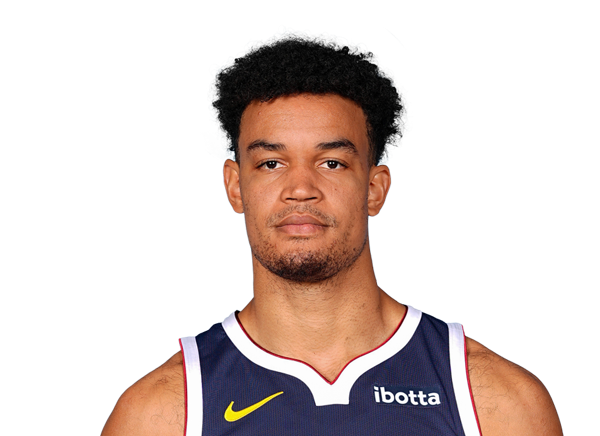
Spencer Jones
#00
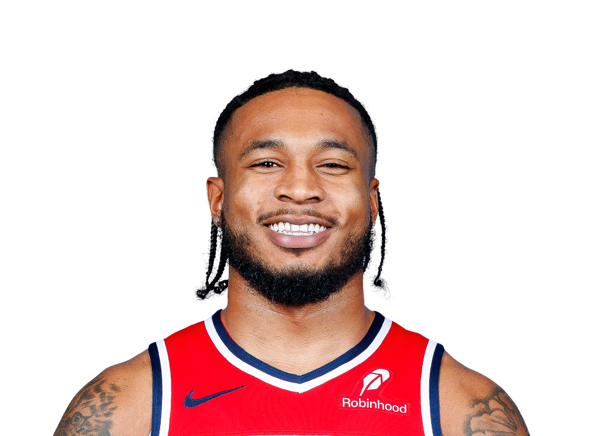
Cam Whitmore
#22

Zeke Nnaji
#11
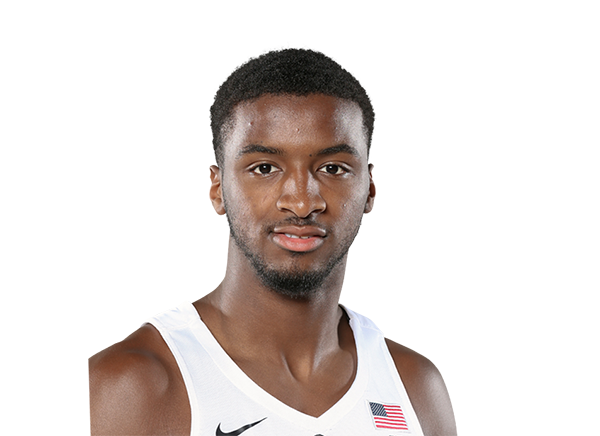
Alpha Diallo
#14

DaRon Holmes II
Forward
#8
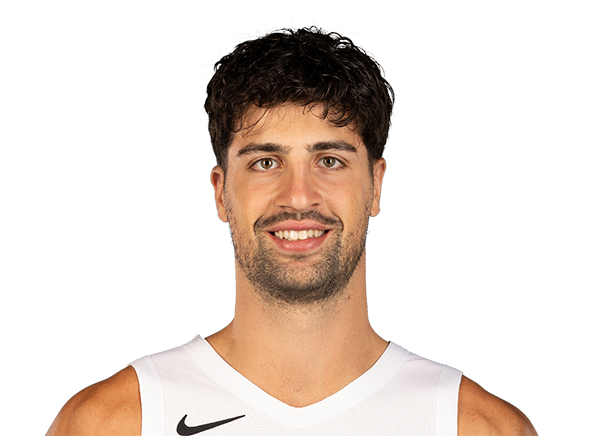
Deni Avdija
#33

Toumani Camara
#2
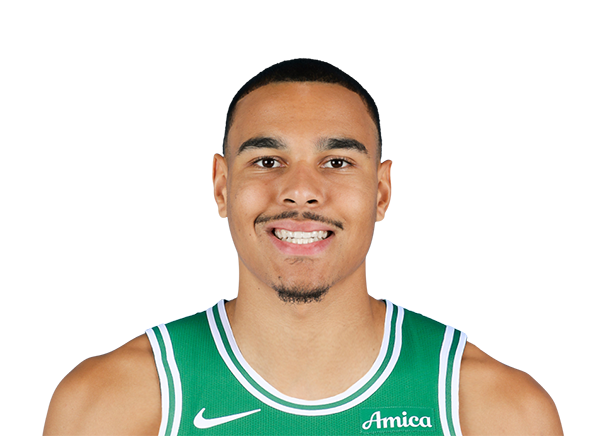
John Tonje
Guard

Damian Lillard
#5

Jrue Holiday
#00

Scoot Henderson
#91

Sidy Cissoko
#1

Ja Morant
#11

Chris Youngblood
#29

Jayson Kent
#27

Vit Krejci
#17

Shaedon Sharpe
Center
#23

Donovan Clingan
#35

Robert Williams III
#10

Branden Carlson
#16

Yang Hansen
#9

Micah Potter
Team Statistics
Nuggets
6th in Western Conference Division
VS
Trail Blazers
6th in Western Conference Division
General
41.6
Rebounds Per Game
44.9
2.1
Assist To Turnover Ratio
1.6
19.3
Fouls Per Game
22.1
14
Games Played
16
0
Games Started
0
0
Minutes
0
0.0
Minutes Per Game
0.0
582
Rebounds
718
582
Rebounds
718
Offensive
80.7
Free Throw Percentage
78.1
34.3
3-Point Field Goal Percentage
35.8
41.4
Average Field Goals Made
39.3
85.1
Average Field Goals Attempted
85.6
10.6
Average 3-Point Field Goals Made
15.4
30.9
Average 3-Point Field Goals Attempted
43.1
21.1
Average Free Throws Made
22.1
26.2
Average Free Throws Attempted
28.3
114.6
Points Per Game
116.1
10.1
Offensive Rebounds Per Game
11.7
27.3
Assists Per Game
24.7
13.0
Turnovers Per Game
15.7
56.9
2-Point Field Goal Percentage
56.2
1.347
Scoring Efficiency
1.357
0.55
Shooting Efficiency
0.55
48.7
Field Goal Percentage
45.9
432.0
2-Point Field Goals Made
382.0
759.0
2-Point Field Goals Attempted
680.0
1604
Points
1858
141
Offensive Rebounds
187
382
Assists
395
182
Turnovers
251
580
Field Goals Made
629
1191
Field Goals Attempted
1369
296
Free Throws Made
353
367
Free Throws Attempted
452
148
3-Point Field Goals Made
247
432
3-Point Field Goals Attempted
689
34.3
3-Point Field Goal Percentage
35.8
30.9
2-Point Field Goals Made per Game
23.9
54.2
2-Point Field Goals Attempted per Game
42.5
Defensive
31.5
Defensive Rebounds Per Game
33.2
4.4
Blocks Per Game
5.4
8.8
Steals Per Game
7.3
441
Defensive Rebounds
531
123
Steals
117
61
Blocks
86