

Pistons vs Thunder Live Score (23 Dec, 2026)
Game Information
League
NBA
Season
1
Date
December 22, 2026
Tipoff
8:00 PM EST
Status
Scheduled
Team Stats
 DET
Game Comparison
OKC
-Points-
-Rebounds-
-Assists-
47Field Goal %46
-3-Point %-
-Free Throw %-
Game Leaders
DETOKC
 —#
Points
—
—#
—#
Rebounds
—
—#
—#
Assists
—
—#
Injury Report
Detroit Pistons

Oklahoma City Thunder
H2H / Season Series
Last 5 Games








NBA Standings







Rosters
Pistons
1st in Central Division
VS
Thunder
6th in Western Conference Division
Guard
#2

Cade Cunningham
#24

Daniss Jenkins
#27

Kevin Huerter
#9
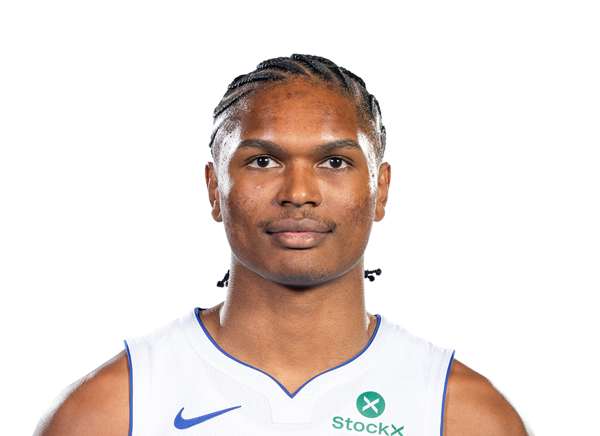
Ausar Thompson
#31

Javonte Green
#17

Isaiah Joe
#8

Chaz Lanier
#23
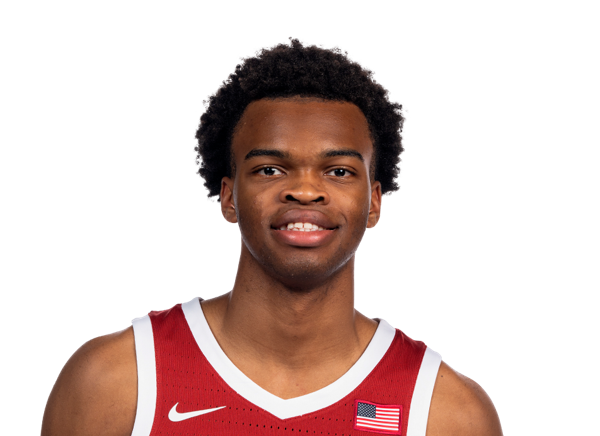
Ebuka Okorie
#94

Elijah Harkless
Forward
#55
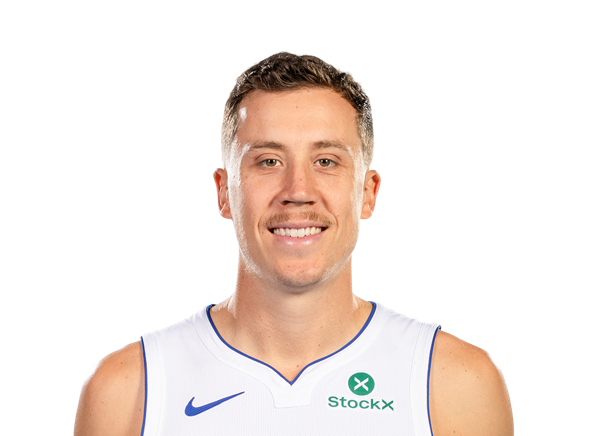
Duncan Robinson
#7

Paul Reed
#20
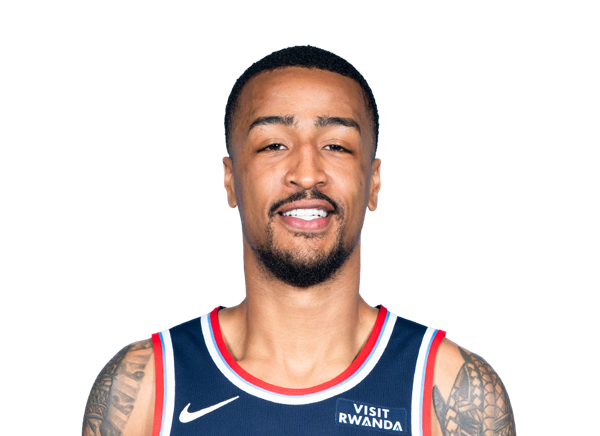
John Collins
#5
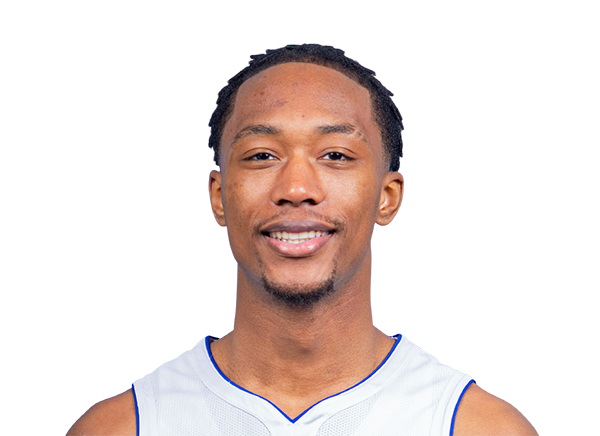
Ronald Holland II
#35

Tolu Smith
#12

Taurean Prince
Center

Jalen Duren
#13

Isaac Jones
Guard
#2

Shai Gilgeous-Alexander
#25

Ajay Mitchell
#3

Jared McCain
#14

Bennett Stirtz
#9

Alex Caruso
#34

Kenrich Williams
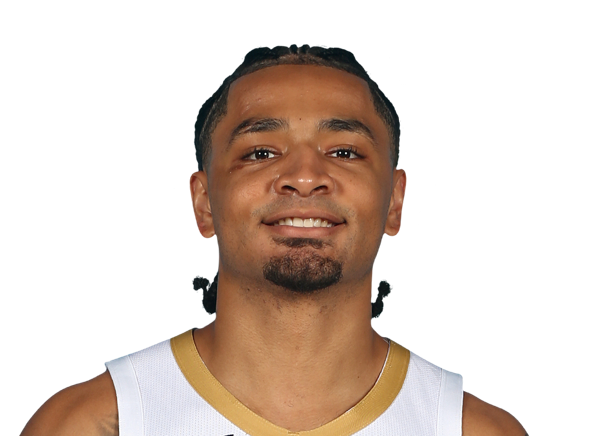
Micah Peavy
#8
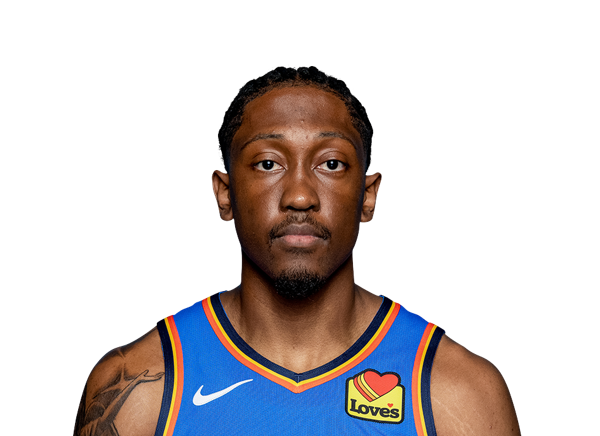
Jalen Williams
#22
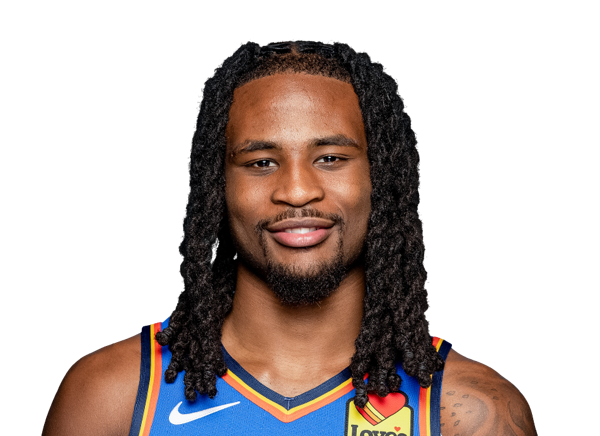
Cason Wallace
#18

Nique Clifford
#44
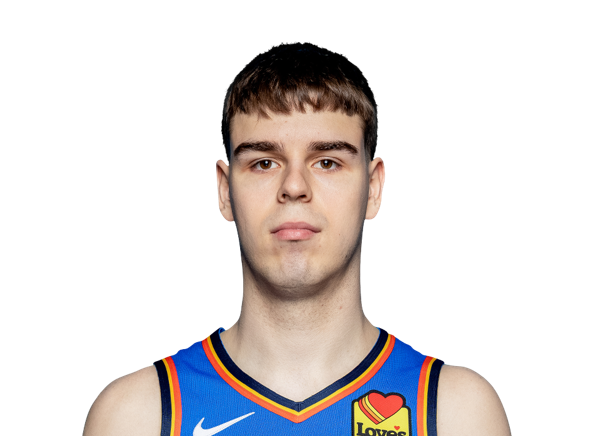
Nikola Topic
#21

Josh Dix

Dalen Terry
Center
#15
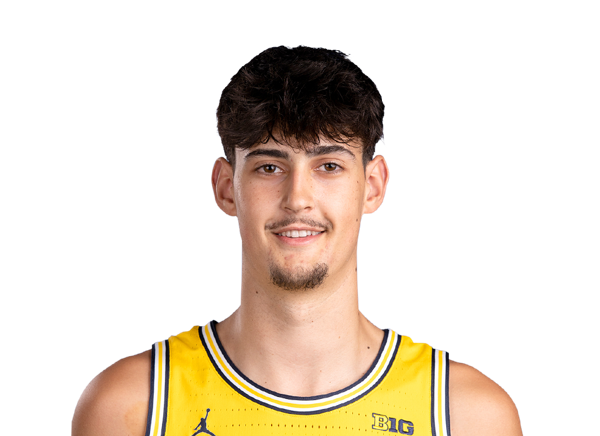
Aday Mara
#55

Isaiah Hartenstein
#7

Chet Holmgren
#12

Thomas Sorber
Forward
#6
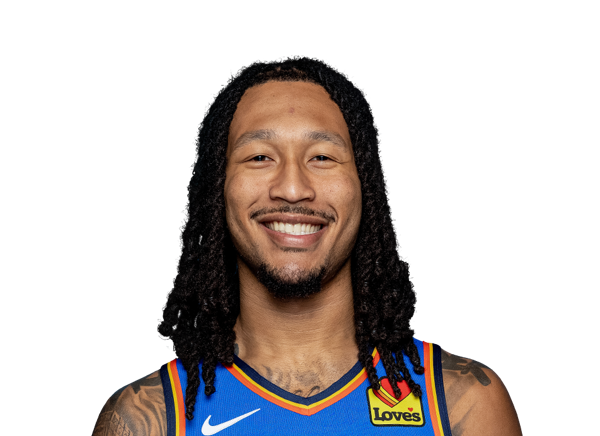
Jaylin Williams
#23

Brooks Barnhizer
Team Statistics
Pistons
1st in Central Division
VS
Thunder
6th in Western Conference Division
General
43.1
Rebounds Per Game
45.8
2.1
Assist To Turnover Ratio
1.9
22.9
Fouls Per Game
19.1
15
Games Played
16
0
Games Started
0
0
Minutes
0
0.0
Minutes Per Game
0.0
647
Rebounds
733
647
Rebounds
733
Offensive
79.1
Free Throw Percentage
79.3
37.0
3-Point Field Goal Percentage
34.5
40.9
Average Field Goals Made
42.3
87.3
Average Field Goals Attempted
90.6
13.1
Average 3-Point Field Goals Made
11.0
35.5
Average 3-Point Field Goals Attempted
31.9
19.5
Average Free Throws Made
17.5
24.6
Average Free Throws Attempted
22.1
114.5
Points Per Game
113.0
11.9
Offensive Rebounds Per Game
11.1
27.5
Assists Per Game
23.4
13.2
Turnovers Per Game
12.1
53.6
2-Point Field Goal Percentage
53.2
1.311
Scoring Efficiency
1.248
0.54
Shooting Efficiency
0.53
46.9
Field Goal Percentage
46.7
417.0
2-Point Field Goals Made
500.0
778.0
2-Point Field Goals Attempted
939.0
1717
Points
1808
178
Offensive Rebounds
178
412
Assists
374
198
Turnovers
194
614
Field Goals Made
676
1310
Field Goals Attempted
1449
292
Free Throws Made
280
369
Free Throws Attempted
353
197
3-Point Field Goals Made
176
532
3-Point Field Goals Attempted
510
37.0
3-Point Field Goal Percentage
34.5
27.8
2-Point Field Goals Made per Game
31.3
51.9
2-Point Field Goals Attempted per Game
58.7
Defensive
31.3
Defensive Rebounds Per Game
34.7
5.7
Blocks Per Game
5.5
9.3
Steals Per Game
8.1
469
Defensive Rebounds
555
139
Steals
130
86
Blocks
88