

Raptors vs Knicks Live Score (5 Feb, 2027)
Game Information
League
NBA
Season
1
Date
February 4, 2027
Tipoff
7:30 PM EST
Status
Scheduled
Team Stats
 TOR
Game Comparison
NY
-Points-
-Rebounds-
-Assists-
46Field Goal %43
-3-Point %-
-Free Throw %-
Game Leaders
TORNY
 —#
Points
—
—#
—#
Rebounds
—
—#
—#
Assists
—
—#
Injury Report
Toronto Raptors
New York Knicks
H2H / Season Series
Last 5 Games






NBA Standings
Eastern Conference — Atlantic
| Team | W | L | PCT | GB | STRK |
|---|---|---|---|---|---|
 Philadelphia | 8 | 1 | .889 | - | W5 |
 Boston | 6 | 2 | .750 | 1.5 | W1 |
| Toronto | 4 | 4 | .500 | 3.5 | L1 |
| New York | 4 | 4 | .500 | 3.5 | W2 |
 Brooklyn | 2 | 6 | .250 | 5.5 | W1 |
Rosters
Raptors
4th in Atlantic Division
VS
Knicks
3rd in Atlantic Division
Forward
#4

Scottie Barnes
#9

RJ Barrett
#30

Collin Murray-Boyles
#77

Jamison Battle
#22

Allen Graves
#32
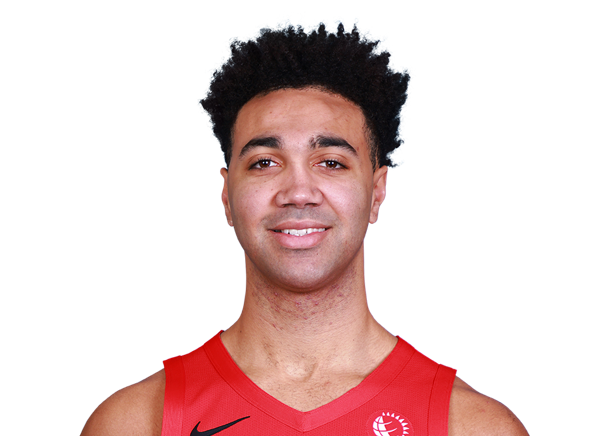
Trayce Jackson-Davis
#12

Kyle Anderson
#2

Kawhi Leonard
Guard
#5

Immanuel Quickley
#14

Ja'Kobe Walter
#23

Jamal Shead
#55

Alijah Martin
#8

Jaden Bradley
#18
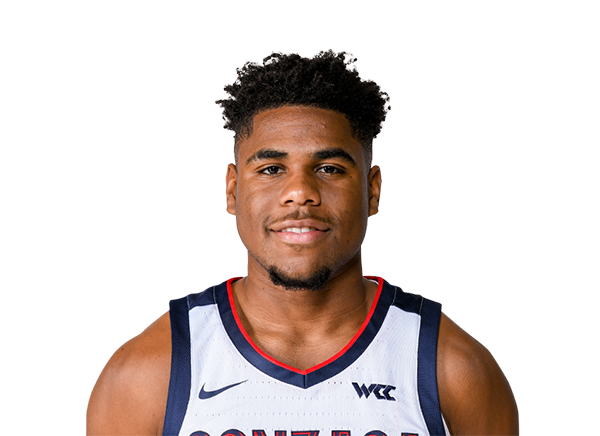
Malachi Smith
#9
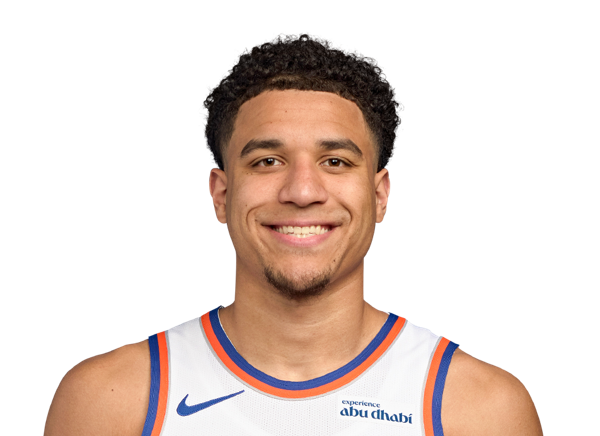
Kevin McCullar Jr.
Center
#19

Jakob Poeltl
#12
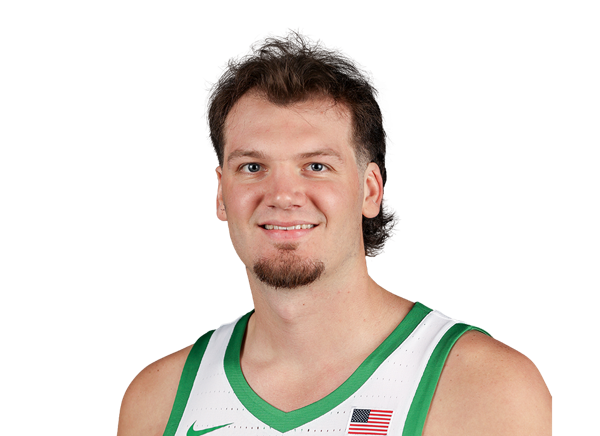
Nate Bittle
Guard
#5

Jose Alvarado
#25

Mikal Bridges
#11

Jalen Brunson
#00

Jordan Clarkson
#3
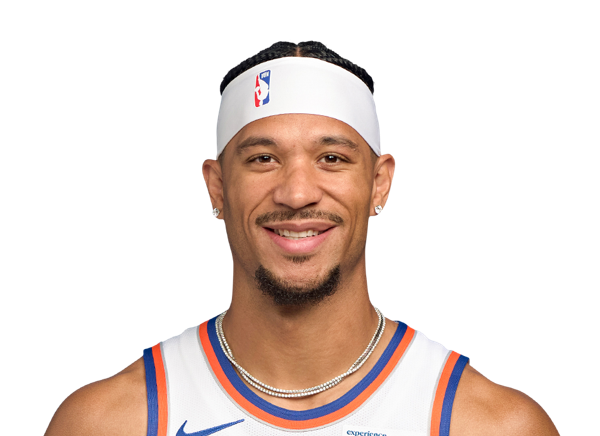
Josh Hart
Jack Kayil
#13

Tyler Kolek
#2

Miles McBride
#9
Kevin McCullar Jr.
#44

Landry Shamet
Forward
#8
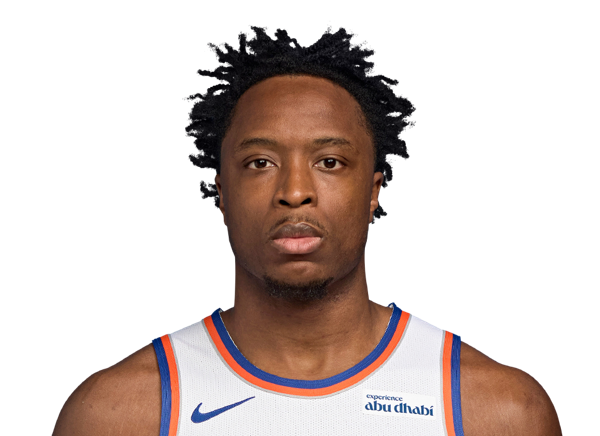
OG Anunoby
#4
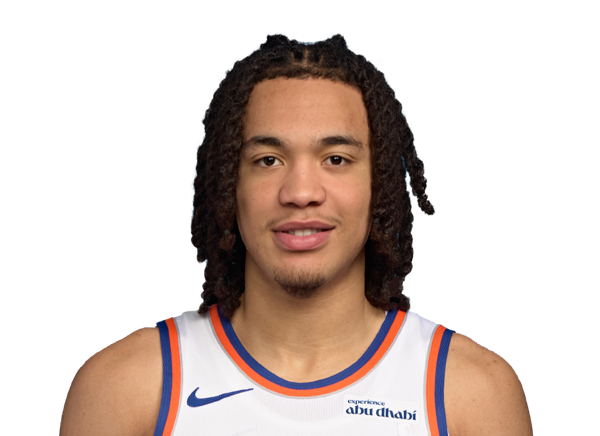
Pacome Dadiet
#51
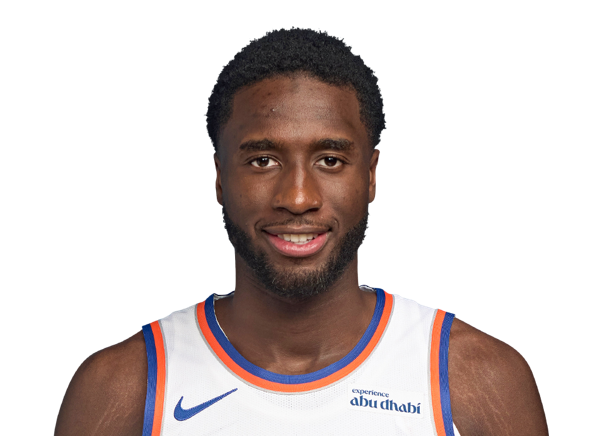
Mohamed Diawara
#50

Trey Jemison III

Tyler Nickel
Center

Andre Drummond
#32
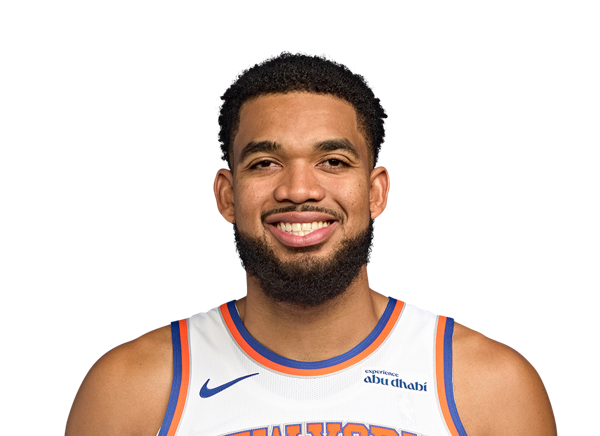
Karl-Anthony Towns
Team Statistics
Raptors
4th in Atlantic Division
VS
Knicks
3rd in Atlantic Division
General
41.9
Rebounds Per Game
47.8
2.0
Assist To Turnover Ratio
2.0
25.6
Fouls Per Game
20.7
13
Games Played
13
0
Games Started
0
0
Minutes
0
0.0
Minutes Per Game
0.0
545
Rebounds
622
545
Rebounds
622
Offensive
72.8
Free Throw Percentage
79.7
32.8
3-Point Field Goal Percentage
36.1
41.5
Average Field Goals Made
38.7
91.7
Average Field Goals Attempted
88.8
11.8
Average 3-Point Field Goals Made
14.7
35.9
Average 3-Point Field Goals Attempted
40.7
18.9
Average Free Throws Made
17.8
26.0
Average Free Throws Attempted
22.4
113.8
Points Per Game
109.9
14.0
Offensive Rebounds Per Game
13.6
28.0
Assists Per Game
26.8
13.8
Turnovers Per Game
13.2
53.4
2-Point Field Goal Percentage
49.9
1.241
Scoring Efficiency
1.238
0.52
Shooting Efficiency
0.52
45.3
Field Goal Percentage
43.6
387.0
2-Point Field Goals Made
312.0
725.0
2-Point Field Goals Attempted
625.0
1479
Points
1429
182
Offensive Rebounds
177
364
Assists
348
180
Turnovers
171
540
Field Goals Made
503
1192
Field Goals Attempted
1154
246
Free Throws Made
232
338
Free Throws Attempted
291
153
3-Point Field Goals Made
191
467
3-Point Field Goals Attempted
529
32.8
3-Point Field Goal Percentage
36.1
29.8
2-Point Field Goals Made per Game
24.0
55.8
2-Point Field Goals Attempted per Game
48.1
Defensive
27.9
Defensive Rebounds Per Game
34.2
4.4
Blocks Per Game
4.2
10.2
Steals Per Game
7.5
363
Defensive Rebounds
445
133
Steals
98
57
Blocks
54