

Suns vs Cavaliers Live Score (14 Feb, 2027)
Game Information
League
NBA
Season
1
Date
February 14, 2027
Tipoff
1:00 PM EST
Status
Scheduled
Team Stats
 PHX
Game Comparison
CLE
-Points-
-Rebounds-
-Assists-
47Field Goal %47
-3-Point %-
-Free Throw %-
Game Leaders
PHXCLE
 —#
Points
—
—#
—#
Rebounds
—
—#
—#
Assists
—
—#
Injury Report
Cleveland Cavaliers
H2H / Season Series
Last 5 Games






NBA Standings
Western Conference — Pacific
| Team | W | L | PCT | GB | STRK |
|---|---|---|---|---|---|
 LA Lakers | 12 | 2 | .857 | - | W8 |
 Golden State | 8 | 5 | .615 | 3.5 | L2 |
| Phoenix | 5 | 7 | .417 | 6 | L1 |
 LA Clippers | 4 | 8 | .333 | 7 | W2 |
 Sacramento | 1 | 12 | .077 | 10.5 | L6 |



Rosters
Suns
3rd in Pacific Division
VS
Cavaliers
2nd in Central Division
Guard
#15
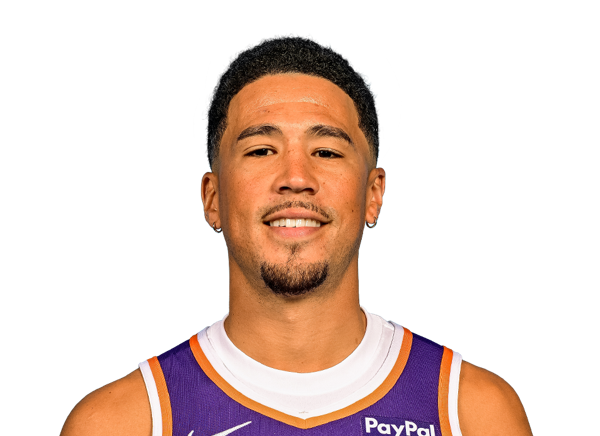
Devin Booker
#4

Jalen Green
#23
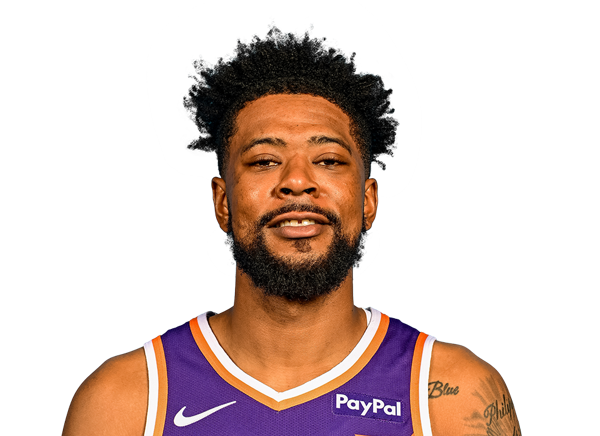
Jordan Goodwin
#12
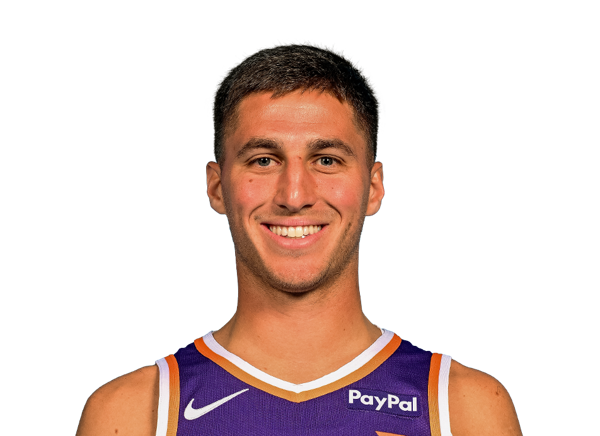
Collin Gillespie
#8
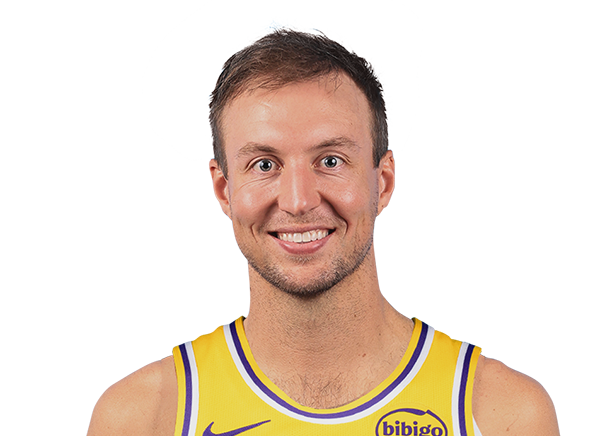
Luke Kennard
#17

Jamaree Bouyea
#61
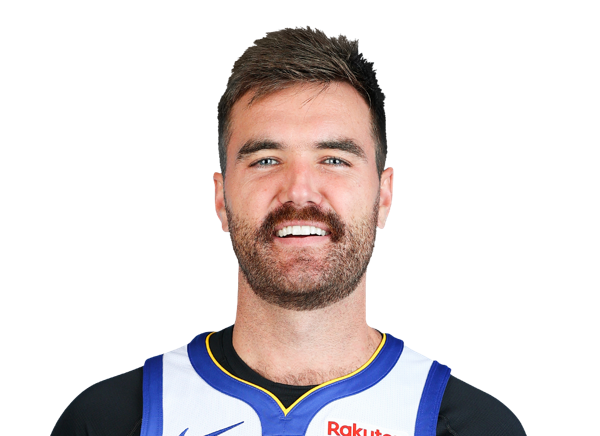
Pat Spencer
Forward
#22
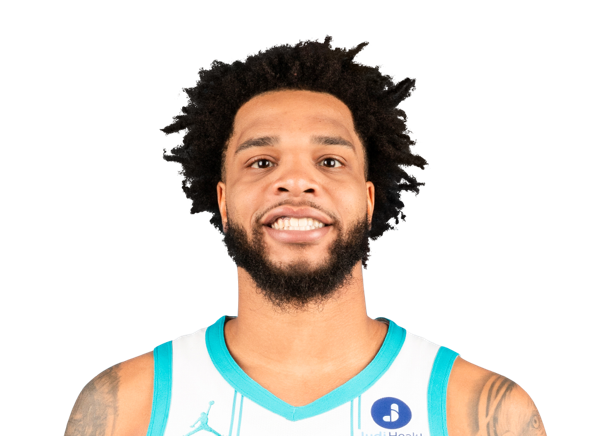
Miles Bridges
#3

Dillon Brooks
#11
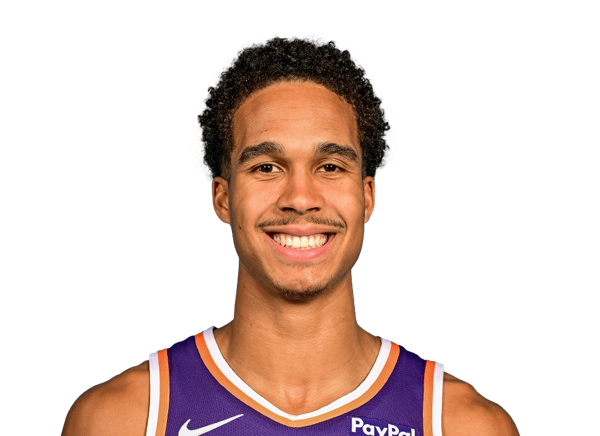
Oso Ighodaro

Ryan Dunn
#18

Koa Peat
#20

Rasheer Fleming
Center
#10
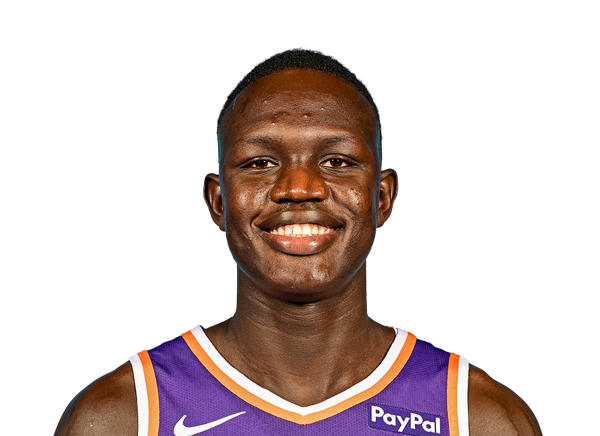
Khaman Maluach
#26
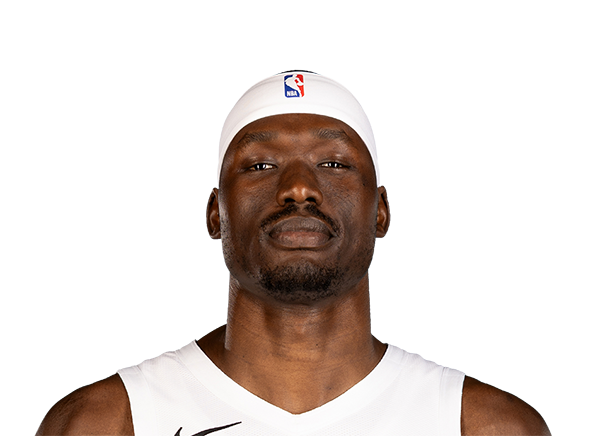
Duop Reath
#25

Mark Williams
Guard
#45
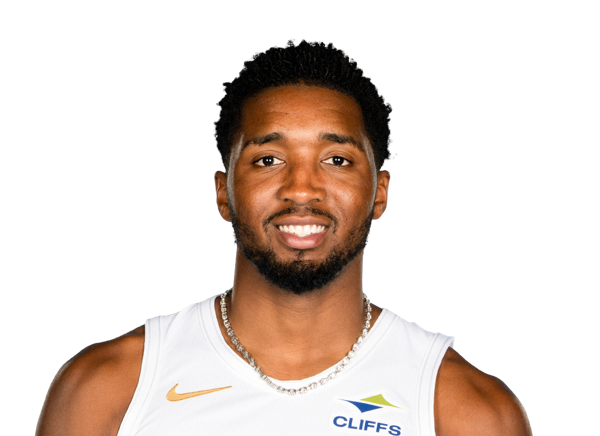
Donovan Mitchell
#1
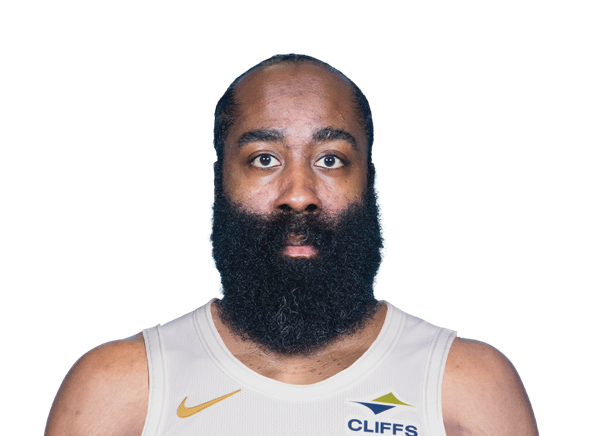
James Harden
#15

Meleek Thomas
#8

Peyton Watson
#24
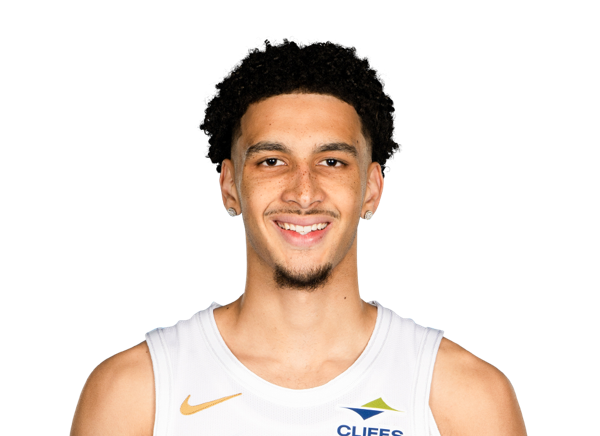
Tyrese Proctor
#5

Sam Merrill
#9
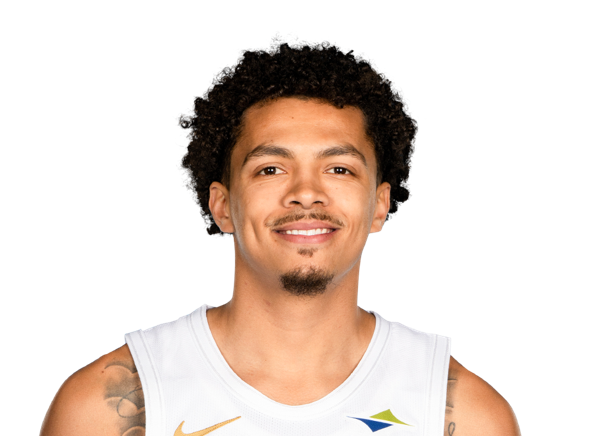
Craig Porter Jr.
#20

Jaylon Tyson
Center
#4
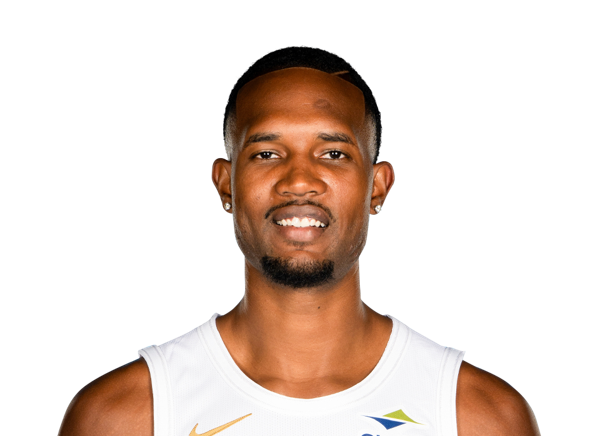
Evan Mobley
#31

Jarrett Allen
#3

Thomas Bryant
#77

Norchad Omier
Forward
#33

Mario Hezonja
#12

Riley Minix
#21

Tristan Enaruna
#35

Nae'Qwan Tomlin
Team Statistics
Suns
3rd in Pacific Division
VS
Cavaliers
2nd in Central Division
General
39.2
Rebounds Per Game
45.6
2.0
Assist To Turnover Ratio
2.1
22.1
Fouls Per Game
21.6
12
Games Played
14
0
Games Started
0
0
Minutes
0
0.0
Minutes Per Game
0.0
470
Rebounds
638
470
Rebounds
638
Offensive
78.0
Free Throw Percentage
76.2
36.0
3-Point Field Goal Percentage
37.0
41.4
Average Field Goals Made
41.8
88.8
Average Field Goals Attempted
88.7
13.6
Average 3-Point Field Goals Made
15.4
37.8
Average 3-Point Field Goals Attempted
41.6
16.3
Average Free Throws Made
18.5
20.8
Average Free Throws Attempted
24.3
112.7
Points Per Game
117.5
10.9
Offensive Rebounds Per Game
10.7
27.3
Assists Per Game
27.1
13.4
Turnovers Per Game
12.9
54.6
2-Point Field Goal Percentage
56.0
1.269
Scoring Efficiency
1.324
0.54
Shooting Efficiency
0.56
46.7
Field Goal Percentage
47.1
334.0
2-Point Field Goals Made
369.0
612.0
2-Point Field Goals Attempted
659.0
1352
Points
1645
131
Offensive Rebounds
150
328
Assists
379
161
Turnovers
181
497
Field Goals Made
585
1065
Field Goals Attempted
1242
195
Free Throws Made
259
250
Free Throws Attempted
340
163
3-Point Field Goals Made
216
453
3-Point Field Goals Attempted
583
36.0
3-Point Field Goal Percentage
37.0
27.8
2-Point Field Goals Made per Game
26.4
51.0
2-Point Field Goals Attempted per Game
47.1
Defensive
28.3
Defensive Rebounds Per Game
34.9
4.4
Blocks Per Game
5.3
8.0
Steals Per Game
7.1
339
Defensive Rebounds
488
96
Steals
99
53
Blocks
74