

Suns vs Celtics Live Score (30 Jan, 2027)
Game Information
League
NBA
Season
1
Date
January 29, 2027
Tipoff
7:30 PM EST
Status
Scheduled
Team Stats
 PHX
Game Comparison
BOS

-Points-
-Rebounds-
-Assists-
46Field Goal %47
-3-Point %-
-Free Throw %-
Game Leaders
PHXBOS
 —#
Points
—
—#
—#Rebounds
—
—#
—#Assists
—
—#
H2H / Season Series
Last 5 Games






NBA Standings
Western Conference — Pacific
| Team | W | L | PCT | GB | STRK |
|---|---|---|---|---|---|
 LA Lakers | 4 | 2 | .667 | - | L1 |
 Golden State | 3 | 3 | .500 | 1 | W3 |
| Phoenix | 1 | 3 | .250 | 2 | L2 |
 LA Clippers | 1 | 4 | .200 | 2.5 | L4 |
 Sacramento | 0 | 5 | .000 | 3.5 | L5 |
Eastern Conference — Atlantic
| Team | W | L | PCT | GB | STRK |
|---|---|---|---|---|---|
 Philadelphia | 5 | 1 | .833 | - | W2 |
| Boston | 4 | 1 | .800 | 0.5 | W4 |
 Toronto | 3 | 2 | .600 | 1.5 | L1 |
 New York | 2 | 4 | .333 | 3 | L1 |
 Brooklyn | 0 | 5 | .000 | 4.5 | L5 |
Rosters
Suns
3rd in Pacific Division
VS
Celtics
2nd in Atlantic Division
Guard
#15
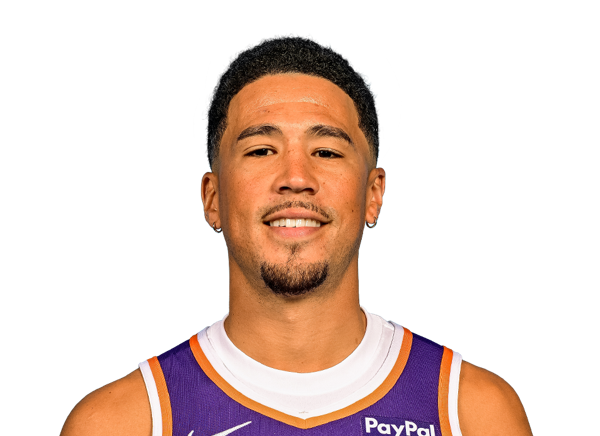
Devin Booker
#4

Jalen Green
#23
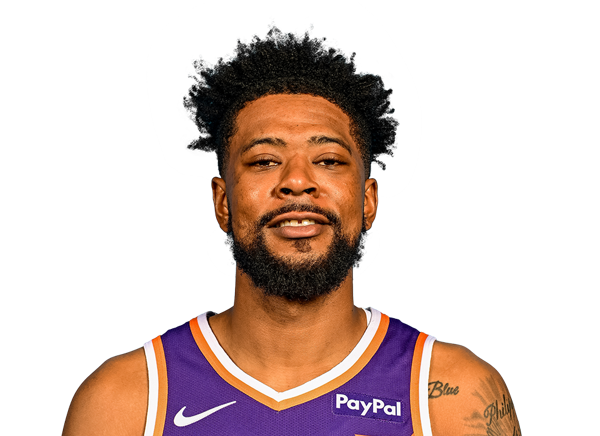
Jordan Goodwin
#8
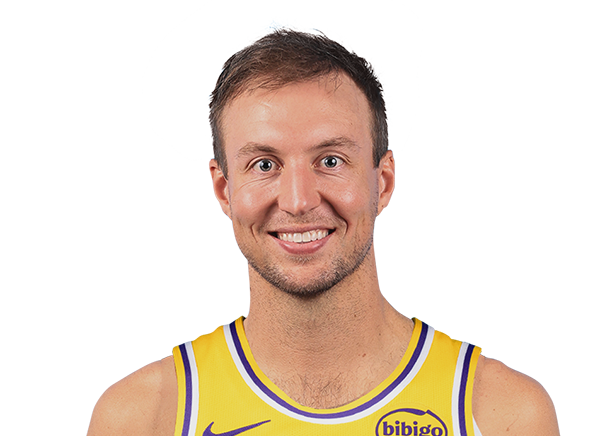
Luke Kennard
#12
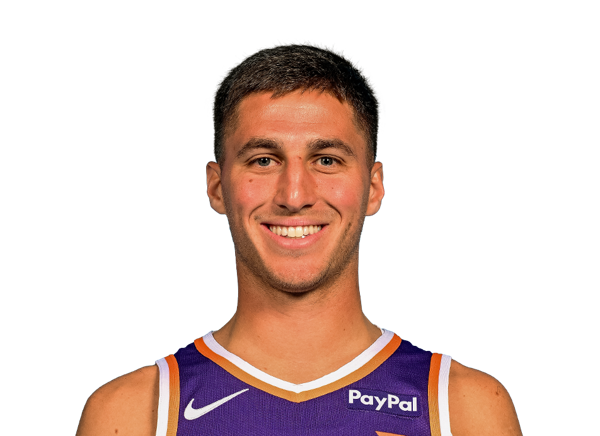
Collin Gillespie
#17

Jamaree Bouyea
#61
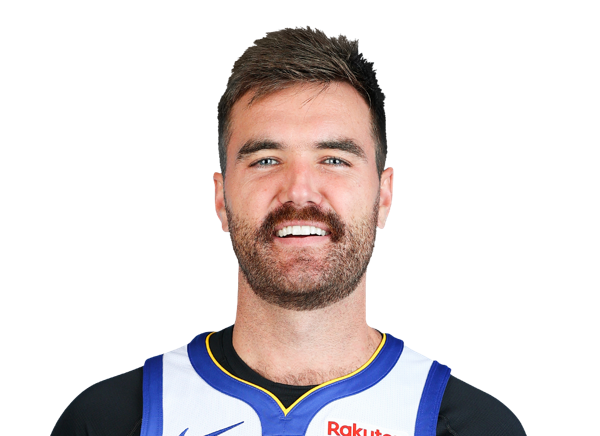
Pat Spencer
Forward
#22
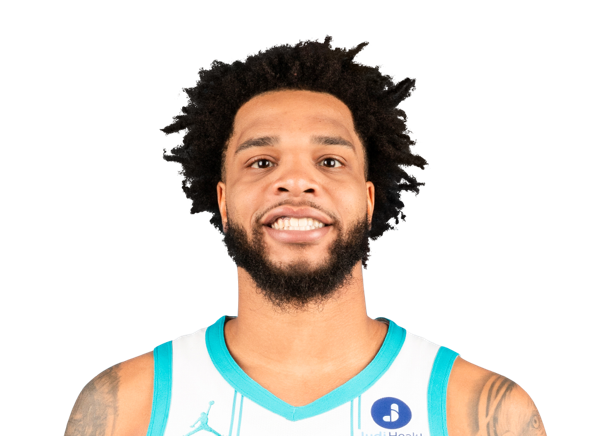
Miles Bridges
#3

Dillon Brooks
#11
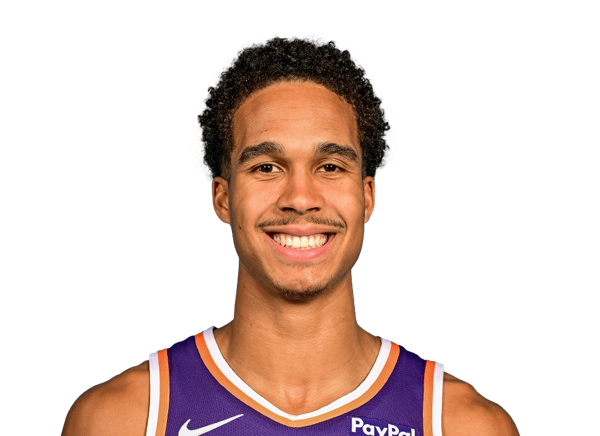
Oso Ighodaro

Ryan Dunn
#18

Koa Peat
#20

Rasheer Fleming
Center
#10
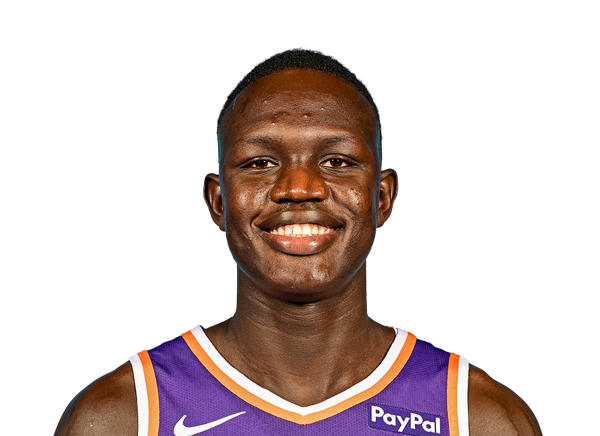
Khaman Maluach
#26
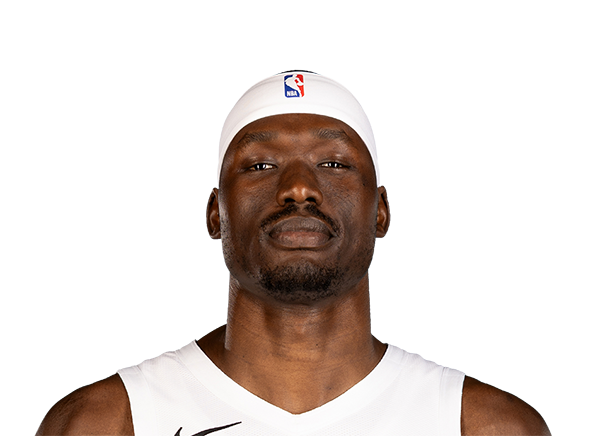
Duop Reath
#25

Mark Williams
Forward

Jayson Tatum
#13
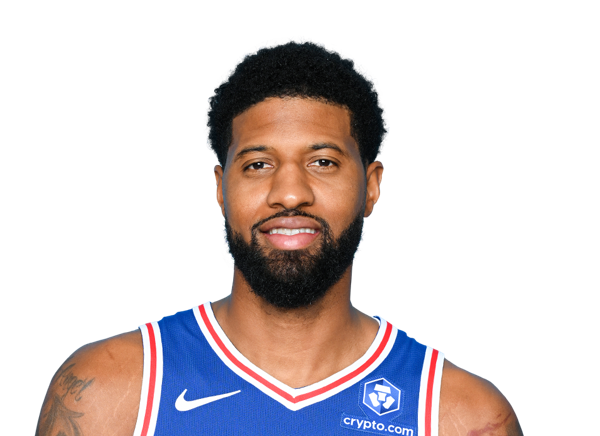
Paul George
#30

Sam Hauser
#12
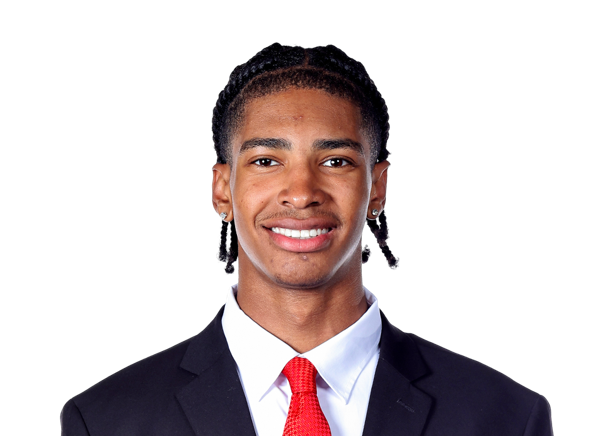
Chris Cenac Jr.
#20
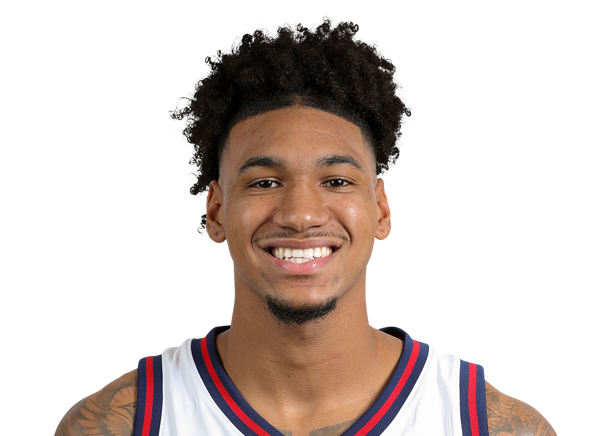
Dillon Mitchell
Guard
#11
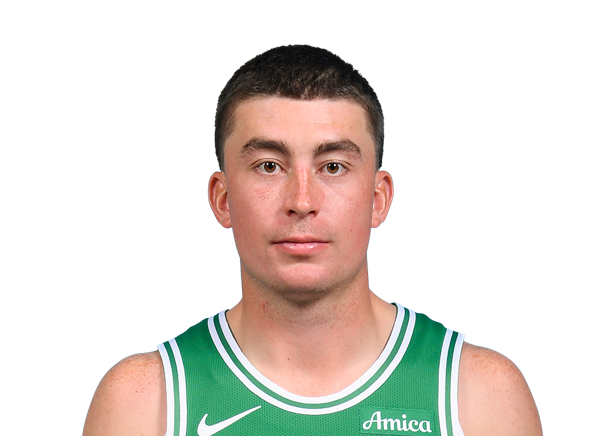
Payton Pritchard
#9
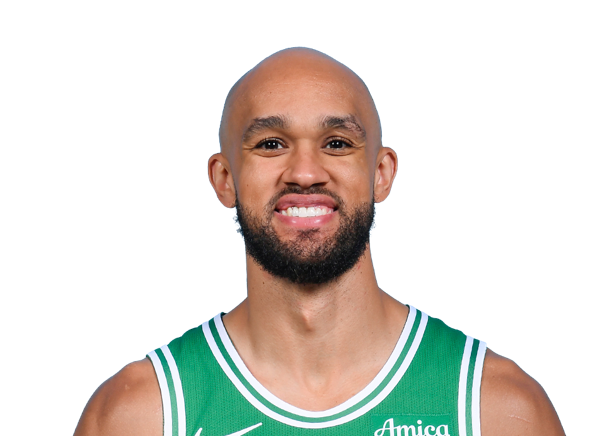
Derrick White
#55

Baylor Scheierman
#27

Jordan Walsh
#28
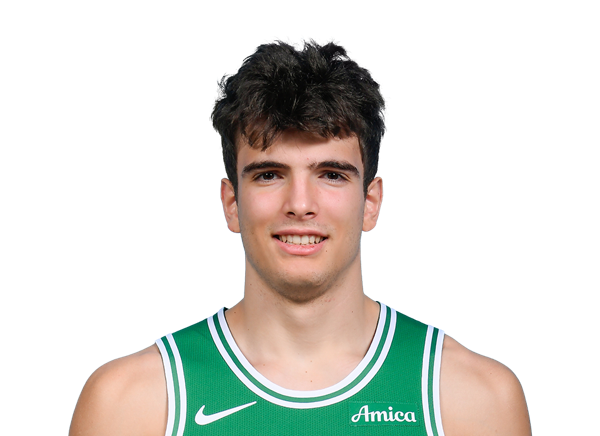
Hugo Gonzalez
#45
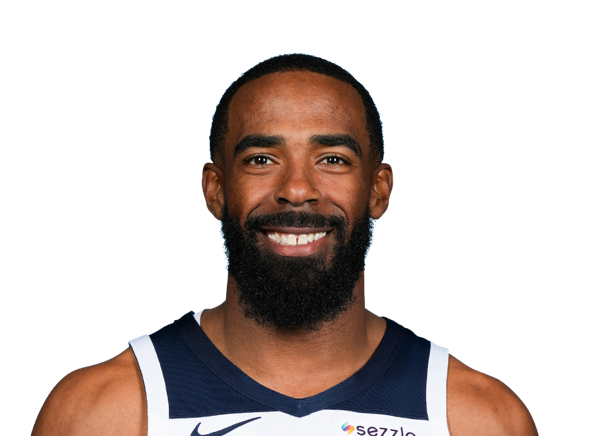
Mike Conley
#8

Ron Harper Jr.
#99
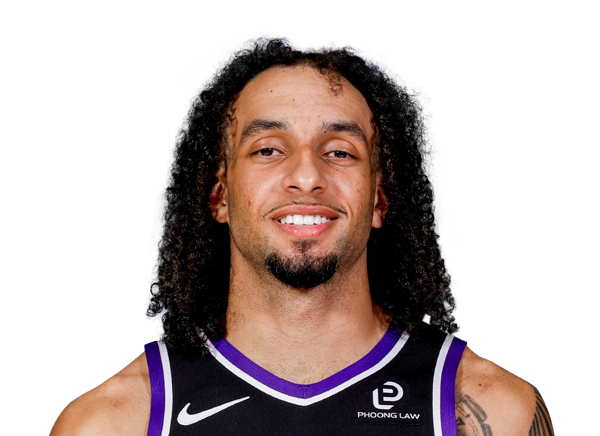
Devin Carter
Center
#88
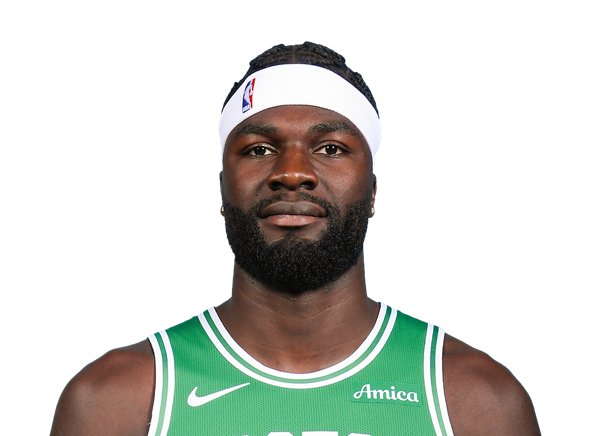
Neemias Queta
#52
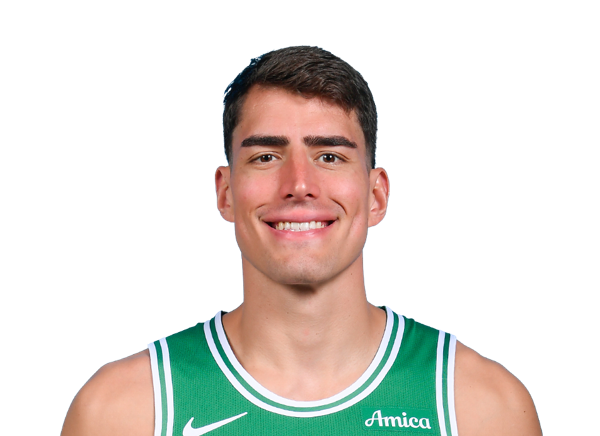
Luka Garza
#4

Mitchell Robinson
Team Statistics
Suns
3rd in Pacific Division
VS
Celtics
2nd in Atlantic Division
General
39.5
Rebounds Per Game
43.9
2.0
Assist To Turnover Ratio
1.8
23.8
Fouls Per Game
23.4
6
Games Played
8
0
Games Started
0
0
Minutes
0
0.0
Minutes Per Game
0.0
237
Rebounds
351
237
Rebounds
351
Offensive
78.2
Free Throw Percentage
78.1
33.9
3-Point Field Goal Percentage
35.3
41.0
Average Field Goals Made
39.5
88.7
Average Field Goals Attempted
87.6
12.8
Average 3-Point Field Goals Made
14.3
37.8
Average 3-Point Field Goals Attempted
40.4
18.5
Average Free Throws Made
21.0
23.7
Average Free Throws Attempted
26.9
113.3
Points Per Game
114.3
12.3
Offensive Rebounds Per Game
13.4
27.3
Assists Per Game
26.5
14.0
Turnovers Per Game
14.4
55.4
2-Point Field Goal Percentage
53.4
1.278
Scoring Efficiency
1.304
0.53
Shooting Efficiency
0.53
46.2
Field Goal Percentage
45.1
169.0
2-Point Field Goals Made
202.0
305.0
2-Point Field Goals Attempted
378.0
680
Points
914
74
Offensive Rebounds
107
164
Assists
212
84
Turnovers
115
246
Field Goals Made
316
532
Field Goals Attempted
701
111
Free Throws Made
168
142
Free Throws Attempted
215
77
3-Point Field Goals Made
114
227
3-Point Field Goals Attempted
323
33.9
3-Point Field Goal Percentage
35.3
28.2
2-Point Field Goals Made per Game
25.3
50.8
2-Point Field Goals Attempted per Game
47.3
Defensive
27.2
Defensive Rebounds Per Game
30.5
5.5
Blocks Per Game
4.0
8.7
Steals Per Game
8.6
163
Defensive Rebounds
244
52
Steals
69
33
Blocks
32