

Suns vs Nets Live Score (28 Jan, 2027)
Game Information
League
NBA
Season
1
Date
January 27, 2027
Tipoff
7:30 PM EST
Status
Scheduled
Team Stats
 PHX
Game Comparison
BKN

-Points-
-Rebounds-
-Assists-
46Field Goal %43
-3-Point %-
-Free Throw %-
Game Leaders
PHXBKN
 —#
Points
—
—#
—#Rebounds
—
—#
—#Assists
—
—#
Injury Report
H2H / Season Series
Last 5 Games








NBA Standings
Western Conference — Pacific
| Team | W | L | PCT | GB | STRK |
|---|---|---|---|---|---|
 LA Lakers | 4 | 1 | .800 | - | W1 |
 Golden State | 2 | 3 | .400 | 2 | W2 |
| Phoenix | 1 | 2 | .333 | 2 | L1 |
 LA Clippers | 1 | 3 | .250 | 2.5 | L3 |
 Sacramento | 0 | 4 | .000 | 3.5 | L4 |
Eastern Conference — Atlantic
| Team | W | L | PCT | GB | STRK |
|---|---|---|---|---|---|
 Philadelphia | 4 | 1 | .800 | - | W1 |
 Toronto | 3 | 1 | .750 | 0.5 | W1 |
 Boston | 3 | 1 | .750 | 0.5 | W3 |
 New York | 2 | 3 | .400 | 2 | W2 |
| Brooklyn | 0 | 4 | .000 | 3.5 | L4 |
Rosters
Suns
3rd in Pacific Division
VS
Nets
5th in Atlantic Division
Guard
#15
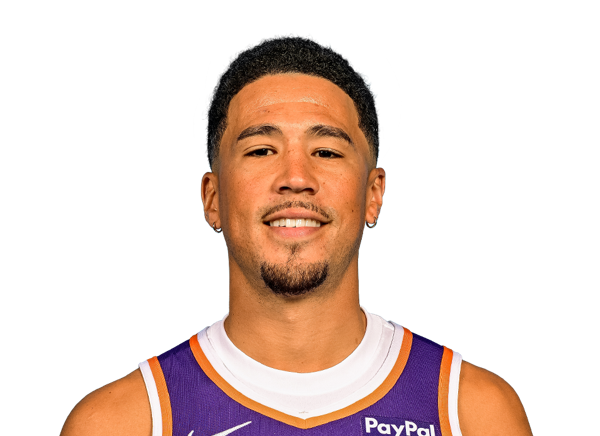
Devin Booker
#4

Jalen Green
#8

Luke Kennard
#23

Jordan Goodwin
#12

Collin Gillespie
#61
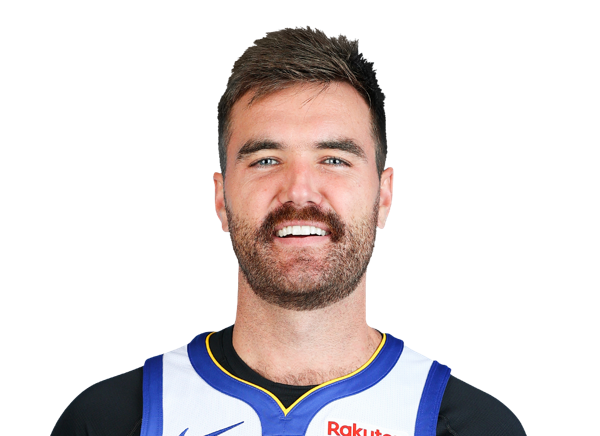
Pat Spencer
#17

Jamaree Bouyea
Forward
#22

Miles Bridges
#3

Dillon Brooks
#11
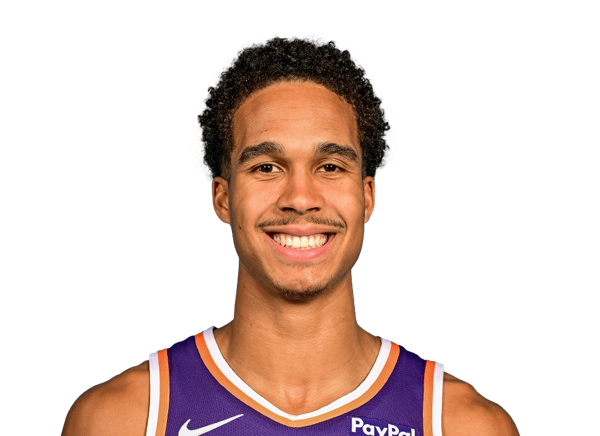
Oso Ighodaro

Ryan Dunn
#18

Koa Peat
#20

Rasheer Fleming
Center
#10
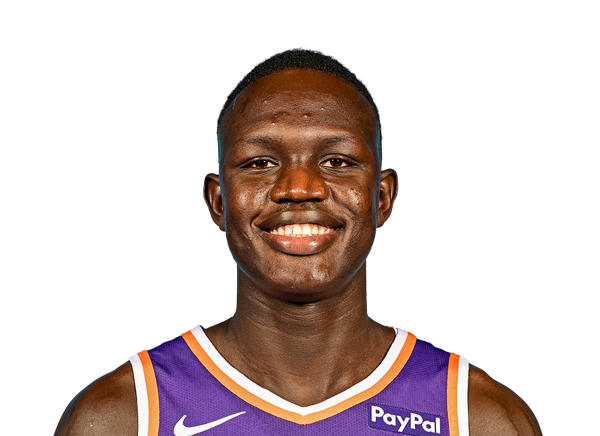
Khaman Maluach
#26

Duop Reath
#25

Mark Williams
Forward
#30

Julius Randle
#17
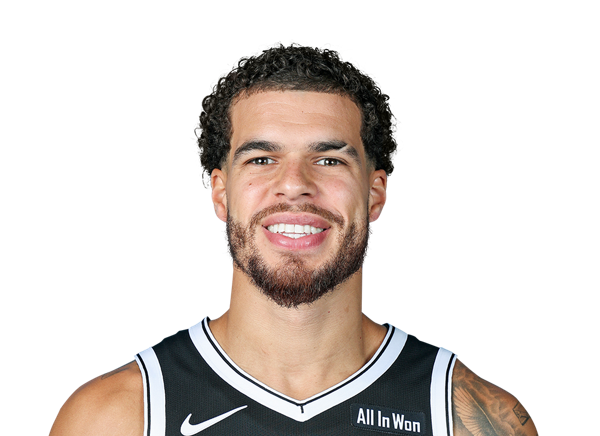
Michael Porter Jr.
#31

Chaney Johnson
#21
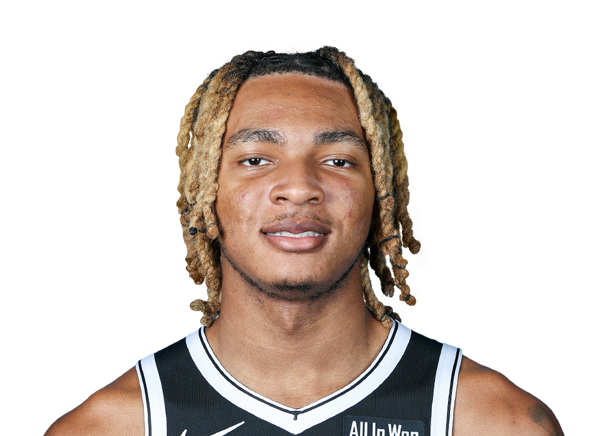
Noah Clowney
#00

Josh Minott
#2

Danny Wolf
#9

Joshua Jefferson
#34

Tyler Bilodeau
Guard
#10

Nolan Traore
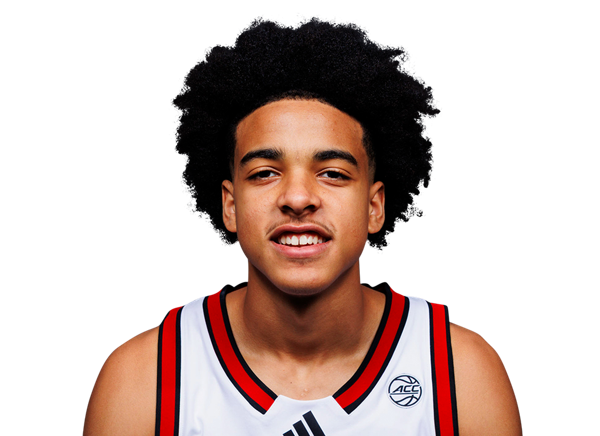
Mikel Brown Jr.
#1

Keon Ellis
#8

Egor Demin
#77

Ben Saraf
#14

Terance Mann
#4

Drake Powell
Center
#13

Moritz Wagner
#20
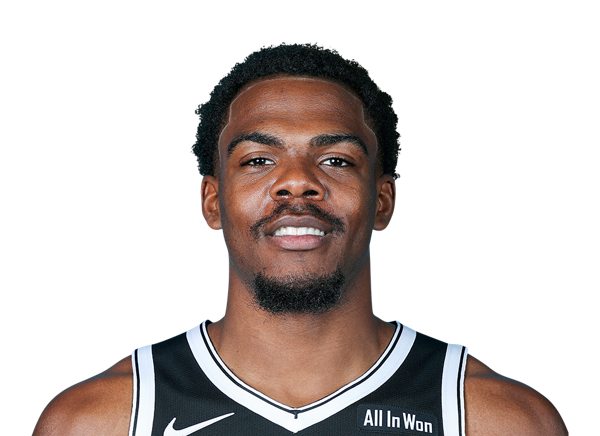
Day'Ron Sharpe
Team Statistics
Suns
3rd in Pacific Division
VS
Nets
5th in Atlantic Division
General
39.6
Rebounds Per Game
43.6
1.9
Assist To Turnover Ratio
1.3
22.8
Fouls Per Game
25.6
5
Games Played
7
0
Games Started
0
0
Minutes
0
0.0
Minutes Per Game
0.0
198
Rebounds
305
198
Rebounds
305
Offensive
75.7
Free Throw Percentage
76.9
35.1
3-Point Field Goal Percentage
35.0
41.0
Average Field Goals Made
35.0
88.0
Average Field Goals Attempted
83.9
13.4
Average 3-Point Field Goals Made
14.1
38.2
Average 3-Point Field Goals Attempted
40.4
16.8
Average Free Throws Made
21.4
22.2
Average Free Throws Attempted
27.9
112.2
Points Per Game
105.6
12.0
Offensive Rebounds Per Game
11.3
27.6
Assists Per Game
22.4
14.4
Turnovers Per Game
17.3
55.4
2-Point Field Goal Percentage
48.0
1.275
Scoring Efficiency
1.259
0.54
Shooting Efficiency
0.50
46.6
Field Goal Percentage
41.7
138.0
2-Point Field Goals Made
146.0
249.0
2-Point Field Goals Attempted
304.0
561
Points
739
60
Offensive Rebounds
79
138
Assists
157
72
Turnovers
121
205
Field Goals Made
245
440
Field Goals Attempted
587
84
Free Throws Made
150
111
Free Throws Attempted
195
67
3-Point Field Goals Made
99
191
3-Point Field Goals Attempted
283
35.1
3-Point Field Goal Percentage
35.0
27.6
2-Point Field Goals Made per Game
20.9
49.8
2-Point Field Goals Attempted per Game
43.4
Defensive
27.6
Defensive Rebounds Per Game
32.3
5.2
Blocks Per Game
5.0
9.4
Steals Per Game
8.7
138
Defensive Rebounds
226
47
Steals
61
26
Blocks
35