

Suns vs Timberwolves Live Score (31 Jan, 2027)
Game Information
League
NBA
Season
1
Date
January 31, 2027
Tipoff
6:00 PM EST
Status
Scheduled
Team Stats
 PHX
Game Comparison
MIN
-Points-
-Rebounds-
-Assists-
46Field Goal %48
-3-Point %-
-Free Throw %-
Game Leaders
PHXMIN
 —#
Points
—
—#
—#
Rebounds
—
—#
—#
Assists
—
—#
Injury Report
Phoenix Suns
H2H / Season Series
Last 5 Games



NBA Standings
Western Conference — Pacific
| Team | W | L | PCT | GB | STRK |
|---|---|---|---|---|---|
 LA Lakers | 4 | 2 | .667 | - | L1 |
 Golden State | 3 | 3 | .500 | 1 | W3 |
| Phoenix | 1 | 3 | .250 | 2 | L2 |
 LA Clippers | 1 | 4 | .200 | 2.5 | L4 |
 Sacramento | 0 | 6 | .000 | 4 | L6 |
Western Conference — Northwest
| Team | W | L | PCT | GB | STRK |
|---|---|---|---|---|---|
 Portland | 4 | 1 | .800 | - | W1 |
 Oklahoma City | 4 | 2 | .667 | 0.5 | L2 |
 Denver | 3 | 2 | .600 | 1 | W2 |
| Minnesota | 4 | 3 | .571 | 1 | L1 |
 Utah | 1 | 5 | .167 | 3.5 | L4 |
Rosters
Suns
3rd in Pacific Division
VS
Timberwolves
4th in Western Conference Division
Guard
#15
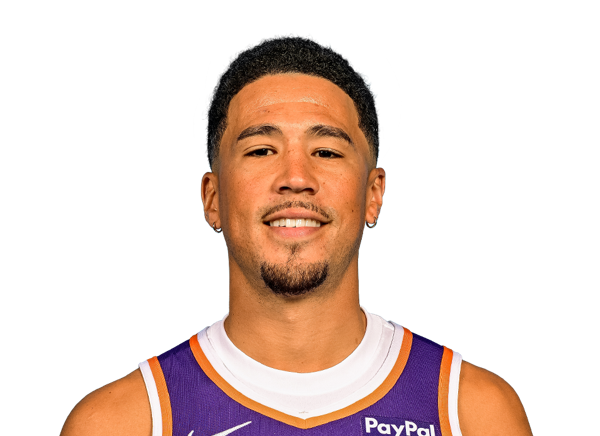
Devin Booker
#4
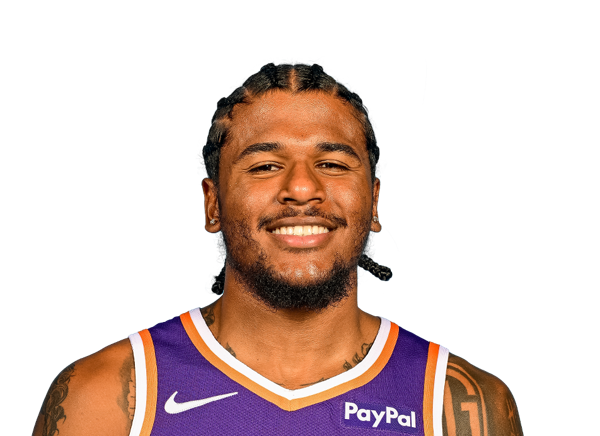
Jalen Green
#23
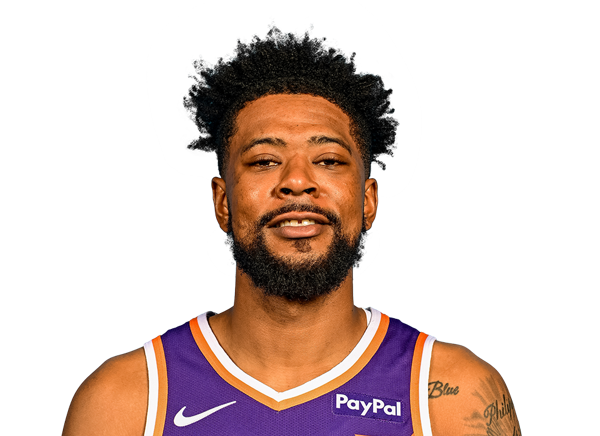
Jordan Goodwin
#12
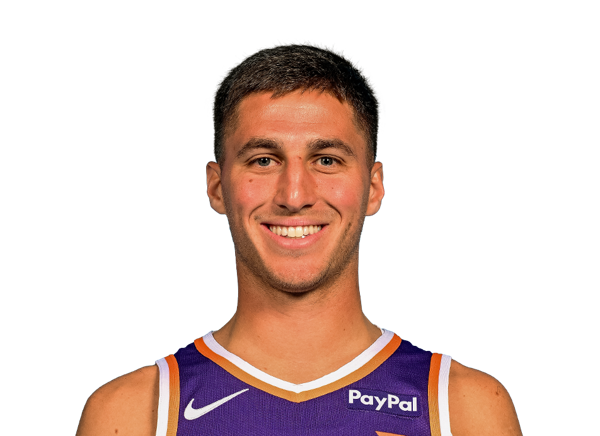
Collin Gillespie
#8
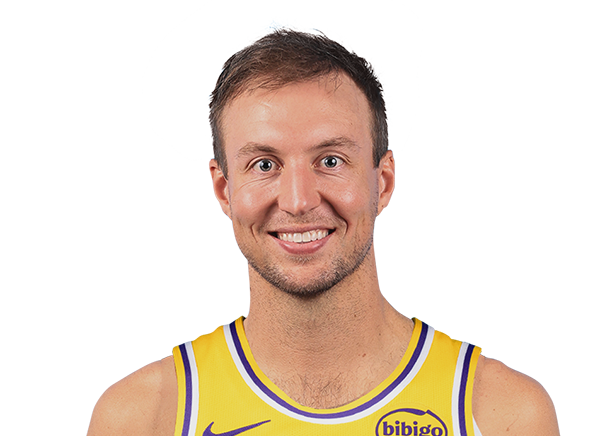
Luke Kennard
#17
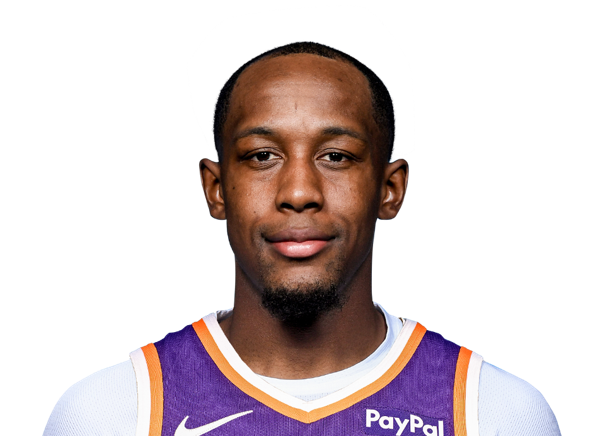
Jamaree Bouyea
#61
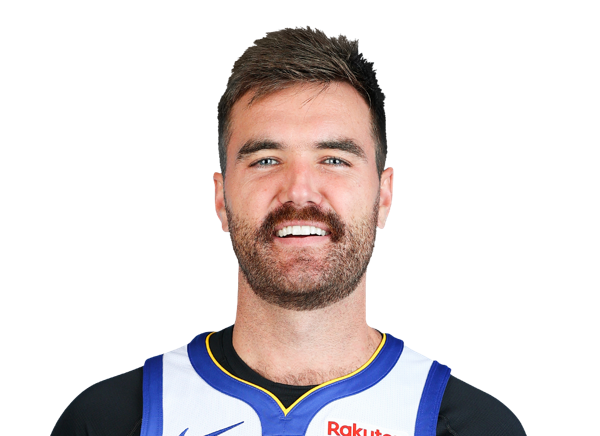
Pat Spencer
Forward
#22
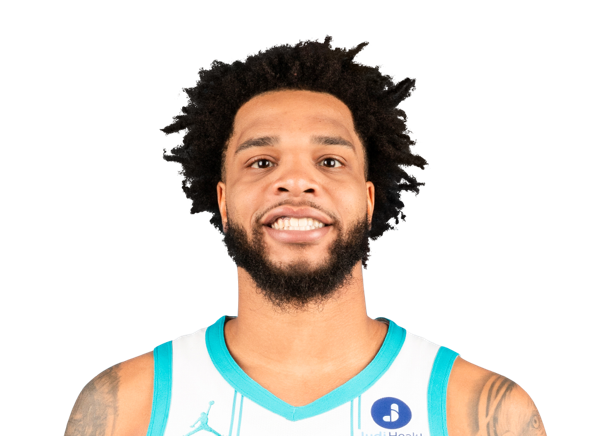
Miles Bridges
#3

Dillon Brooks
#11
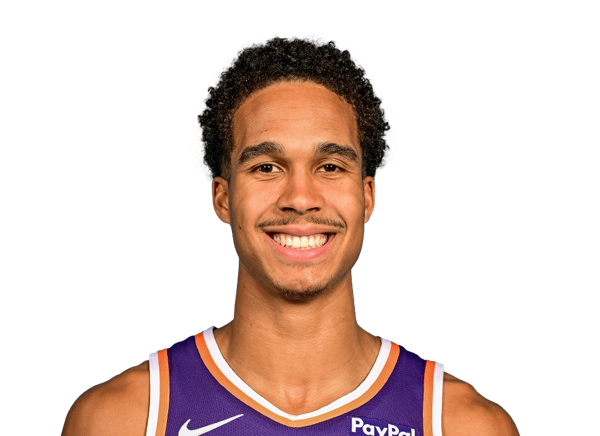
Oso Ighodaro

Ryan Dunn
#18

Koa Peat
#20

Rasheer Fleming
Center
#10
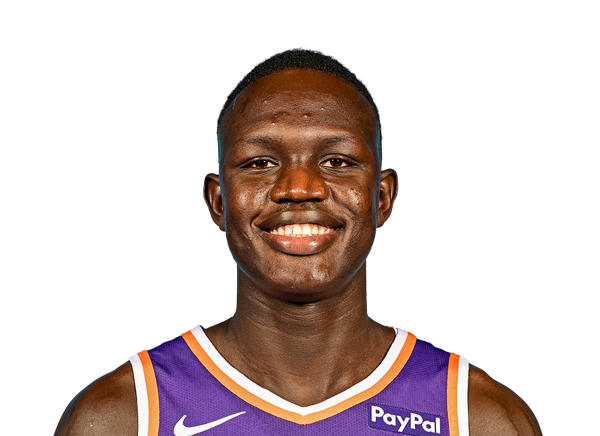
Khaman Maluach
#26
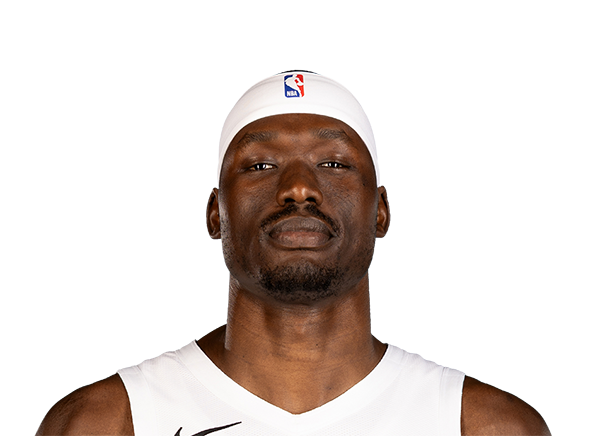
Duop Reath
#25

Mark Williams
Guard
#1
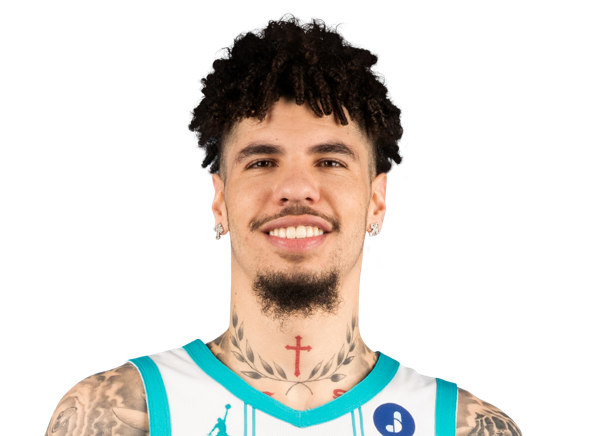
LaMelo Ball
#13
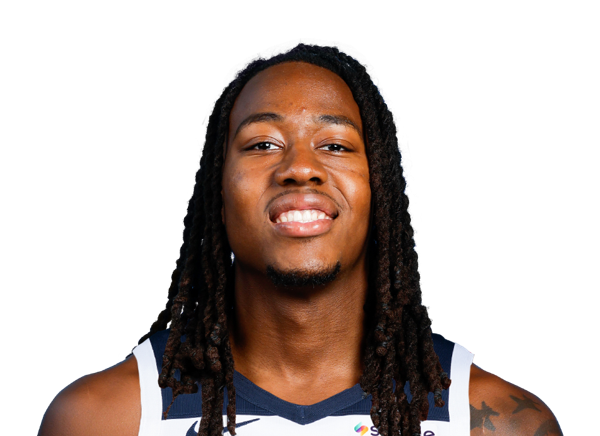
Ayo Dosunmu
#4

Terrence Shannon Jr.
#8

Bones Hyland
#7
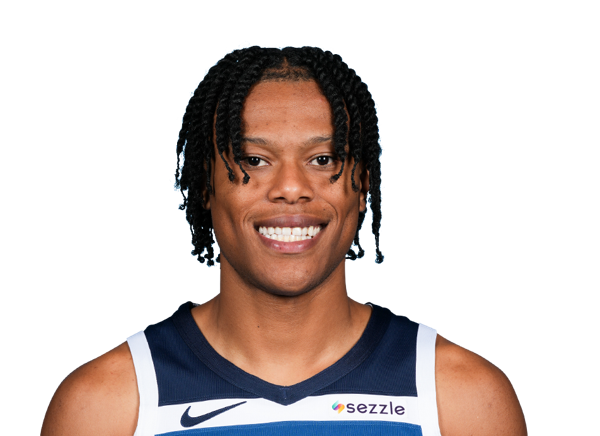
Jaylen Clark
#5

Anthony Edwards
#15
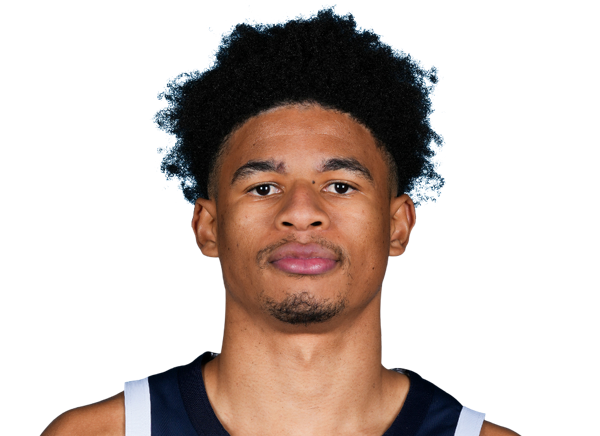
Zyon Pullin

Donte DiVincenzo
Forward
#3

Jaden McDaniels
#24

Jonathan Kuminga
#41
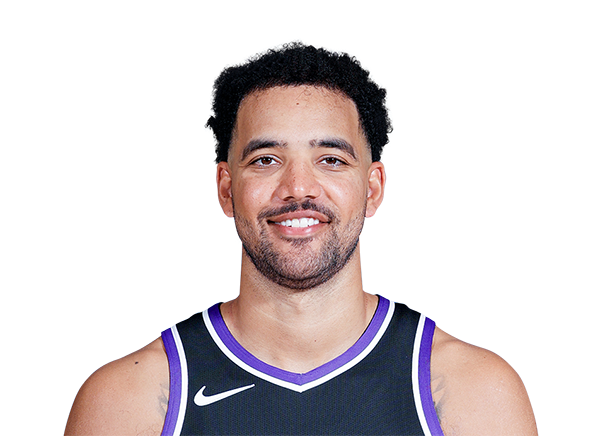
Trey Lyles
#19
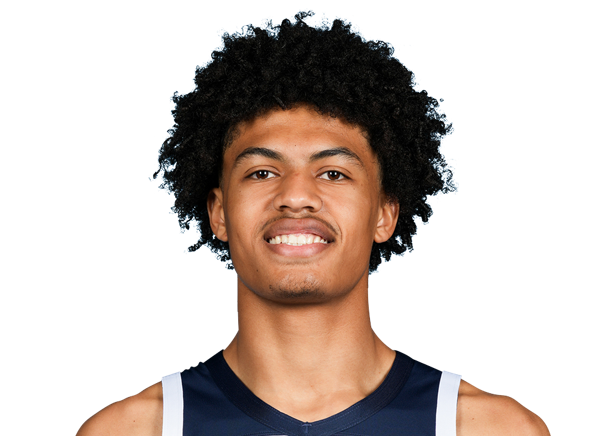
Joan Beringer
#33

Isaiah Evans
#9
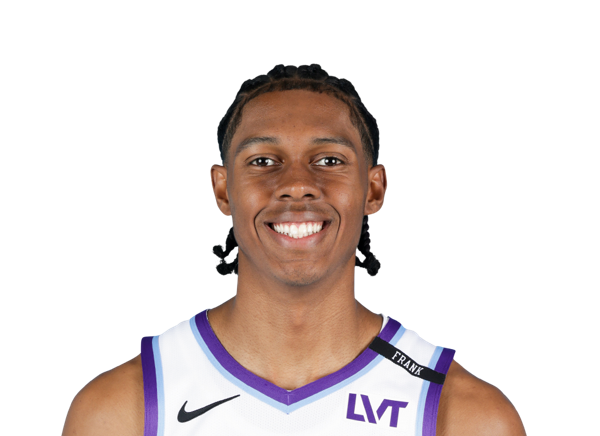
Cody Williams
Center
#27
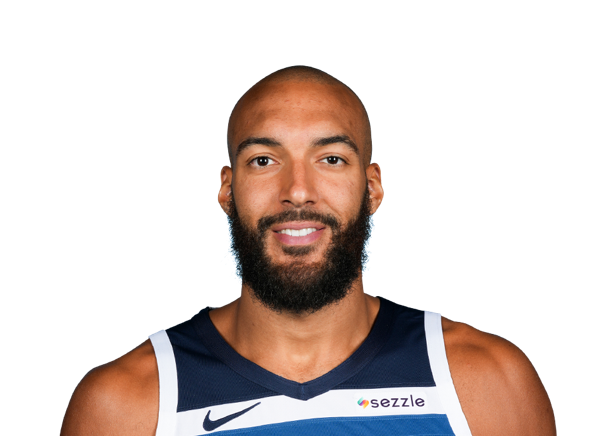
Rudy Gobert
#44

Rocco Zikarsky
Team Statistics
Suns
3rd in Pacific Division
VS
Timberwolves
4th in Western Conference Division
General
39.2
Rebounds Per Game
48.5
2.0
Assist To Turnover Ratio
1.7
22.1
Fouls Per Game
22.0
12
Games Played
13
0
Games Started
0
0
Minutes
0
0.0
Minutes Per Game
0.0
470
Rebounds
630
470
Rebounds
630
Offensive
78.0
Free Throw Percentage
68.1
36.0
3-Point Field Goal Percentage
36.9
41.4
Average Field Goals Made
43.4
88.8
Average Field Goals Attempted
90.9
13.6
Average 3-Point Field Goals Made
14.2
37.8
Average 3-Point Field Goals Attempted
38.4
16.3
Average Free Throws Made
17.4
20.8
Average Free Throws Attempted
25.5
112.7
Points Per Game
118.3
10.9
Offensive Rebounds Per Game
13.8
27.3
Assists Per Game
26.0
13.4
Turnovers Per Game
15.2
54.6
2-Point Field Goal Percentage
55.6
1.269
Scoring Efficiency
1.301
0.54
Shooting Efficiency
0.55
46.7
Field Goal Percentage
47.7
334.0
2-Point Field Goals Made
380.0
612.0
2-Point Field Goals Attempted
683.0
1352
Points
1538
131
Offensive Rebounds
180
328
Assists
338
161
Turnovers
198
497
Field Goals Made
564
1065
Field Goals Attempted
1182
195
Free Throws Made
226
250
Free Throws Attempted
332
163
3-Point Field Goals Made
184
453
3-Point Field Goals Attempted
499
36.0
3-Point Field Goal Percentage
36.9
27.8
2-Point Field Goals Made per Game
29.2
51.0
2-Point Field Goals Attempted per Game
52.5
Defensive
28.3
Defensive Rebounds Per Game
34.6
4.4
Blocks Per Game
5.1
8.0
Steals Per Game
9.0
339
Defensive Rebounds
450
96
Steals
117
53
Blocks
66