

Thunder vs Nuggets Live Score (3 Feb, 2027)
Game Information
League
NBA
Season
1
Date
February 2, 2027
Tipoff
9:00 PM EST
Status
Scheduled
Team Stats
 OKC
Game Comparison
DEN
-Points-
-Rebounds-
-Assists-
44Field Goal %47
-3-Point %-
-Free Throw %-
Game Leaders
OKCDEN
 —#
Points
—
—#
—#
Rebounds
—
—#
—#
Assists
—
—#
Injury Report
Oklahoma City Thunder
H2H / Season Series
Last 5 Games







NBA Standings
Western Conference — Northwest
| Team | W | L | PCT | GB | STRK |
|---|---|---|---|---|---|
 Portland | 5 | 1 | .833 | - | W2 |
| Oklahoma City | 5 | 2 | .714 | 0.5 | W1 |
 Minnesota | 5 | 3 | .625 | 1 | W1 |
| Denver | 3 | 3 | .500 | 2 | L1 |
 Utah | 1 | 6 | .143 | 4.5 | L5 |
Rosters
Thunder
7th in Western Conference Division
VS
Nuggets
8th in Western Conference Division
Guard
#2

Shai Gilgeous-Alexander
#25

Ajay Mitchell
#3

Jared McCain
#9

Alex Caruso
#34

Kenrich Williams
#14

Bennett Stirtz
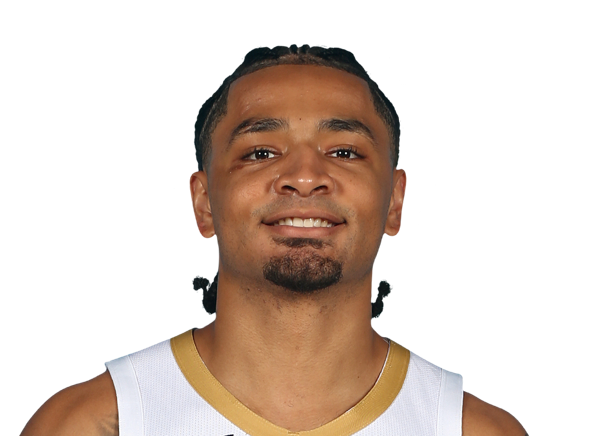
Micah Peavy
#8
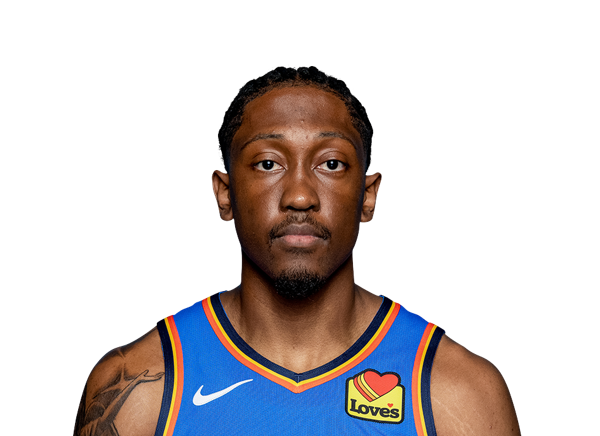
Jalen Williams
#22
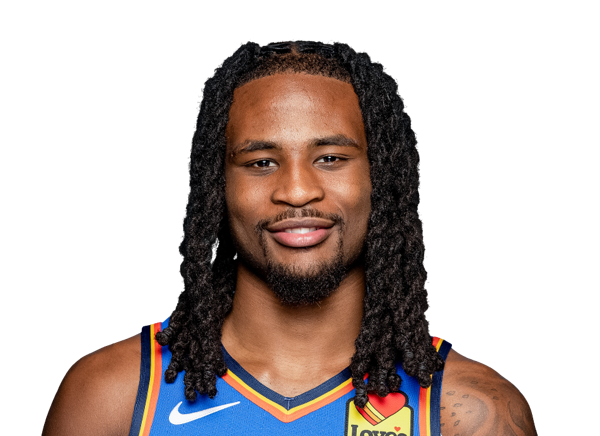
Cason Wallace

Nique Clifford
#44

Nikola Topic
#21

Josh Dix

Dalen Terry
Center
#15

Aday Mara
#55

Isaiah Hartenstein
#7

Chet Holmgren
#12

Thomas Sorber
Forward
#23

Brooks Barnhizer
#6
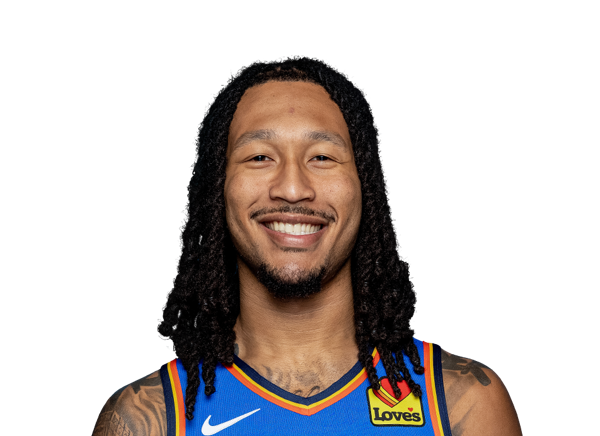
Jaylin Williams
Guard
#27
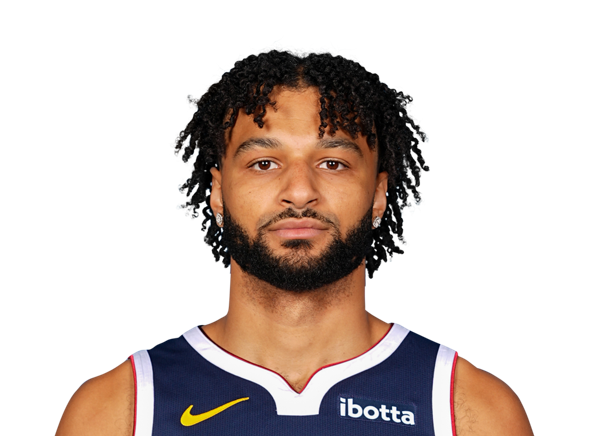
Jamal Murray

Christian Braun
#10
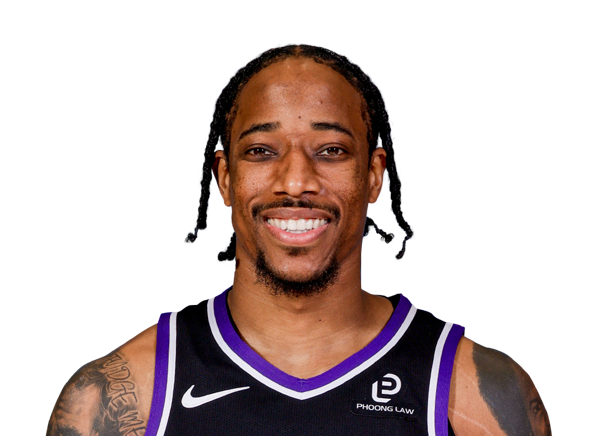
DeMar DeRozan
#5
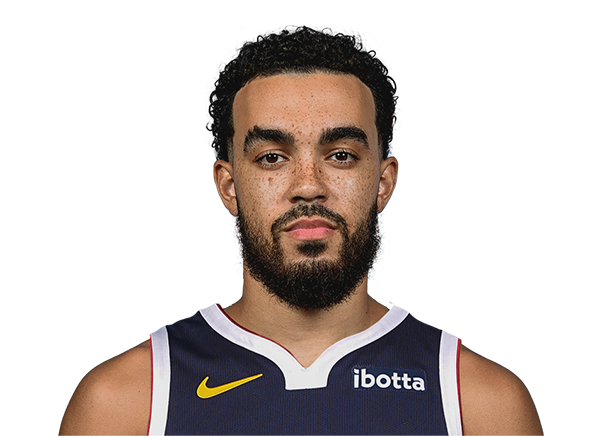
Tyus Jones
#9

Ryan Nembhard
#1
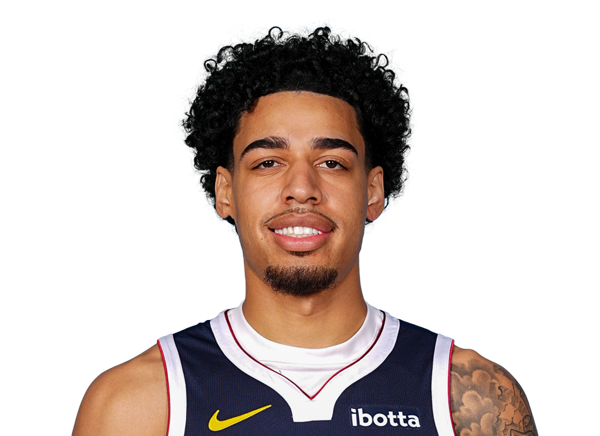
Julian Strawther
Center
#15

Nikola Jokic
Forward
#23
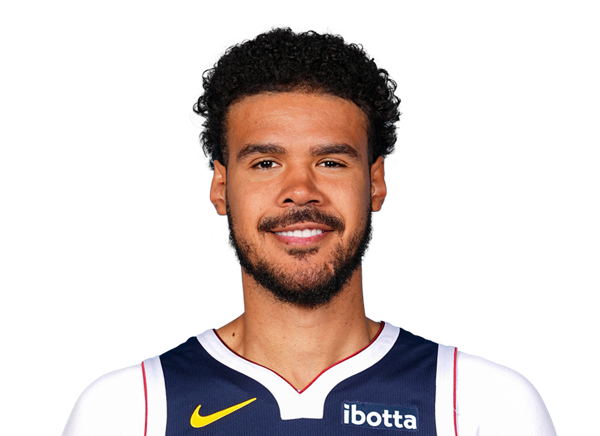
Cameron Johnson
#32

Aaron Gordon
#7
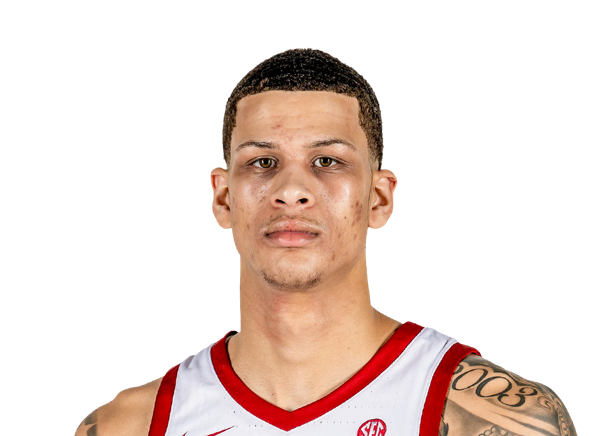
Trevon Brazile
#3

Marvin Bagley III
#13

Bryce Hopkins
#21
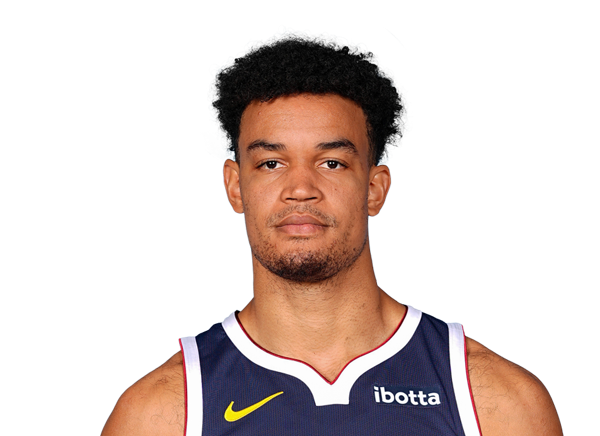
Spencer Jones
#00
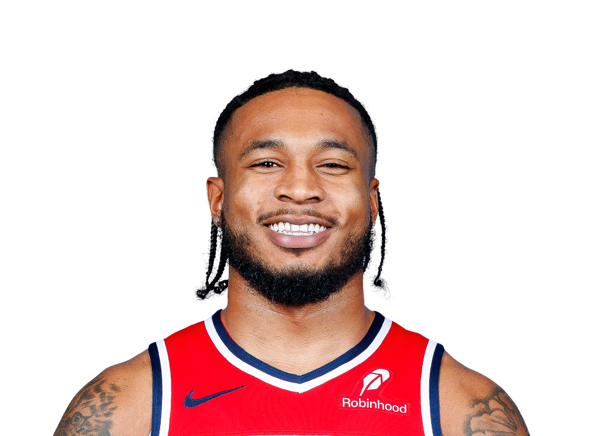
Cam Whitmore
#22

Zeke Nnaji
#11
Alpha Diallo
#14

DaRon Holmes II
Team Statistics
Thunder
7th in Western Conference Division
VS
Nuggets
8th in Western Conference Division
General
46.1
Rebounds Per Game
42.3
1.9
Assist To Turnover Ratio
2.2
19.4
Fouls Per Game
19.0
14
Games Played
11
0
Games Started
0
0
Minutes
0
0.0
Minutes Per Game
0.0
646
Rebounds
465
646
Rebounds
465
Offensive
81.7
Free Throw Percentage
79.0
34.2
3-Point Field Goal Percentage
34.9
41.5
Average Field Goals Made
41.5
90.5
Average Field Goals Attempted
85.2
10.9
Average 3-Point Field Goals Made
10.8
32.0
Average 3-Point Field Goals Attempted
31.0
18.2
Average Free Throws Made
20.9
22.3
Average Free Throws Attempted
26.5
112.1
Points Per Game
114.6
11.6
Offensive Rebounds Per Game
10.1
22.7
Assists Per Game
27.7
12.2
Turnovers Per Game
12.5
52.3
2-Point Field Goal Percentage
56.5
1.239
Scoring Efficiency
1.346
0.52
Shooting Efficiency
0.55
45.9
Field Goal Percentage
48.7
428.0
2-Point Field Goals Made
337.0
819.0
2-Point Field Goals Attempted
596.0
1570
Points
1261
162
Offensive Rebounds
111
318
Assists
305
171
Turnovers
137
581
Field Goals Made
456
1267
Field Goals Attempted
937
255
Free Throws Made
230
312
Free Throws Attempted
291
153
3-Point Field Goals Made
119
448
3-Point Field Goals Attempted
341
34.2
3-Point Field Goal Percentage
34.9
30.6
2-Point Field Goals Made per Game
30.6
58.5
2-Point Field Goals Attempted per Game
54.2
Defensive
34.6
Defensive Rebounds Per Game
32.2
5.1
Blocks Per Game
4.5
8.4
Steals Per Game
9.0
484
Defensive Rebounds
354
118
Steals
99
72
Blocks
50