

Thunder vs Timberwolves Live Score (26 Dec, 2026)
Game Information
League
NBA
Season
1
Date
December 25, 2026
Tipoff
8:00 PM EST
Status
Scheduled
Team Stats
 OKC
Game Comparison
MIN
-Points-
-Rebounds-
-Assists-
46Field Goal %47
-3-Point %-
-Free Throw %-
Game Leaders
OKCMIN
 —#
Points
—
—#
—#
Rebounds
—
—#
—#
Assists
—
—#
Injury Report
Oklahoma City Thunder
H2H / Season Series
Last 5 Games






NBA Standings
Western Conference — Northwest
| Team | W | L | PCT | GB | STRK |
|---|---|---|---|---|---|
| Minnesota | 11 | 5 | .688 | - | L1 |
 Portland | 10 | 5 | .667 | 0.5 | W1 |
 Denver | 8 | 5 | .615 | 1.5 | W1 |
| Oklahoma City | 9 | 6 | .600 | 1.5 | L1 |
 Utah | 3 | 13 | .188 | 8 | W2 |
Rosters
Thunder
6th in Western Conference Division
VS
Timberwolves
3rd in Western Conference Division
Guard
#2

Shai Gilgeous-Alexander
#25

Ajay Mitchell
#3

Jared McCain
#14

Bennett Stirtz
#9

Alex Caruso
#34

Kenrich Williams
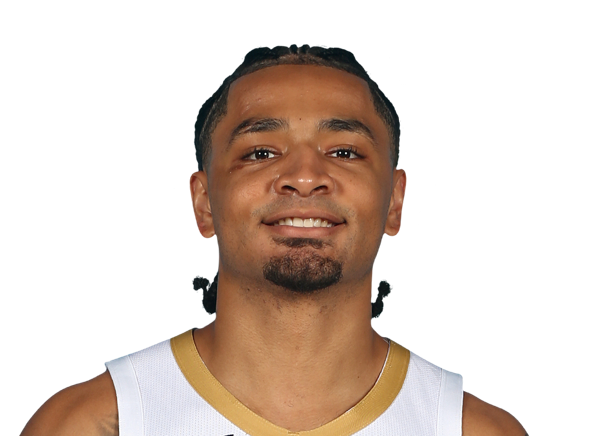
Micah Peavy
#8
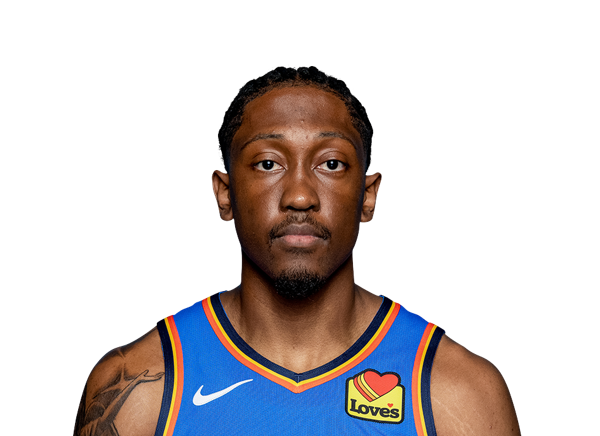
Jalen Williams
#22
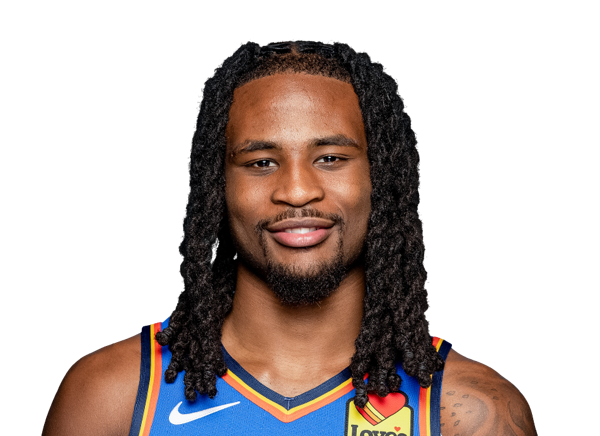
Cason Wallace
#18
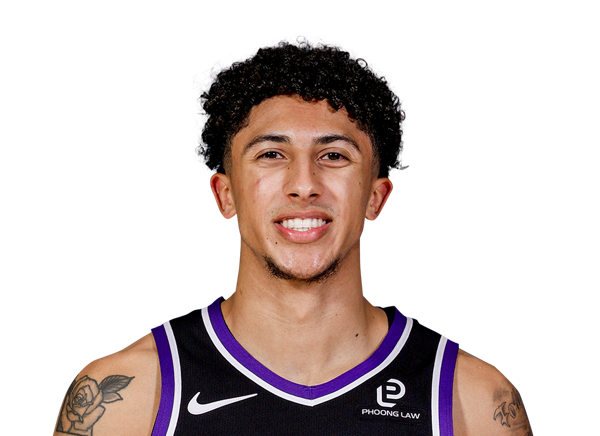
Nique Clifford
#44
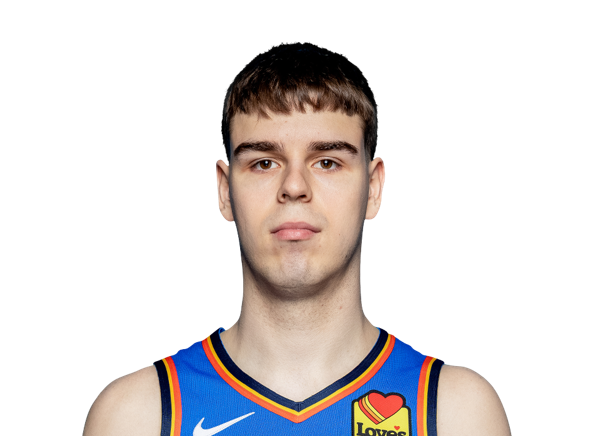
Nikola Topic
#21

Josh Dix
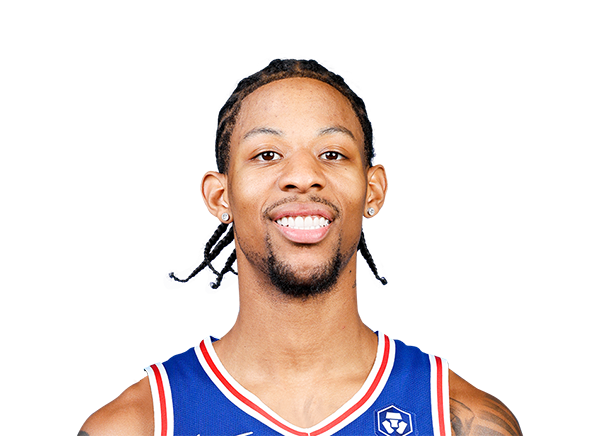
Dalen Terry
Center
#15
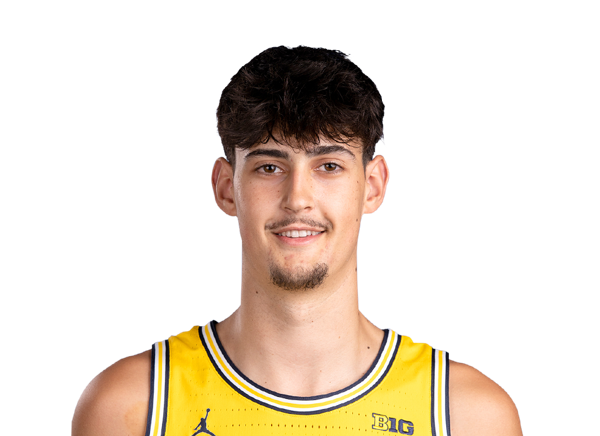
Aday Mara
#55

Isaiah Hartenstein
#7

Chet Holmgren
#12

Thomas Sorber
Forward
#6
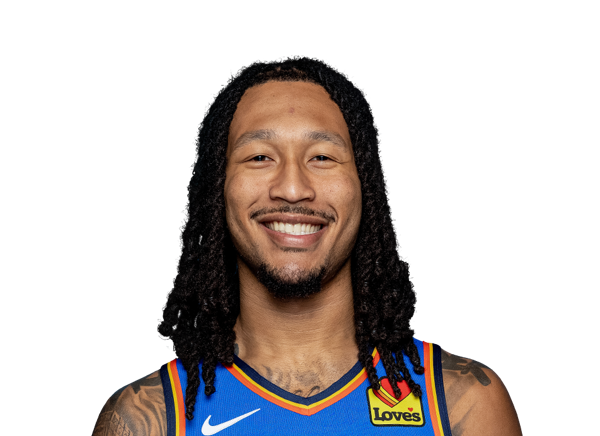
Jaylin Williams
#23

Brooks Barnhizer
Guard
#13
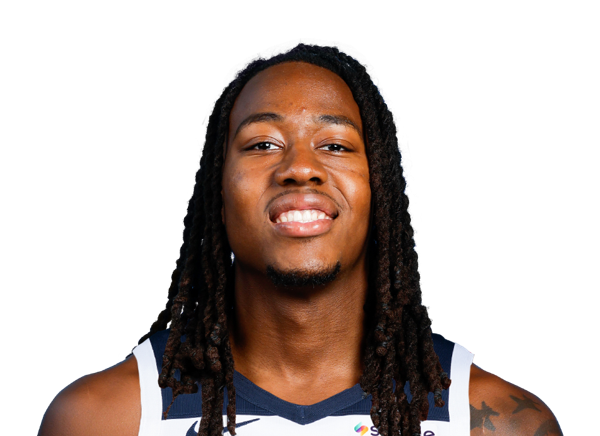
Ayo Dosunmu
#1
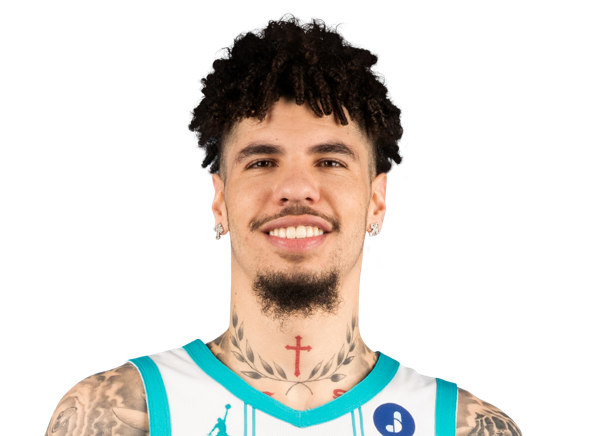
LaMelo Ball
#4

Terrence Shannon Jr.
#8

Bones Hyland
#7
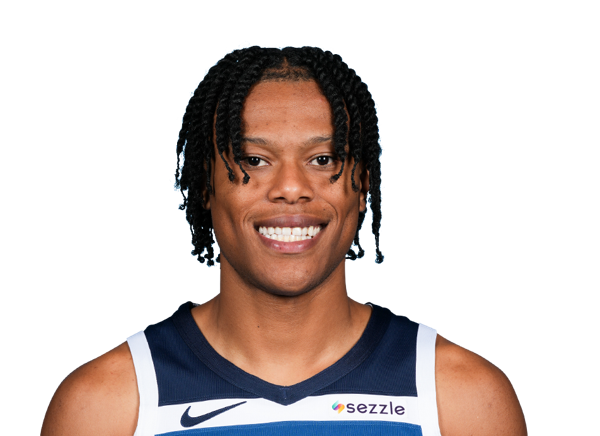
Jaylen Clark
#5

Anthony Edwards
#15
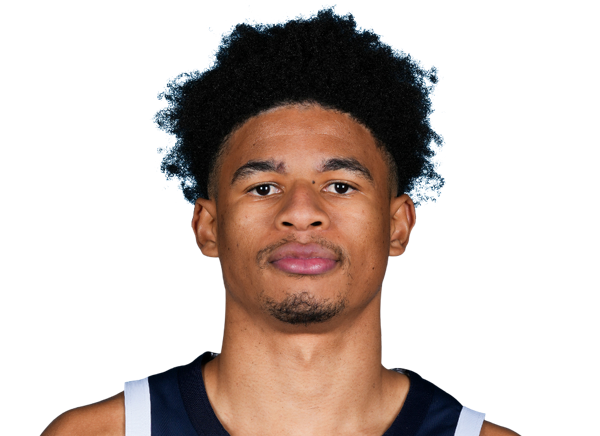
Zyon Pullin

Donte DiVincenzo
Forward
#3

Jaden McDaniels
#24

Jonathan Kuminga
#41
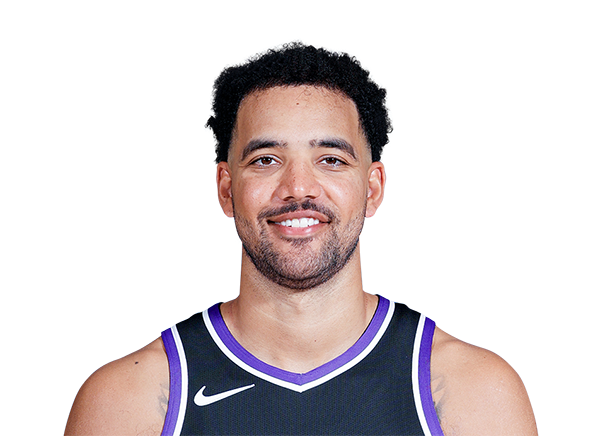
Trey Lyles
#19
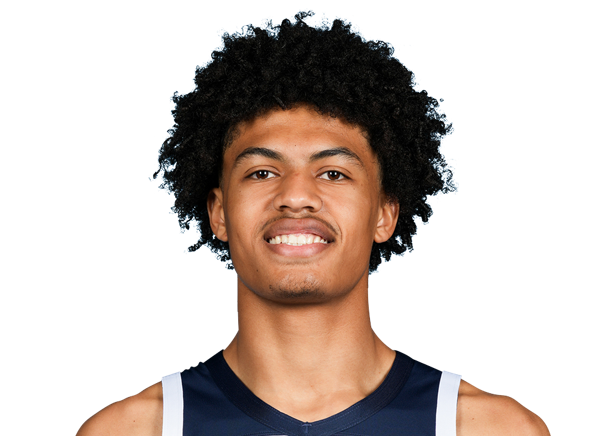
Joan Beringer
#33

Isaiah Evans
#9
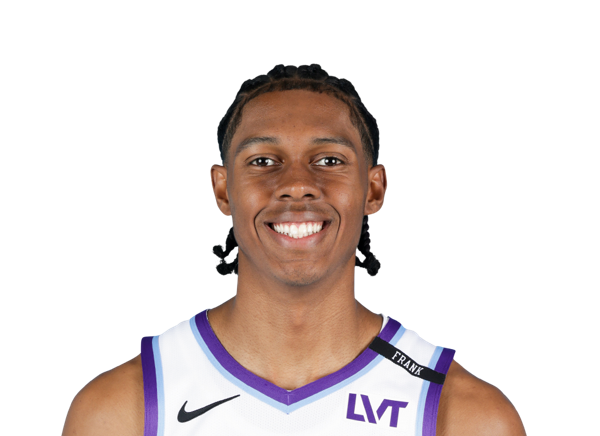
Cody Williams
Center
#27
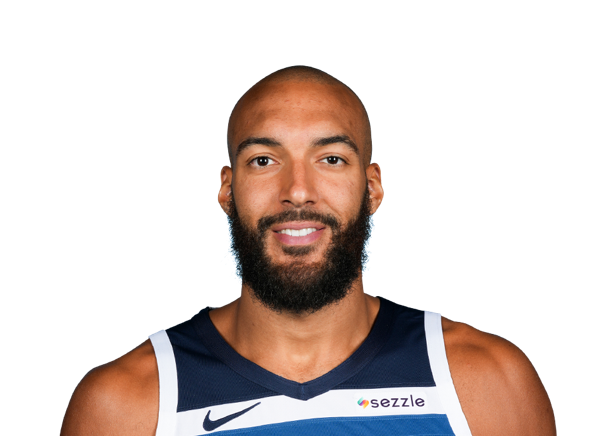
Rudy Gobert
#44

Rocco Zikarsky
Team Statistics
Thunder
6th in Western Conference Division
VS
Timberwolves
3rd in Western Conference Division
General
45.8
Rebounds Per Game
47.5
1.9
Assist To Turnover Ratio
1.6
19.1
Fouls Per Game
21.2
16
Games Played
17
0
Games Started
0
0
Minutes
0
0.0
Minutes Per Game
0.0
733
Rebounds
807
733
Rebounds
807
Offensive
79.3
Free Throw Percentage
69.0
34.5
3-Point Field Goal Percentage
37.2
42.3
Average Field Goals Made
41.9
90.6
Average Field Goals Attempted
88.5
11.0
Average 3-Point Field Goals Made
13.9
31.9
Average 3-Point Field Goals Attempted
37.4
17.5
Average Free Throws Made
17.1
22.1
Average Free Throws Attempted
24.8
113.0
Points Per Game
114.9
11.1
Offensive Rebounds Per Game
12.6
23.4
Assists Per Game
25.1
12.1
Turnovers Per Game
15.8
53.2
2-Point Field Goal Percentage
54.9
1.248
Scoring Efficiency
1.299
0.53
Shooting Efficiency
0.55
46.7
Field Goal Percentage
47.4
500.0
2-Point Field Goals Made
477.0
939.0
2-Point Field Goals Attempted
869.0
1808
Points
1953
178
Offensive Rebounds
214
374
Assists
426
194
Turnovers
269
676
Field Goals Made
713
1449
Field Goals Attempted
1504
280
Free Throws Made
291
353
Free Throws Attempted
422
176
3-Point Field Goals Made
236
510
3-Point Field Goals Attempted
635
34.5
3-Point Field Goal Percentage
37.2
31.3
2-Point Field Goals Made per Game
28.1
58.7
2-Point Field Goals Attempted per Game
51.1
Defensive
34.7
Defensive Rebounds Per Game
34.9
5.5
Blocks Per Game
5.3
8.1
Steals Per Game
8.6
555
Defensive Rebounds
593
130
Steals
147
88
Blocks
90