

Trail Blazers vs Nuggets Live Score (1 Feb, 2027)
Game Information
League
NBA
Season
1
Date
January 31, 2027
Tipoff
8:00 PM EST
Status
Scheduled
Team Stats
 POR
Game Comparison
DEN
-Points-
-Rebounds-
-Assists-
47Field Goal %47
-3-Point %-
-Free Throw %-
Game Leaders
PORDEN
 —#
Points
—
—#
—#
Rebounds
—
—#
—#
Assists
—
—#
Injury Report
H2H / Season Series
Last 5 Games






NBA Standings
Western Conference — Northwest
| Team | W | L | PCT | GB | STRK |
|---|---|---|---|---|---|
| Portland | 4 | 1 | .800 | - | W1 |
 Oklahoma City | 4 | 2 | .667 | 0.5 | L2 |
| Denver | 3 | 2 | .600 | 1 | W2 |
 Minnesota | 4 | 3 | .571 | 1 | L1 |
 Utah | 1 | 5 | .167 | 3.5 | L4 |
Rosters
Trail Blazers
4th in Western Conference Division
VS
Nuggets
8th in Western Conference Division
Forward
#8
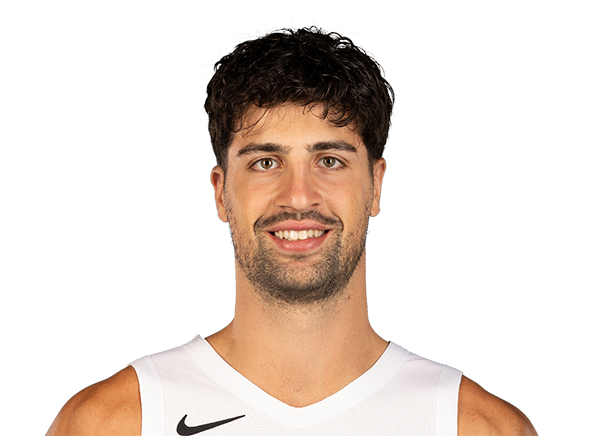
Deni Avdija
#33

Toumani Camara
#2
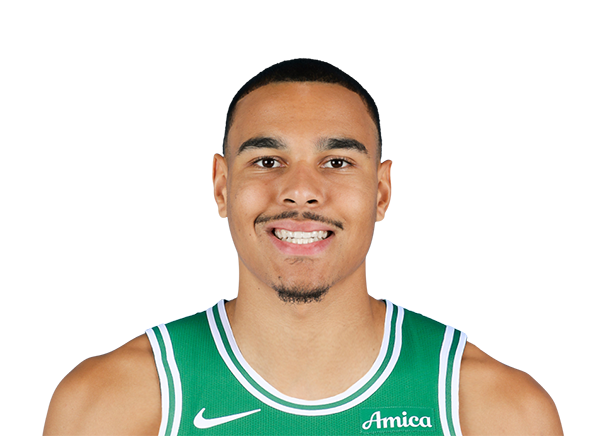
John Tonje
Guard

Damian Lillard
#5

Jrue Holiday
#00
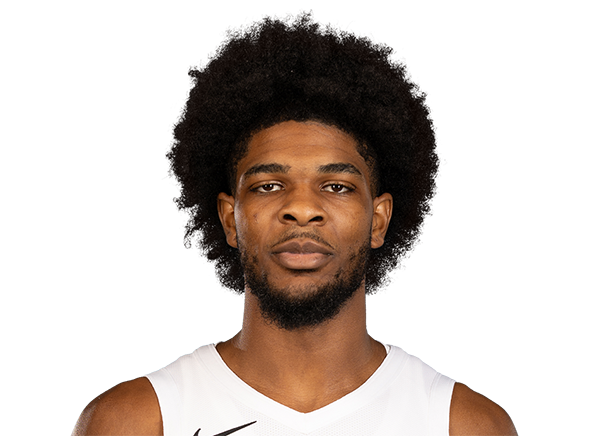
Scoot Henderson
#91

Sidy Cissoko
#1

Ja Morant
#11

Chris Youngblood
#27

Vit Krejci
#29

Jayson Kent
#17

Shaedon Sharpe
Center
#23

Donovan Clingan
#35

Robert Williams III
#16

Yang Hansen
#9

Micah Potter
#10

Branden Carlson
Guard
#27
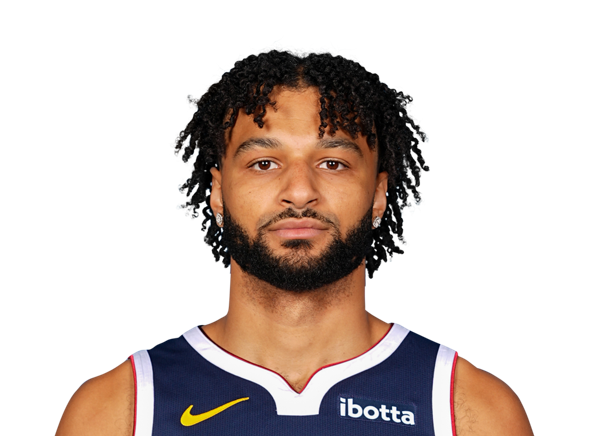
Jamal Murray

Christian Braun
#10
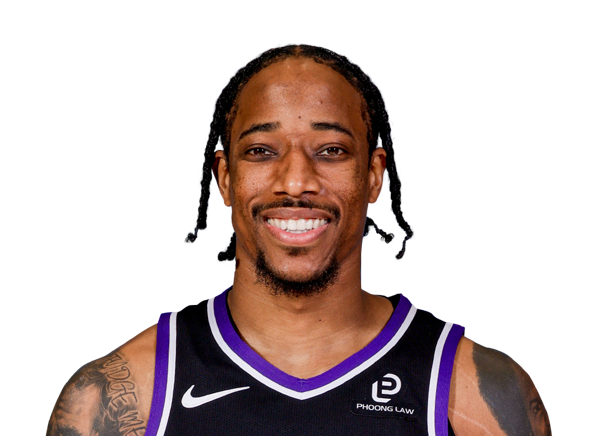
DeMar DeRozan
#5
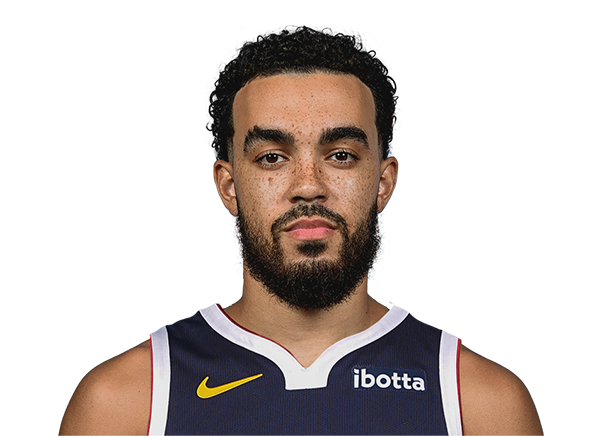
Tyus Jones
#9

Ryan Nembhard
#1
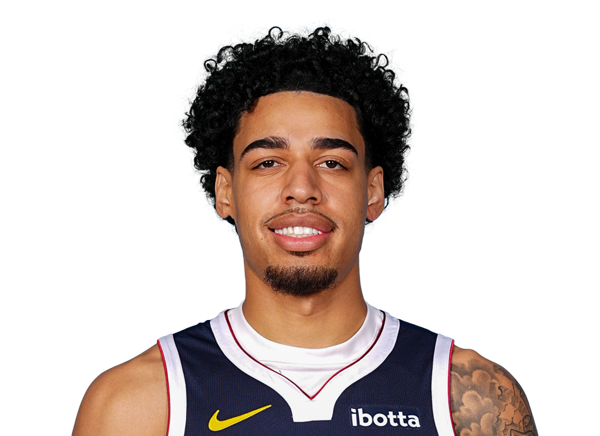
Julian Strawther
Center
#15

Nikola Jokic
Forward
#23
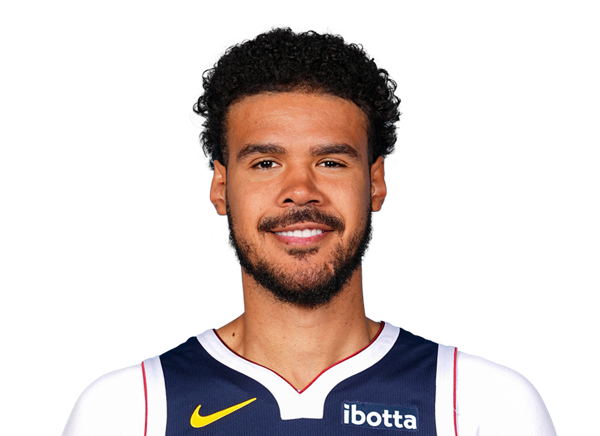
Cameron Johnson
#32

Aaron Gordon
#7
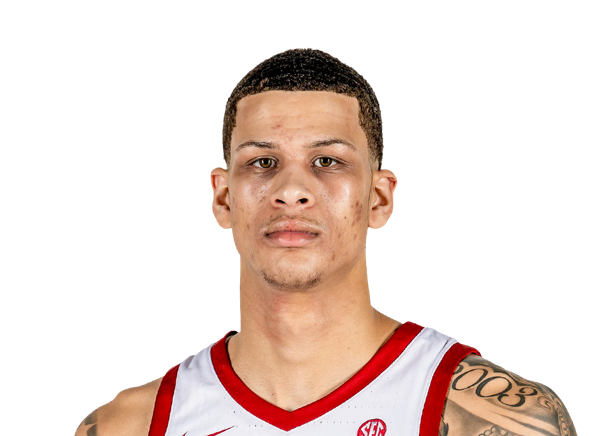
Trevon Brazile
#3

Marvin Bagley III
#13

Bryce Hopkins
#21
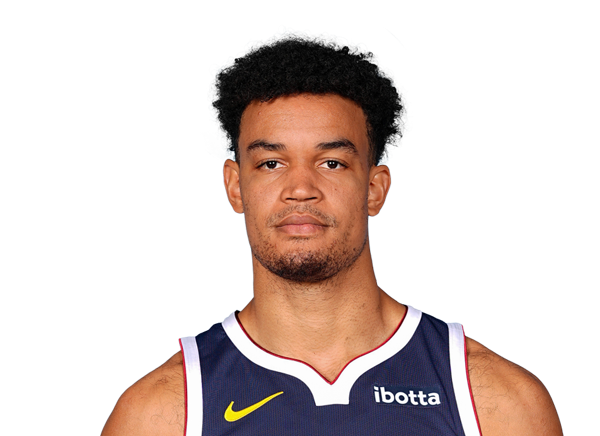
Spencer Jones
#00
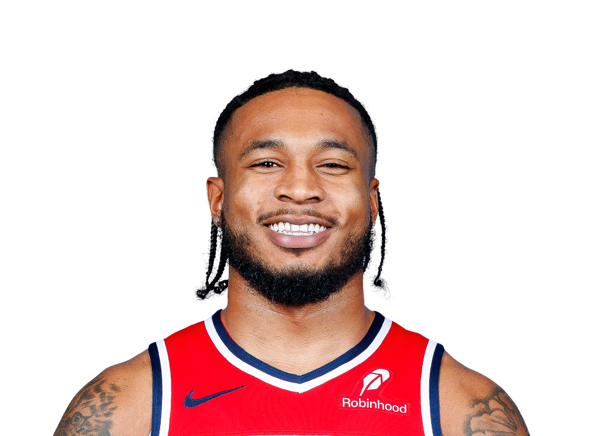
Cam Whitmore
#22

Zeke Nnaji
#11
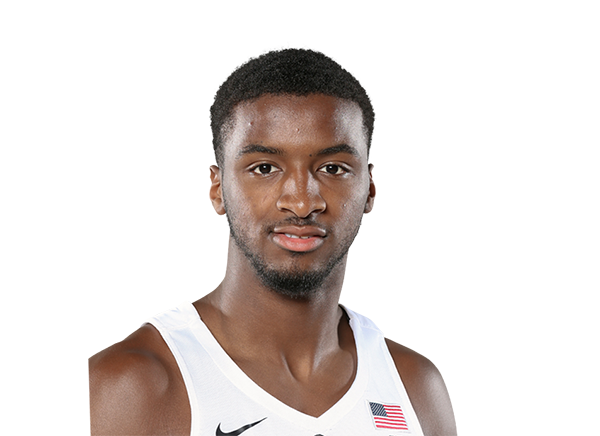
Alpha Diallo
#14

DaRon Holmes II
Team Statistics
Trail Blazers
4th in Western Conference Division
VS
Nuggets
8th in Western Conference Division
General
44.3
Rebounds Per Game
42.3
1.6
Assist To Turnover Ratio
2.2
22.3
Fouls Per Game
19.0
12
Games Played
11
0
Games Started
0
0
Minutes
0
0.0
Minutes Per Game
0.0
531
Rebounds
465
531
Rebounds
465
Offensive
78.8
Free Throw Percentage
79.0
36.5
3-Point Field Goal Percentage
34.9
39.8
Average Field Goals Made
41.5
84.7
Average Field Goals Attempted
85.2
15.9
Average 3-Point Field Goals Made
10.8
43.6
Average 3-Point Field Goals Attempted
31.0
24.2
Average Free Throws Made
20.9
30.7
Average Free Throws Attempted
26.5
119.6
Points Per Game
114.6
11.5
Offensive Rebounds Per Game
10.1
25.3
Assists Per Game
27.7
15.8
Turnovers Per Game
12.5
58.0
2-Point Field Goal Percentage
56.5
1.412
Scoring Efficiency
1.346
0.56
Shooting Efficiency
0.55
46.9
Field Goal Percentage
48.7
286.0
2-Point Field Goals Made
337.0
493.0
2-Point Field Goals Attempted
596.0
1435
Points
1261
138
Offensive Rebounds
111
304
Assists
305
189
Turnovers
137
477
Field Goals Made
456
1016
Field Goals Attempted
937
290
Free Throws Made
230
368
Free Throws Attempted
291
191
3-Point Field Goals Made
119
523
3-Point Field Goals Attempted
341
36.5
3-Point Field Goal Percentage
34.9
23.8
2-Point Field Goals Made per Game
30.6
41.1
2-Point Field Goals Attempted per Game
54.2
Defensive
32.8
Defensive Rebounds Per Game
32.2
5.1
Blocks Per Game
4.5
7.1
Steals Per Game
9.0
393
Defensive Rebounds
354
85
Steals
99
61
Blocks
50