

Warriors vs Bucks Live Score (21 Dec, 2026)
Game Information
League
NBA
Season
1
Date
December 20, 2026
Tipoff
8:00 PM EST
Status
Scheduled
Team Stats
 GS
Game Comparison
MIL
-Points-
-Rebounds-
-Assists-
45Field Goal %43
-3-Point %-
-Free Throw %-
Game Leaders
GSMIL
 —#
Points
—
—#
—#
Rebounds
—
—#
—#
Assists
—
—#
Injury Report
Golden State Warriors
H2H / Season Series
Last 5 Games









NBA Standings
Western Conference — Pacific
| Team | W | L | PCT | GB | STRK |
|---|---|---|---|---|---|
 LA Lakers | 13 | 3 | .813 | - | L1 |
| Golden State | 8 | 8 | .500 | 5 | L5 |
 Phoenix | 7 | 7 | .500 | 5 | W2 |
 LA Clippers | 4 | 10 | .286 | 8 | L2 |
 Sacramento | 1 | 13 | .071 | 11 | L7 |




Rosters
Warriors
3rd in Pacific Division
VS
Bucks
5th in Central Division
Guard
#30

Stephen Curry
#2
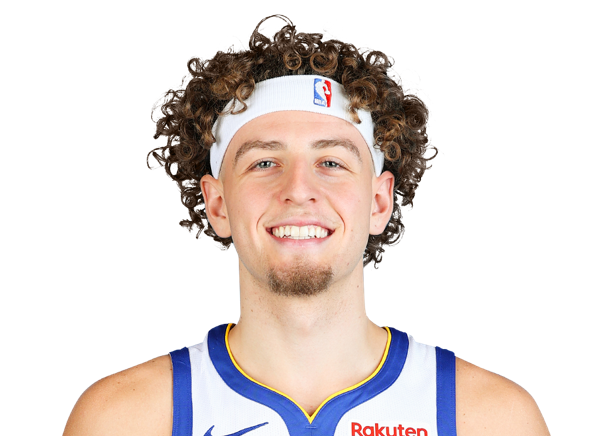
Brandin Podziemski
#12
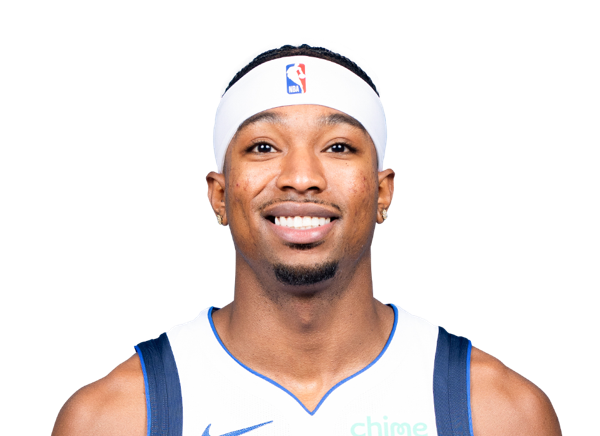
Brandon Williams
#8
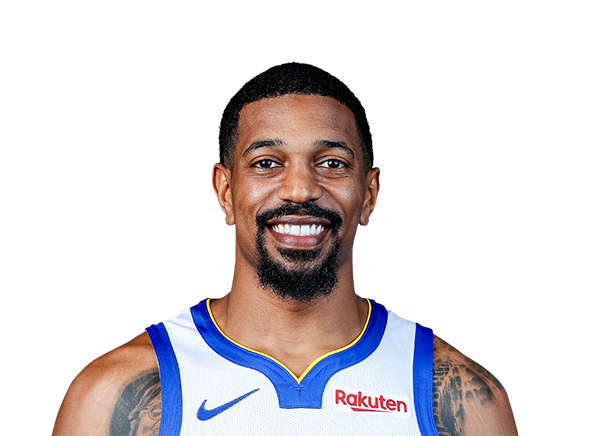
De'Anthony Melton
#3

Will Richard
#18

LJ Cryer
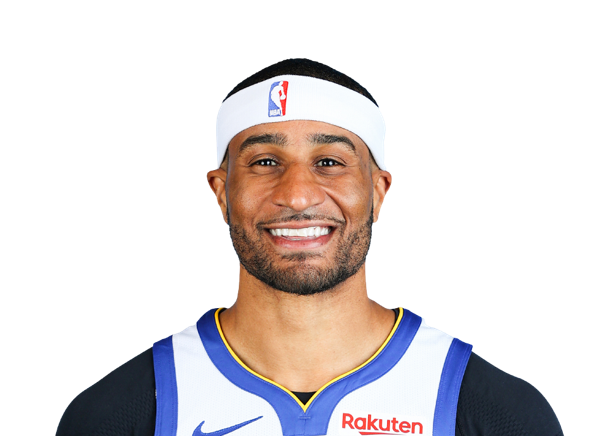
Gary Payton II
#4
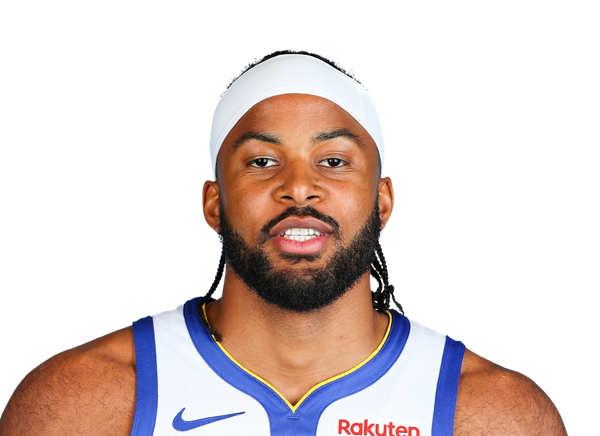
Moses Moody
Forward
#1

Yaxel Lendeborg
#32
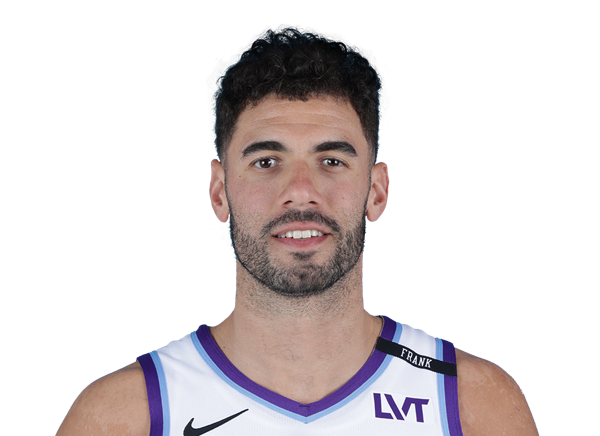
Georges Niang
#15
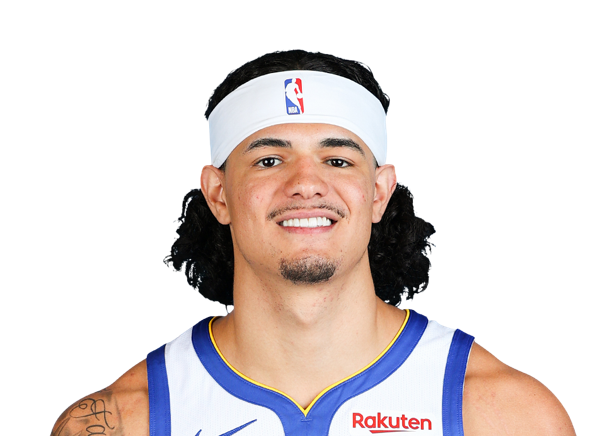
Gui Santos
#45
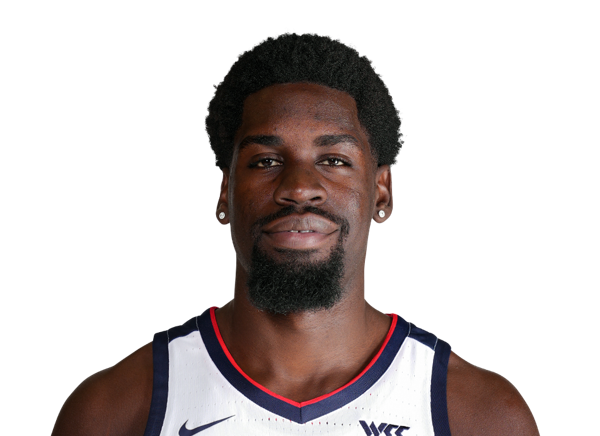
Graham Ike
#23
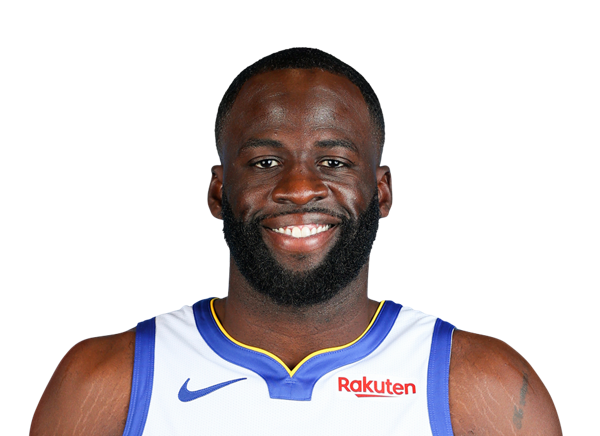
Draymond Green
#33

Malevy Leons
#10
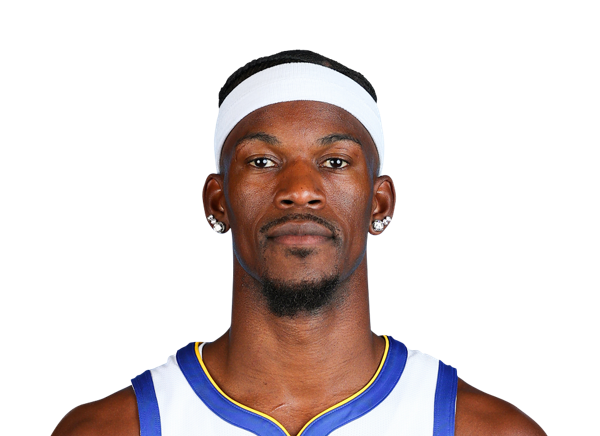
Jimmy Butler III
Center
#28

Charles Bassey
#20
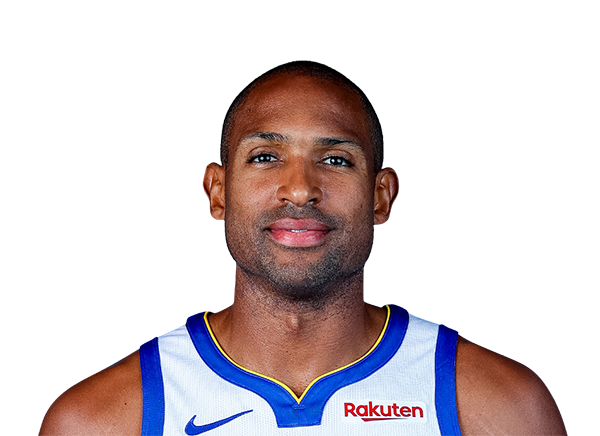
Al Horford
#7
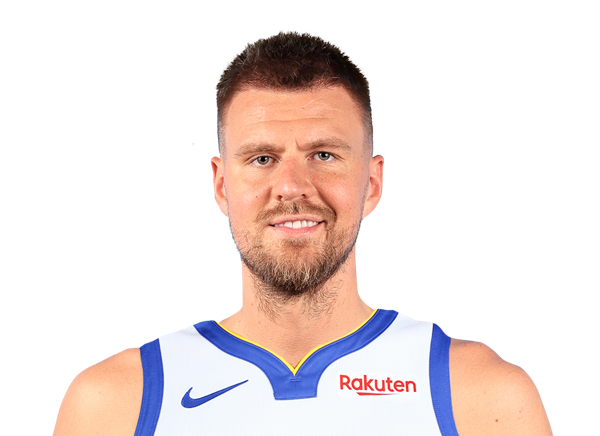
Kristaps Porzingis
Guard
#11

Tyler Herro
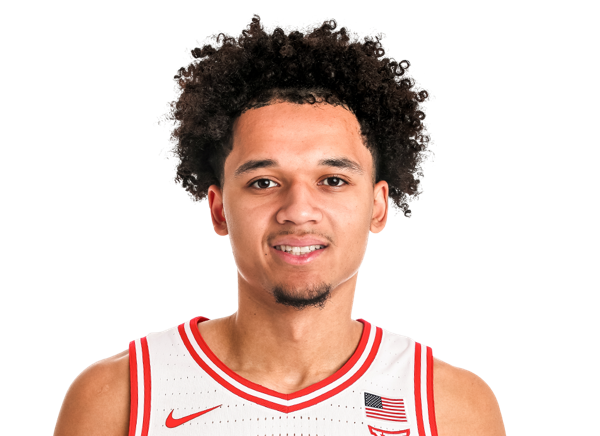
Brayden Burries
#13

Ryan Rollins
#25

Kasparas Jakucionis
#20

AJ Green
#5
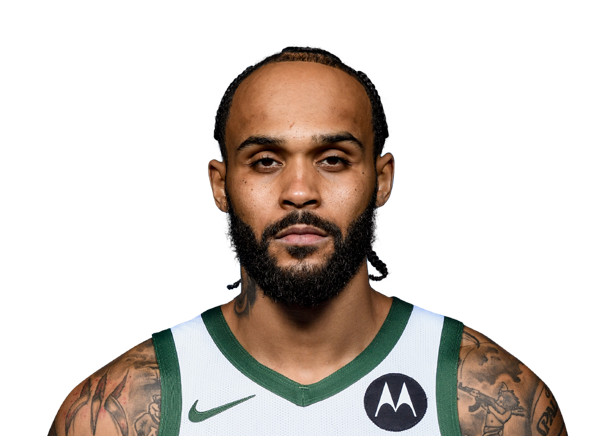
Gary Trent Jr.
#12

Caris LeVert
Forward
#24

Jaime Jaquez Jr.
#18

Kyle Kuzma
#15
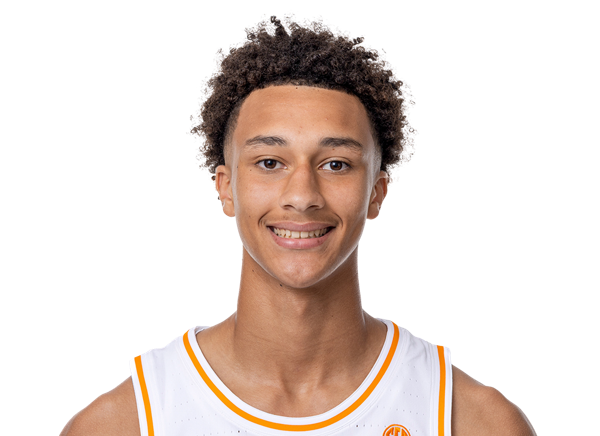
Nate Ament
#35

Pete Nance
#21

Ousmane Dieng
#23

Bogoljub Markovic
Center
#9
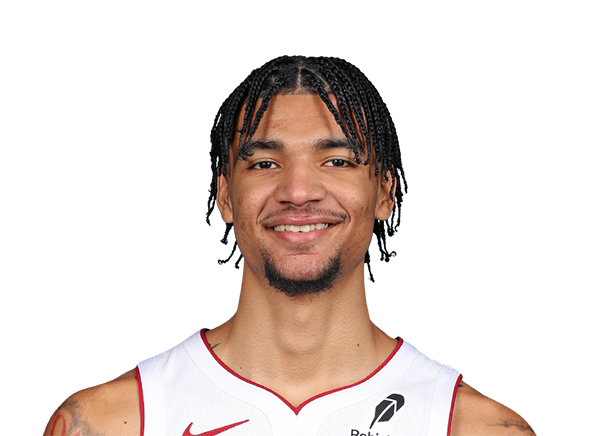
Kel'el Ware
#3

Myles Turner
#00

Jericho Sims
Team Statistics
Warriors
3rd in Pacific Division
VS
Bucks
5th in Central Division
General
44.1
Rebounds Per Game
44.7
1.7
Assist To Turnover Ratio
1.6
21.9
Fouls Per Game
23.5
16
Games Played
17
0
Games Started
0
0
Minutes
0
0.0
Minutes Per Game
0.0
705
Rebounds
760
705
Rebounds
760
Offensive
80.7
Free Throw Percentage
75.2
36.4
3-Point Field Goal Percentage
34.5
38.7
Average Field Goals Made
38.8
86.5
Average Field Goals Attempted
89.5
14.9
Average 3-Point Field Goals Made
15.1
40.9
Average 3-Point Field Goals Attempted
43.6
20.4
Average Free Throws Made
16.8
25.3
Average Free Throws Attempted
22.3
112.7
Points Per Game
109.4
12.9
Offensive Rebounds Per Game
13.5
27.1
Assists Per Game
24.6
15.8
Turnovers Per Game
15.6
52.2
2-Point Field Goal Percentage
51.7
1.303
Scoring Efficiency
1.221
0.53
Shooting Efficiency
0.52
44.7
Field Goal Percentage
43.3
381.0
2-Point Field Goals Made
403.0
730.0
2-Point Field Goals Attempted
780.0
1803
Points
1859
207
Offensive Rebounds
230
433
Assists
418
253
Turnovers
265
619
Field Goals Made
659
1384
Field Goals Attempted
1522
327
Free Throws Made
285
405
Free Throws Attempted
379
238
3-Point Field Goals Made
256
654
3-Point Field Goals Attempted
742
36.4
3-Point Field Goal Percentage
34.5
23.8
2-Point Field Goals Made per Game
23.7
45.6
2-Point Field Goals Attempted per Game
45.9
Defensive
31.1
Defensive Rebounds Per Game
31.2
5.7
Blocks Per Game
4.6
8.5
Steals Per Game
7.2
498
Defensive Rebounds
530
136
Steals
123
91
Blocks
78