

Warriors vs Cavaliers Live Score (13 Dec, 2026)
Game Information
League
NBA
Season
1
Date
December 12, 2026
Tipoff
8:00 PM EST
Status
Scheduled
Team Stats
 GS
Game Comparison
CLE
-Points-
-Rebounds-
-Assists-
45Field Goal %47
-3-Point %-
-Free Throw %-
Game Leaders
GSCLE
 —#
Points
—
—#
—#
Rebounds
—
—#
—#
Assists
—
—#
Injury Report
Golden State Warriors
H2H / Season Series
Last 5 Games








NBA Standings
Western Conference — Pacific
| Team | W | L | PCT | GB | STRK |
|---|---|---|---|---|---|
 LA Lakers | 13 | 3 | .813 | - | L1 |
| Golden State | 8 | 8 | .500 | 5 | L5 |
 Phoenix | 7 | 7 | .500 | 5 | W2 |
 LA Clippers | 4 | 10 | .286 | 8 | L2 |
 Sacramento | 1 | 13 | .071 | 11 | L7 |



Rosters
Warriors
3rd in Pacific Division
VS
Cavaliers
2nd in Central Division
Guard
#30

Stephen Curry
#2
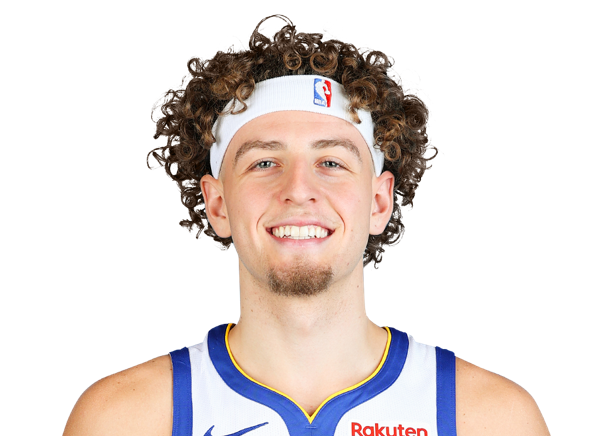
Brandin Podziemski
#12
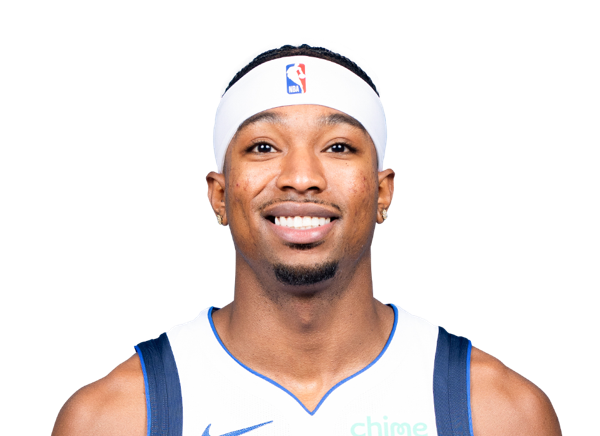
Brandon Williams
#8
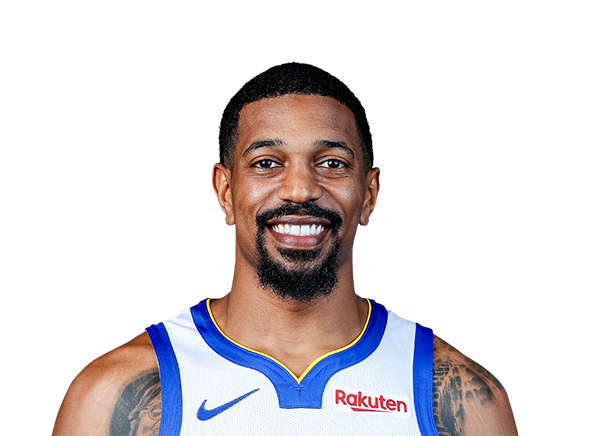
De'Anthony Melton
#3

Will Richard
#18

LJ Cryer
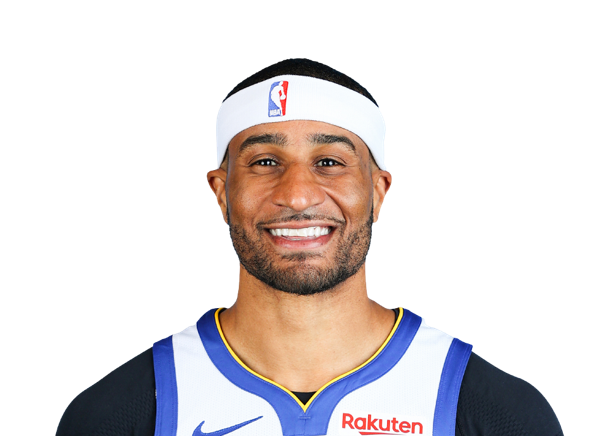
Gary Payton II
#4
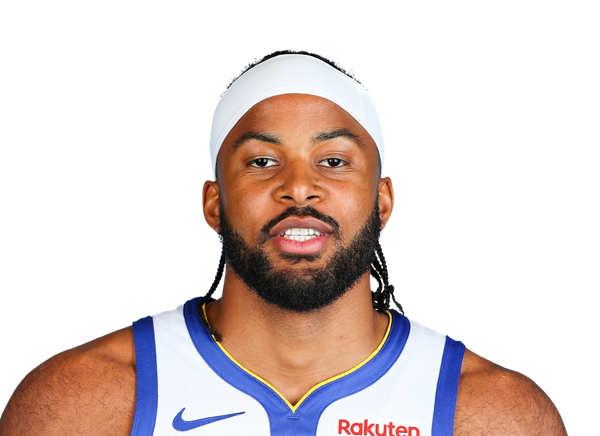
Moses Moody
Forward
#1

Yaxel Lendeborg
#32
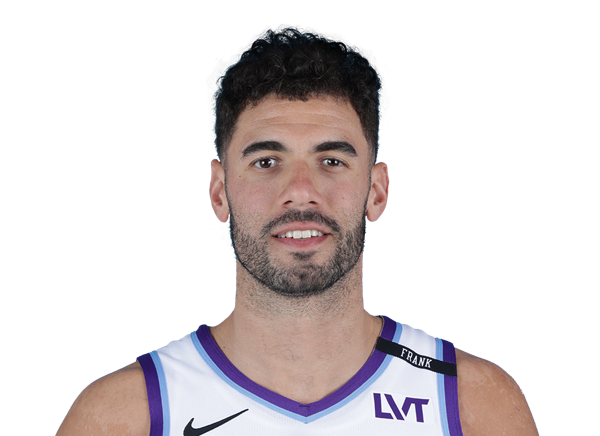
Georges Niang
#15
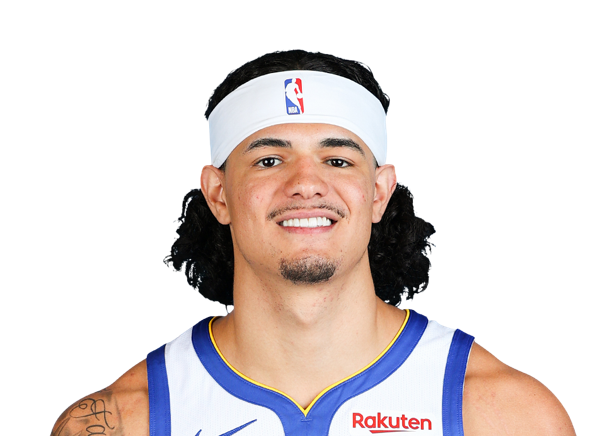
Gui Santos
#45
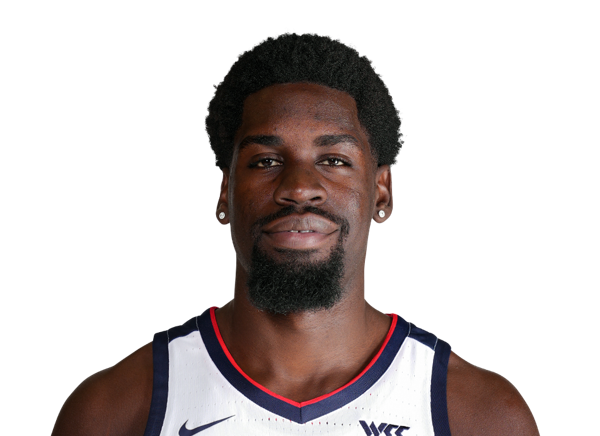
Graham Ike
#23
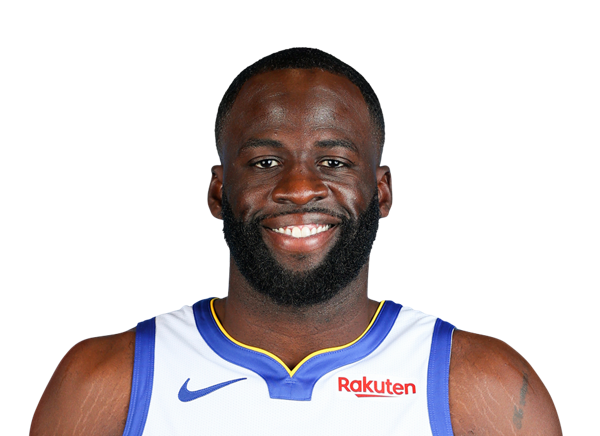
Draymond Green
#33

Malevy Leons
#10
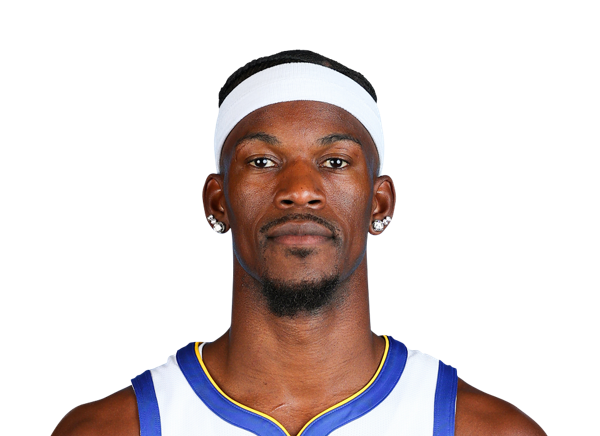
Jimmy Butler III
Center
#28

Charles Bassey
#20
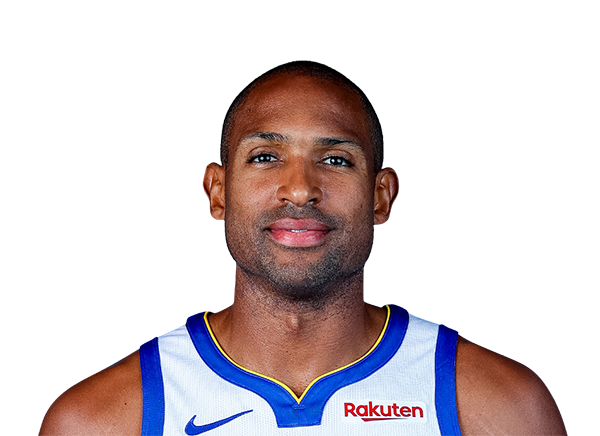
Al Horford
#7
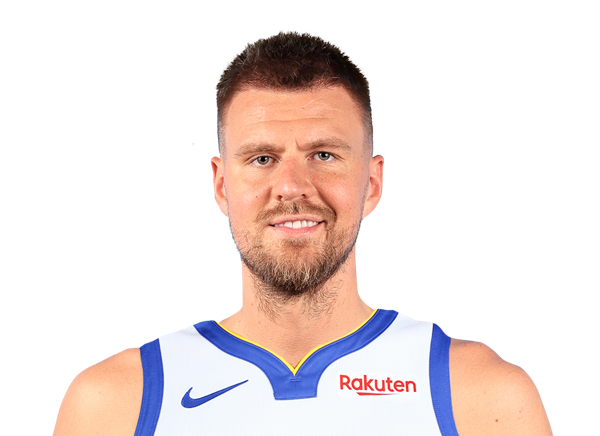
Kristaps Porzingis
Guard
#45
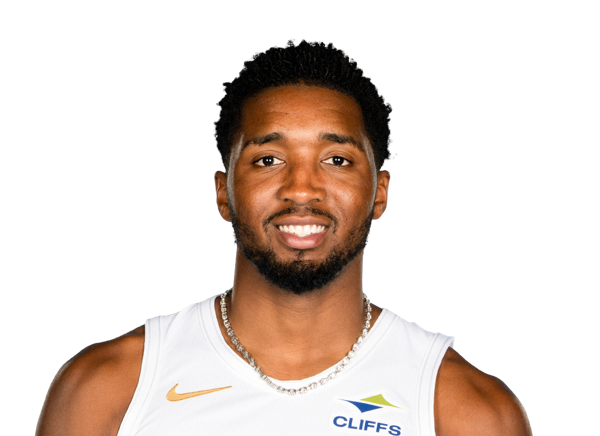
Donovan Mitchell
#1
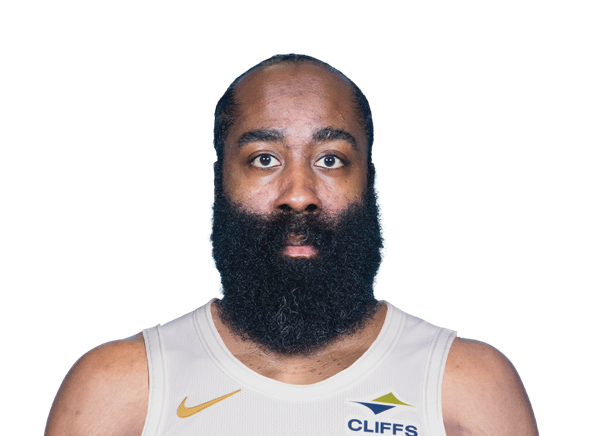
James Harden
#15

Meleek Thomas
#8

Peyton Watson
#24
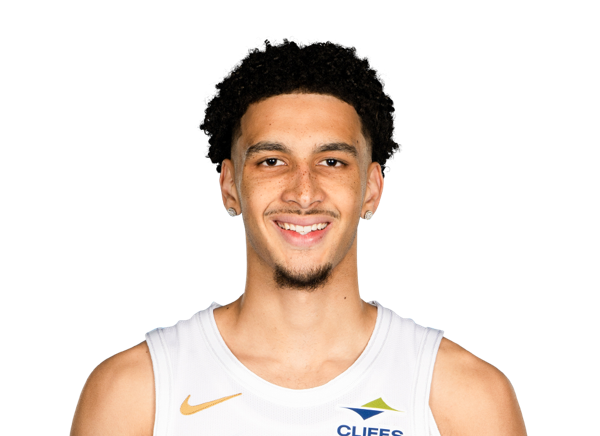
Tyrese Proctor
#5

Sam Merrill
#9
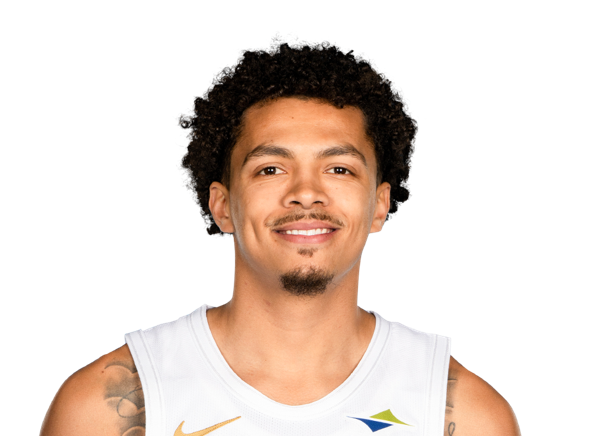
Craig Porter Jr.
#20

Jaylon Tyson
Center
#4
Evan Mobley
#31

Jarrett Allen
#3

Thomas Bryant
#77

Norchad Omier
Forward
#33

Mario Hezonja
#12

Riley Minix
#21

Tristan Enaruna
#35

Nae'Qwan Tomlin
Team Statistics
Warriors
3rd in Pacific Division
VS
Cavaliers
2nd in Central Division
General
44.1
Rebounds Per Game
45.6
1.7
Assist To Turnover Ratio
2.1
21.9
Fouls Per Game
21.9
16
Games Played
17
0
Games Started
0
0
Minutes
0
0.0
Minutes Per Game
0.0
705
Rebounds
775
705
Rebounds
775
Offensive
80.7
Free Throw Percentage
76.8
36.4
3-Point Field Goal Percentage
37.1
38.7
Average Field Goals Made
42.7
86.5
Average Field Goals Attempted
89.9
14.9
Average 3-Point Field Goals Made
15.3
40.9
Average 3-Point Field Goals Attempted
41.2
20.4
Average Free Throws Made
18.1
25.3
Average Free Throws Attempted
23.6
112.7
Points Per Game
118.8
12.9
Offensive Rebounds Per Game
11.2
27.1
Assists Per Game
27.4
15.8
Turnovers Per Game
13.2
52.2
2-Point Field Goal Percentage
56.3
1.303
Scoring Efficiency
1.321
0.53
Shooting Efficiency
0.56
44.7
Field Goal Percentage
47.5
381.0
2-Point Field Goals Made
466.0
730.0
2-Point Field Goals Attempted
828.0
1803
Points
2020
207
Offensive Rebounds
190
433
Assists
466
253
Turnovers
224
619
Field Goals Made
726
1384
Field Goals Attempted
1529
327
Free Throws Made
308
405
Free Throws Attempted
401
238
3-Point Field Goals Made
260
654
3-Point Field Goals Attempted
701
36.4
3-Point Field Goal Percentage
37.1
23.8
2-Point Field Goals Made per Game
27.4
45.6
2-Point Field Goals Attempted per Game
48.7
Defensive
31.1
Defensive Rebounds Per Game
34.4
5.7
Blocks Per Game
5.1
8.5
Steals Per Game
7.6
498
Defensive Rebounds
585
136
Steals
129
91
Blocks
86