

Bruins vs Capitals Live Score (10 Apr, 2022)
Score by Period
| Team | 1st | 2nd | 3rd | Total |
|---|---|---|---|---|
 BOS | 0 | 2 | 0 | 2 |
 WSH | 0 | 2 | 2 | 4 |
Play-by-Play
3rd Period 20:00
2–4
3rd Period 20:00
2–4
3rd Period 19:58
2–4
3rd Period 19:58
2–4
3rd Period 19:53
2–3
3rd Period 19:40
2–3
3rd Period 18:48
2–3
3rd Period 18:40
2–3
3rd Period 18:40
2–3
3rd Period 18:27
2–3
3rd Period 18:14
2–3
3rd Period 18:06
2–3
3rd Period 18:06
2–3
3rd Period 17:52
2–3
3rd Period 17:46
2–3
3rd Period 17:46
2–3
3rd Period 17:45
2–3
3rd Period 17:06
2–3
3rd Period 16:54
2–3
3rd Period 16:12
2–3
3rd Period 16:11
2–3
3rd Period 15:43
2–3
3rd Period 15:37
2–3
3rd Period 15:18
2–3
Scoring Summary
2nd Period
4:11
John Carlson
Assists: Conor Sheary
0 - 1
7:55
Curtis Lazar
Assists: Nick Foligno
1 - 1
8:55
Erik Haula
Assists: Charlie McAvoy
2 - 1
14:50
Tom Wilson
Assists: Lars Eller, Anthony Mantha
2 - 2
3rd Period
7:18
Lars Eller
Assists: Nick Jensen
2 - 3
19:58
Alex Ovechkin
Assists: Evgeny Kuznetsov, John Carlson
2 - 4
Team Stats
BOS
WSH

9
Blocked Shots
25
39
Hits
45
4
Takeaways
10
5
Giveaways
6
0
Power Play Goals
0
4
Power Play Opportunities
2
30
Total Shots
33
4
Penalty Minutes
8
0.0
Power Play %
0.0
0
Short Handed Goals
0
0
Shootout Goals
0
43
Faceoffs Won
28
60.6
Faceoff Percent
39.4
2
Penalties
4
Game Leaders
BOS
WSH
Player Box Score
Bruins| Player | BS | HT | TK | +/- | TOI | PPTOI | SHTOI | ESTOI | SHFT | G | YTDG | A | S | SM | SOG | FW | FL | FO% | GV | PN | PIM |
|---|---|---|---|---|---|---|---|---|---|---|---|---|---|---|---|---|---|---|---|---|---|
 Patrice Bergeron#37 · C | 1 | 1 | 0 | -1 | 20:30 | 6:06 | 0:55 | 13:29 | 22 | 0 | 19 | 0 | 1 | 2 | 0 | 19 | 7 | 73.1 | 0 | 0 | 0 |
 Charlie Coyle#13 · C | 0 | 0 | 0 | -1 | 19:01 | 6:09 | 1:48 | 11:04 | 20 | 0 | 16 | 0 | 2 | 2 | 0 | 7 | 6 | 53.8 | 0 | 0 | 0 |
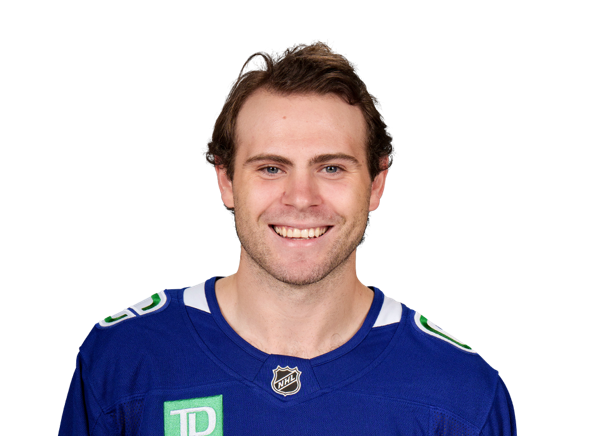 Jake DeBrusk#74 · LW | 0 | 0 | 2 | -2 | 21:23 | 1:49 | 1:46 | 17:48 | 22 | 0 | 22 | 0 | 1 | 1 | 0 | 1 | 0 | 100.0 | 2 | 0 | 0 |
 Nick Foligno#17 · LW | 0 | 3 | 0 | 0 | 9:50 | 0:09 | 0:00 | 9:41 | 16 | 0 | 2 | 1 | 0 | 0 | 0 | 1 | 0 | 100.0 | 0 | 0 | 0 |
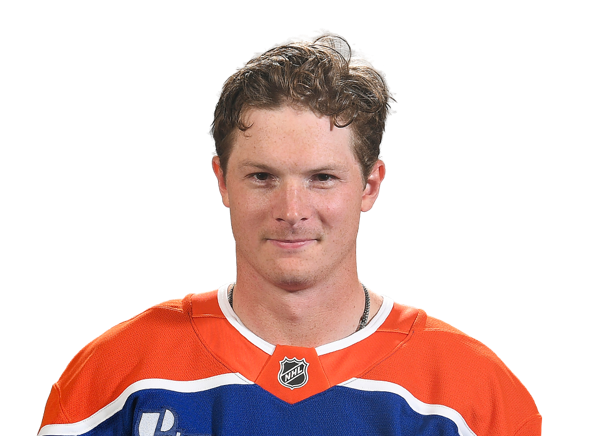 Trent Frederic#11 · C | 1 | 2 | 1 | 0 | 10:13 | 0:31 | 0:00 | 9:42 | 17 | 0 | 5 | 0 | 1 | 1 | 0 | 0 | 1 | 0.0 | 0 | 1 | 2 |
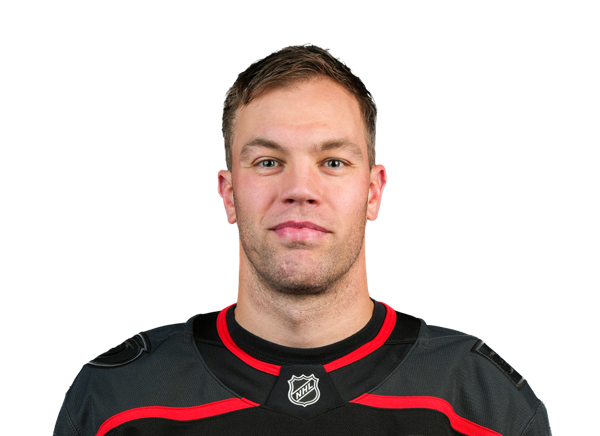 Taylor Hall#71 · LW | 1 | 2 | 0 | -1 | 19:40 | 6:14 | 0:00 | 13:26 | 19 | 0 | 16 | 0 | 2 | 2 | 0 | 1 | 0 | 100.0 | 0 | 1 | 2 |
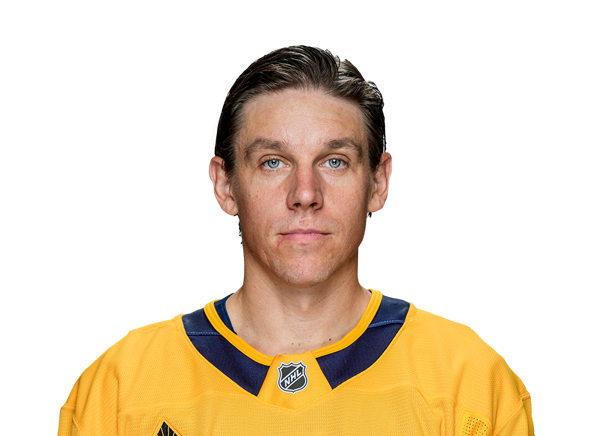 Erik Haula#56 · LW | 1 | 2 | 0 | 0 | 16:27 | 1:26 | 0:01 | 15:00 | 19 | 1 | 14 | 0 | 4 | 0 | 0 | 7 | 7 | 50.0 | 0 | 0 | 0 |
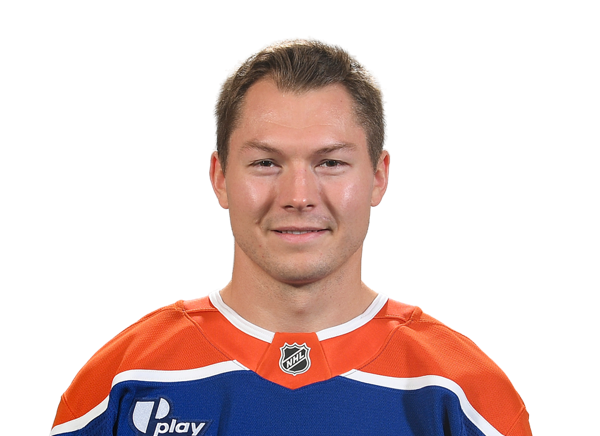 Curtis Lazar#20 · C | 0 | 6 | 1 | 0 | 10:58 | 0:00 | 1:14 | 9:44 | 15 | 1 | 8 | 0 | 3 | 0 | 0 | 1 | 2 | 33.3 | 0 | 0 | 0 |
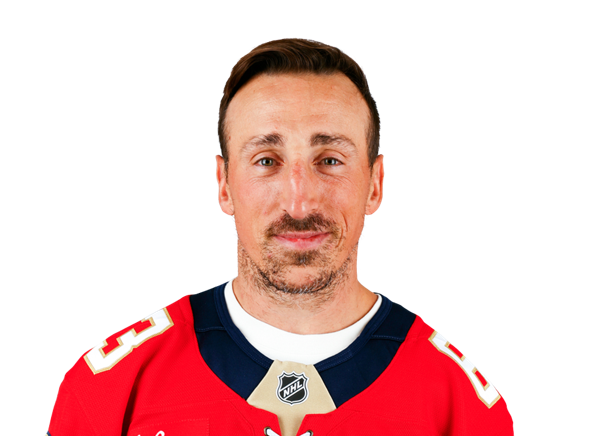 Brad Marchand#63 · LW | 0 | 3 | 0 | -2 | 23:15 | 6:38 | 0:56 | 15:41 | 22 | 0 | 31 | 0 | 5 | 2 | 0 | 0 | 1 | 0.0 | 0 | 0 | 0 |
 Marc McLaughlin#26 · C | 0 | 4 | 0 | 0 | 10:54 | 0:33 | 0:00 | 10:21 | 16 | 0 | 1 | 0 | 1 | 0 | 0 | 0 | 0 | 0.0 | 0 | 0 | 0 |
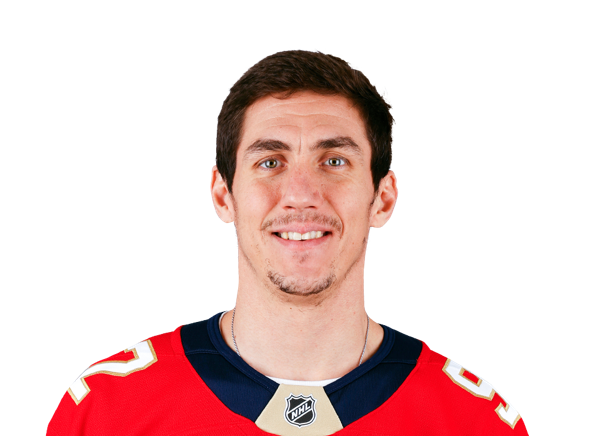 Tomas Nosek#92 · LW | 1 | 1 | 0 | 0 | 11:20 | 0:00 | 1:15 | 10:05 | 16 | 0 | 3 | 0 | 3 | 1 | 0 | 6 | 4 | 60.0 | 0 | 0 | 0 |
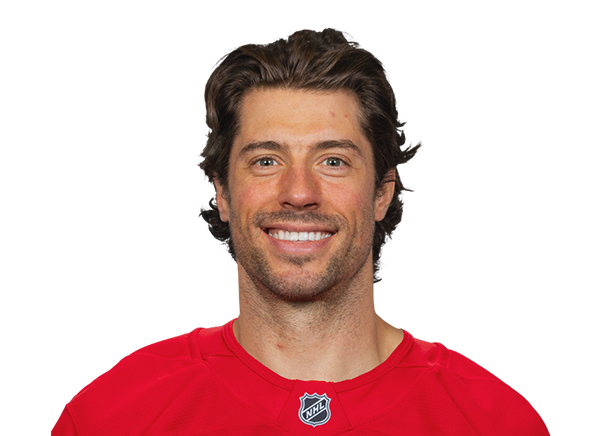 Craig Smith#12 · C | 0 | 0 | 0 | -1 | 13:59 | 1:53 | 0:03 | 12:03 | 21 | 0 | 16 | 0 | 1 | 1 | 0 | 0 | 0 | 0.0 | 0 | 0 | 0 |
Capitals| Player | BS | HT | TK | +/- | TOI | PPTOI | SHTOI | ESTOI | SHFT | G | YTDG | A | S | SM | SOG | FW | FL | FO% | GV | PN | PIM |
|---|---|---|---|---|---|---|---|---|---|---|---|---|---|---|---|---|---|---|---|---|---|
 Nic Dowd#26 · C | 3 | 5 | 1 | 0 | 14:17 | 0:00 | 1:40 | 12:37 | 23 | 0 | 8 | 0 | 1 | 0 | 0 | 8 | 7 | 53.3 | 0 | 1 | 2 |
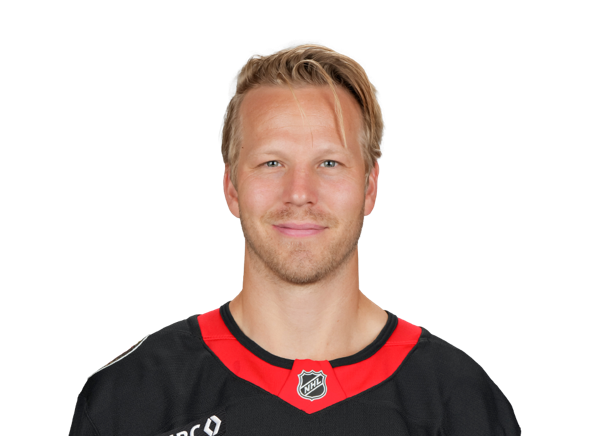 Lars Eller#20 · C | 1 | 2 | 0 | 2 | 13:03 | 0:00 | 2:19 | 10:44 | 18 | 1 | 10 | 1 | 3 | 1 | 0 | 6 | 11 | 35.3 | 0 | 1 | 2 |
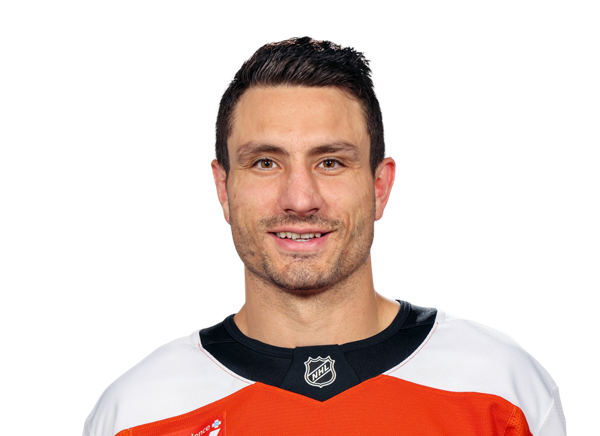 Garnet Hathaway#21 · RW | 2 | 5 | 0 | 0 | 14:41 | 0:00 | 3:11 | 11:30 | 20 | 0 | 11 | 0 | 1 | 0 | 0 | 0 | 0 | 0.0 | 0 | 0 | 0 |
 Marcus Johansson#90 · LW | 1 | 3 | 0 | -1 | 13:55 | 2:18 | 0:00 | 11:37 | 14 | 0 | 7 | 0 | 2 | 2 | 0 | 0 | 0 | 0.0 | 1 | 0 | 0 |
 Evgeny Kuznetsov#92 · C | 1 | 1 | 3 | 1 | 21:01 | 3:07 | 2:57 | 14:57 | 24 | 0 | 23 | 1 | 5 | 0 | 0 | 8 | 12 | 40.0 | 1 | 0 | 0 |
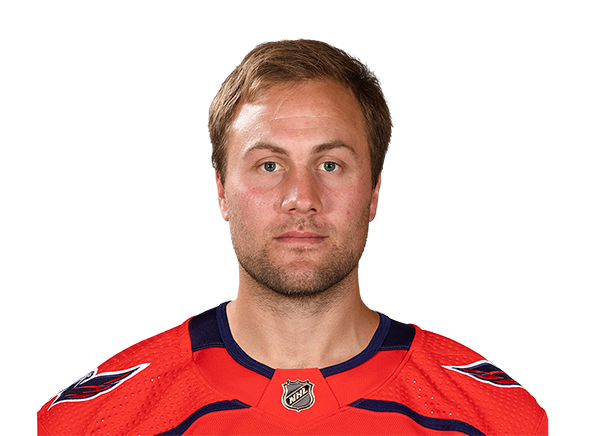 Johan Larsson#22 · LW | 0 | 1 | 2 | 0 | 12:27 | 0:00 | 1:05 | 11:22 | 18 | 0 | 6 | 0 | 0 | 1 | 0 | 0 | 2 | 0.0 | 0 | 0 | 0 |
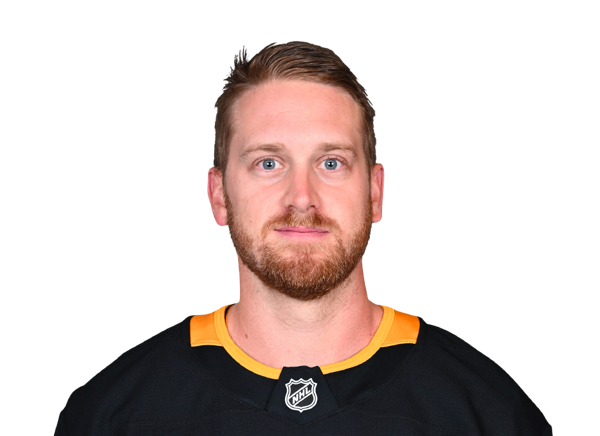 Anthony Mantha#39 · RW | 0 | 0 | 1 | 2 | 10:40 | 0:55 | 0:00 | 9:45 | 14 | 0 | 7 | 1 | 0 | 0 | 0 | 0 | 0 | 0.0 | 0 | 0 | 0 |
 Connor McMichael#24 · C | 1 | 2 | 0 | -1 | 10:14 | 0:00 | 0:00 | 10:14 | 14 | 0 | 9 | 0 | 1 | 1 | 0 | 6 | 8 | 42.9 | 0 | 0 | 0 |
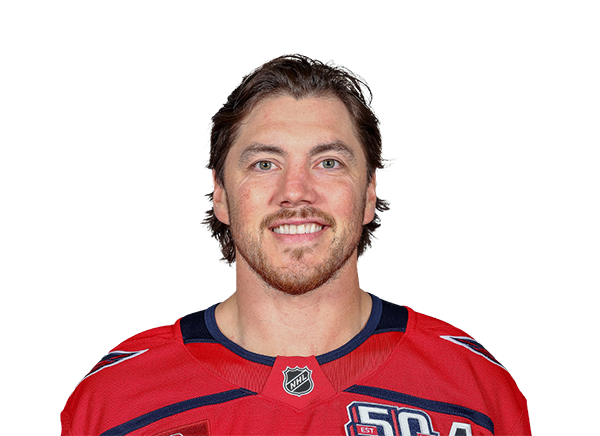 T.J. Oshie#77 · RW | 0 | 4 | 0 | -1 | 15:18 | 1:51 | 1:38 | 11:49 | 19 | 0 | 8 | 0 | 0 | 0 | 0 | 0 | 2 | 0.0 | 0 | 0 | 0 |
 Alex Ovechkin#8 · LW | 1 | 7 | 0 | 1 | 19:46 | 3:58 | 0:00 | 15:48 | 20 | 1 | 45 | 0 | 6 | 2 | 0 | 0 | 1 | 0.0 | 1 | 0 | 0 |
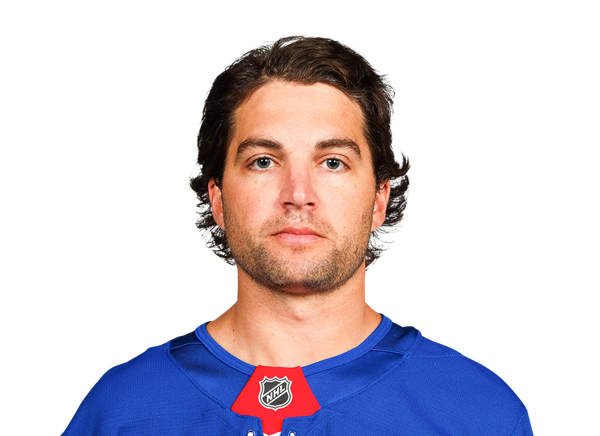 Conor Sheary#73 · LW | 2 | 0 | 1 | 0 | 16:39 | 1:40 | 0:02 | 14:57 | 20 | 0 | 16 | 1 | 3 | 0 | 0 | 0 | 0 | 0.0 | 0 | 0 | 0 |
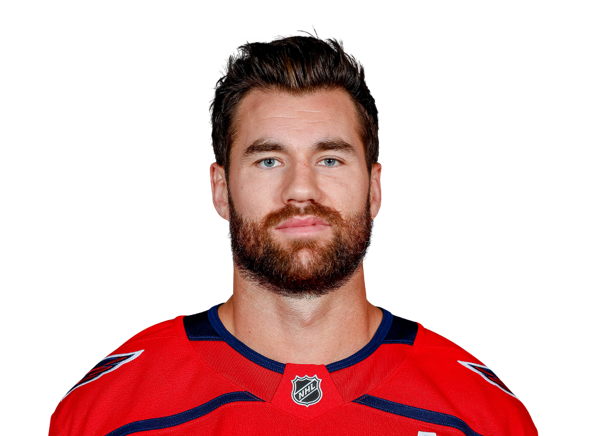 Tom Wilson#43 · RW | 1 | 3 | 0 | 3 | 15:20 | 2:09 | 3:08 | 10:03 | 22 | 1 | 23 | 0 | 2 | 1 | 0 | 0 | 0 | 0.0 | 0 | 0 | 0 |
Bruins| Player | BS | HT | TK | +/- | TOI | PPTOI | SHTOI | ESTOI | SHFT | G | YTDG | A | S | SM | SOG | FW | FL | FO% | GV | PN | PIM |
|---|---|---|---|---|---|---|---|---|---|---|---|---|---|---|---|---|---|---|---|---|---|
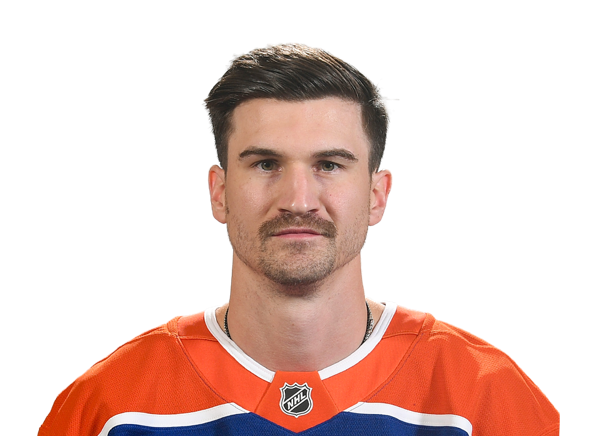 Joshua Brown#44 · D | 0 | 0 | 0 | 0 | 15:43 | 0:00 | 2:17 | 13:26 | 22 | 0 | 0 | 0 | 0 | 0 | 0 | 0 | 0 | 0.0 | 0 | 0 | 0 |
 Brandon Carlo#25 · D | 0 | 5 | 0 | -1 | 19:47 | 0:19 | 1:45 | 17:43 | 23 | 0 | 6 | 0 | 1 | 0 | 0 | 0 | 0 | 0.0 | 1 | 0 | 0 |
 Derek Forbort#28 · D | 2 | 4 | 0 | -3 | 21:03 | 0:00 | 1:53 | 19:10 | 26 | 0 | 4 | 0 | 2 | 0 | 0 | 0 | 0 | 0.0 | 0 | 0 | 0 |
 Matt Grzelcyk#48 · D | 1 | 0 | 0 | 0 | 3:11 | 0:00 | 0:00 | 3:11 | 4 | 0 | 4 | 0 | 0 | 1 | 0 | 0 | 0 | 0.0 | 0 | 0 | 0 |
 Charlie McAvoy#73 · D | 1 | 4 | 0 | 1 | 28:18 | 6:02 | 1:50 | 20:26 | 29 | 0 | 8 | 1 | 3 | 2 | 0 | 0 | 0 | 0.0 | 0 | 0 | 0 |
 Mike Reilly#6 · D | 0 | 2 | 0 | 0 | 22:20 | 2:11 | 0:17 | 19:52 | 32 | 0 | 4 | 0 | 0 | 1 | 0 | 0 | 0 | 0.0 | 0 | 0 | 0 |
Capitals| Player | BS | HT | TK | +/- | TOI | PPTOI | SHTOI | ESTOI | SHFT | G | YTDG | A | S | SM | SOG | FW | FL | FO% | GV | PN | PIM |
|---|---|---|---|---|---|---|---|---|---|---|---|---|---|---|---|---|---|---|---|---|---|
 John Carlson#74 · D | 1 | 1 | 1 | 1 | 25:02 | 2:20 | 3:14 | 19:28 | 26 | 1 | 14 | 1 | 4 | 2 | 0 | 0 | 0 | 0.0 | 0 | 0 | 0 |
 Martin Fehervary#42 · D | 1 | 4 | 1 | 0 | 21:12 | 0:00 | 3:31 | 17:41 | 23 | 0 | 7 | 0 | 1 | 1 | 0 | 0 | 0 | 0.0 | 0 | 0 | 0 |
 Nick Jensen#3 · D | 2 | 2 | 0 | 2 | 18:19 | 0:00 | 4:39 | 13:40 | 23 | 0 | 5 | 1 | 2 | 1 | 0 | 0 | 0 | 0.0 | 0 | 0 | 0 |
 Dmitry Orlov#9 · D | 1 | 1 | 0 | 2 | 18:06 | 0:02 | 1:08 | 16:56 | 20 | 0 | 11 | 0 | 1 | 1 | 0 | 0 | 0 | 0.0 | 1 | 1 | 2 |
 Justin Schultz#2 · D | 5 | 3 | 0 | -1 | 15:59 | 1:40 | 0:05 | 14:14 | 19 | 0 | 2 | 0 | 1 | 1 | 0 | 0 | 0 | 0.0 | 0 | 0 | 0 |
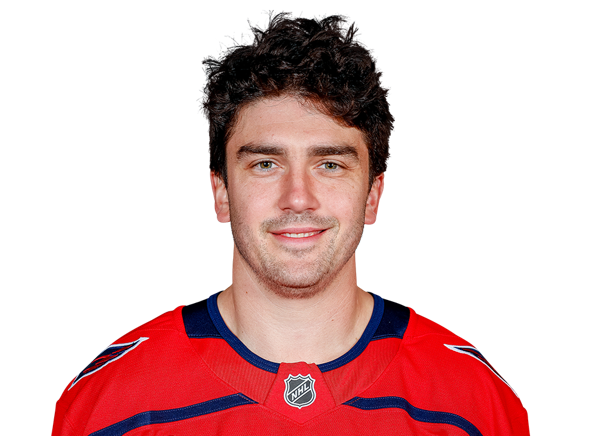 Trevor van Riemsdyk#57 · D | 2 | 1 | 0 | 0 | 16:56 | 0:00 | 3:23 | 13:33 | 22 | 0 | 1 | 0 | 0 | 0 | 0 | 0 | 0 | 0.0 | 0 | 1 | 2 |
Bruins| Player | GA | SA | SOS | SOSA | SV | SV% | ESSV | PPSV | SHSV | TOI | YTDG | PIM |
|---|---|---|---|---|---|---|---|---|---|---|---|---|
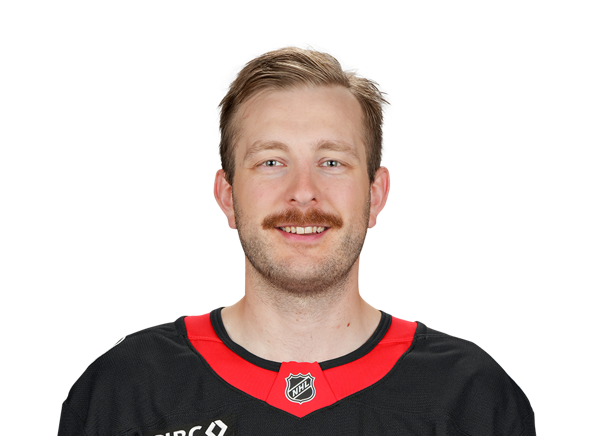 Linus Ullmark#35 · G | 3 | 32 | 0 | 0 | 29 | .906 | 21 | 1 | 7 | 58:08 | 0 | 0 |
Capitals| Player | GA | SA | SOS | SOSA | SV | SV% | ESSV | PPSV | SHSV | TOI | YTDG | PIM |
|---|---|---|---|---|---|---|---|---|---|---|---|---|
 Vitek Vanecek#41 · G | 2 | 30 | 0 | 0 | 28 | .933 | 24 | 1 | 3 | 59:05 | 0 | 0 |
Injury Report
Head-to-Head
BOSLast 5 Games
WSH
4◂
NHL Regular Season
FINAL
Jan 20, 2022
3
7◂
NHL Regular Season
FINAL
Jan 10, 2022
3
1
NHL Regular Season
FINAL
May 11, 2021
▸2
6◂
NHL Regular Season
FINAL
Apr 18, 2021
3
1
NHL Regular Season
FINAL
Apr 11, 2021
▸8
Last 5 Games




Game Information
Stage
Regular Season
Season
2022
Puck Drop
Sun, Apr 10, 1:30 PM
Venue
Capital One Arena
Location
Washington, DC
Attendance
18,573
Officials
Kiel Murchison · Linesman, TJ Luxmore · Referee
Division Standings
Eastern Conference — Atlantic Division



Eastern Conference — Metropolitan Division
| Team | GP | W | L | OT | Pct | PTS | DIFF | Strk |
|---|---|---|---|---|---|---|---|---|
 Hurricanes | 82 | 53 | 22 | 7 | — | 113 | +56 | W1 |
 Penguins | 82 | 41 | 25 | 16 | — | 98 | +25 | L3 |
 Flyers | 82 | 43 | 27 | 12 | — | 98 | +7 | W3 |
| Capitals | 82 | 43 | 30 | 9 | — | 95 | +19 | W4 |
 Blue Jackets | 82 | 40 | 30 | 12 | — | 92 | 0 | L2 |
 Islanders | 82 | 43 | 34 | 5 | — | 91 | -8 | L3 |
 Devils | 82 | 42 | 37 | 3 | — | 87 | -24 | L1 |
 Rangers | 82 | 34 | 39 | 9 | — | 77 | -12 | W1 |
Bruins
2nd in Eastern Conference
VS
Capitals
12th in Eastern Conference
Goaltenders
#30

Michael DiPietro
#1
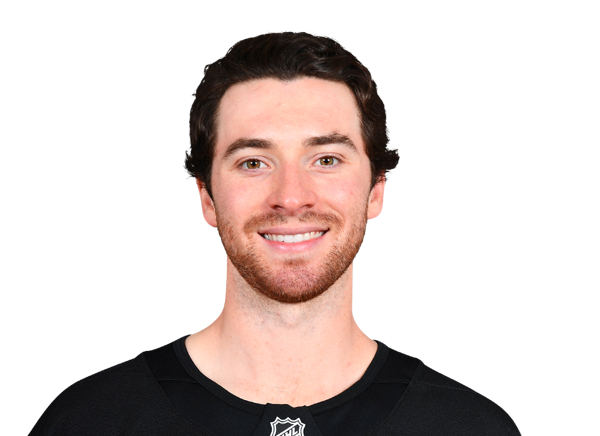
Jeremy Swayman
Defensemen
#45

Jonathan Aspirot
#17
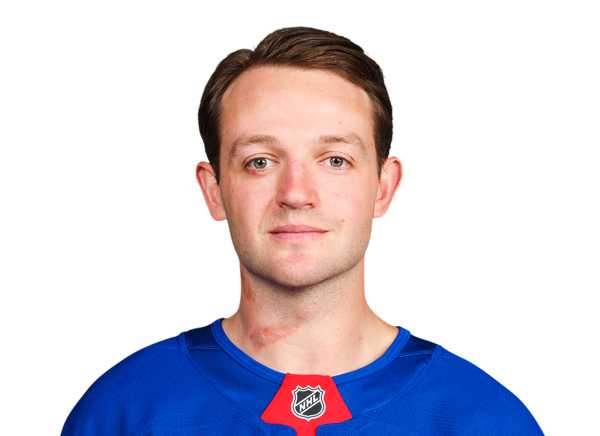
Will Borgen
#42

Frederic Brunet
#75
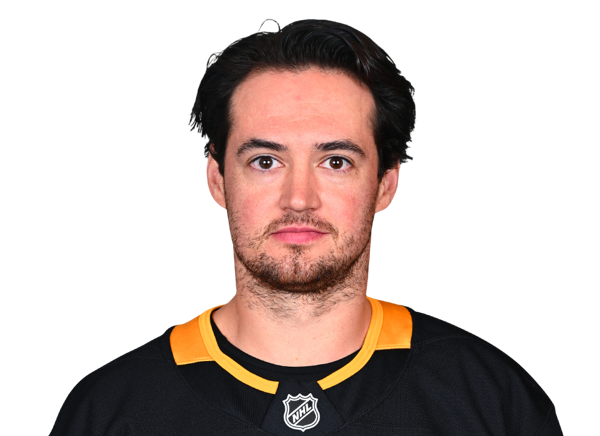
Connor Clifton
#27

Hampus Lindholm
#6
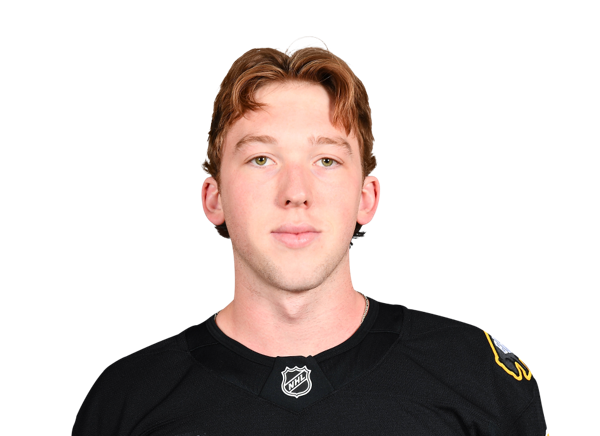
Mason Lohrei
#73
Charlie McAvoy
#91
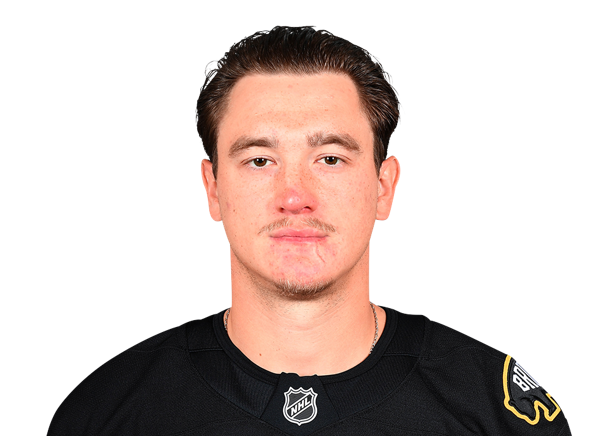
Nikita Zadorov
Left Wings
#84

Tanner Jeannot
Centers
#39

Morgan Geekie
#44
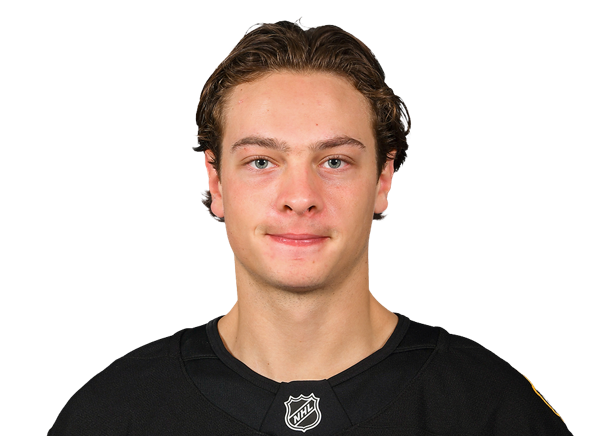
James Hagens
#47

Mark Kastelic
#92
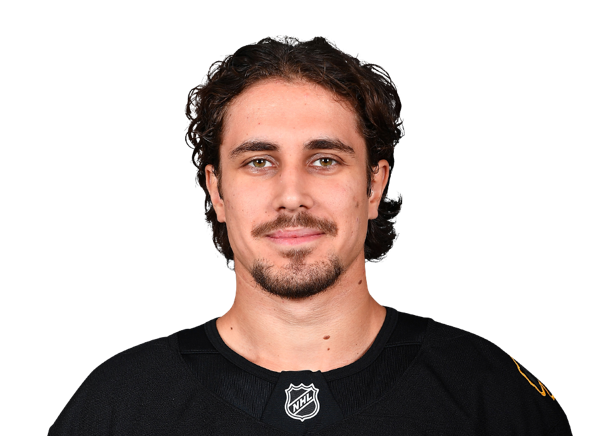
Marat Khusnutdinov
#52
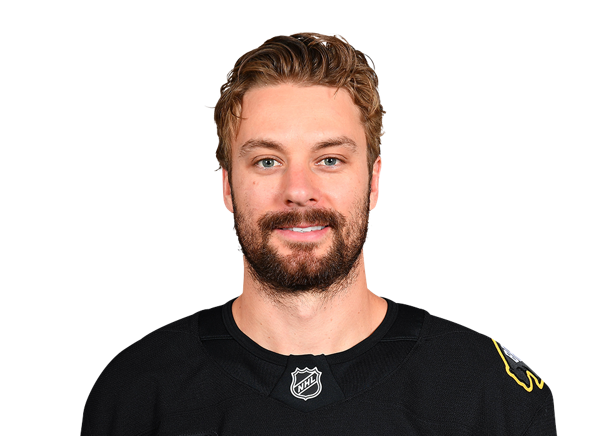
Sean Kuraly
#28
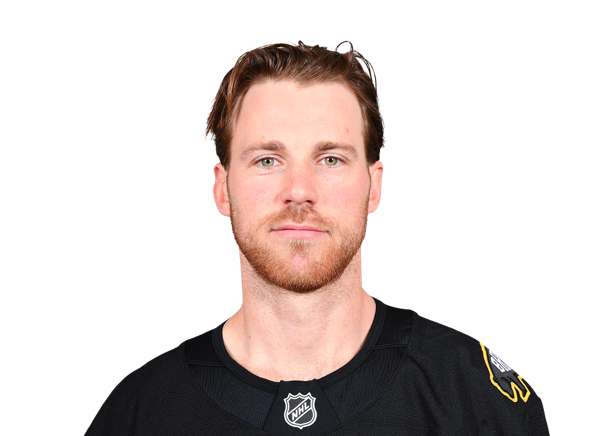
Elias Lindholm
#93
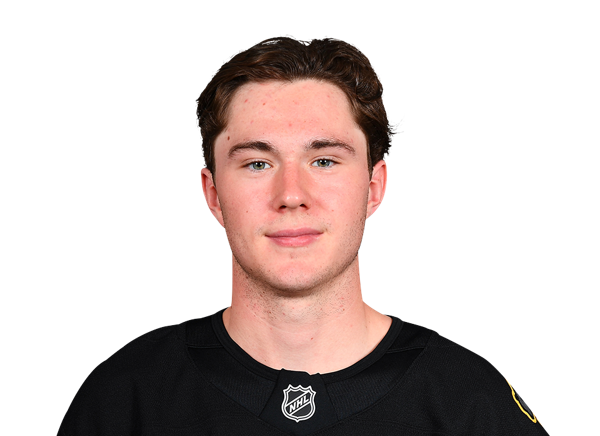
Fraser Minten
#11
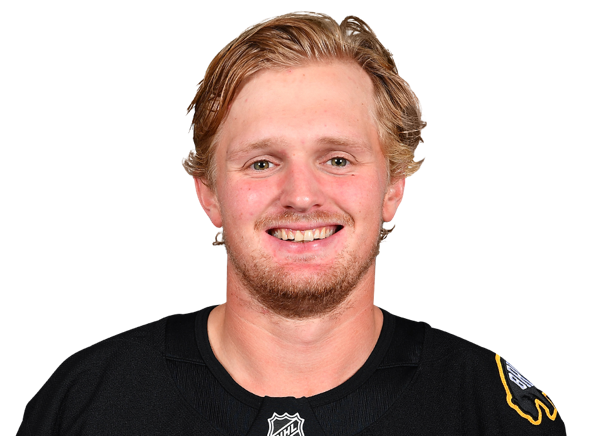
Casey Mittelstadt
#51

Matthew Poitras
#18
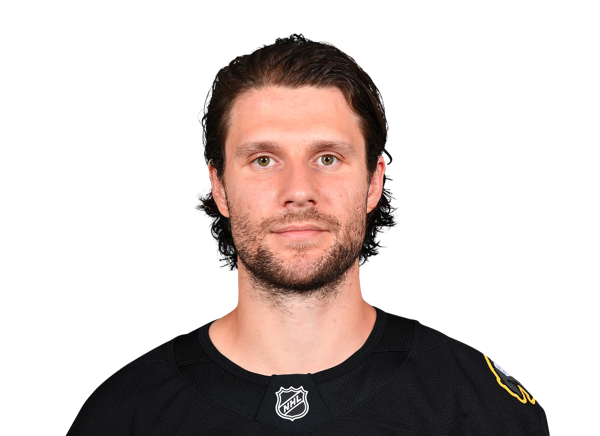
Pavel Zacha
Right Wings
#88
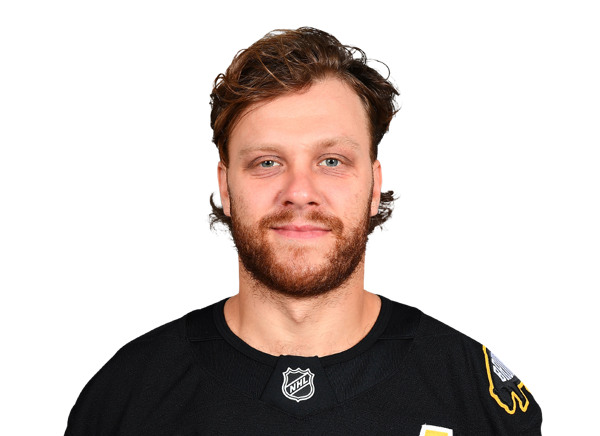
David Pastrnak
#10
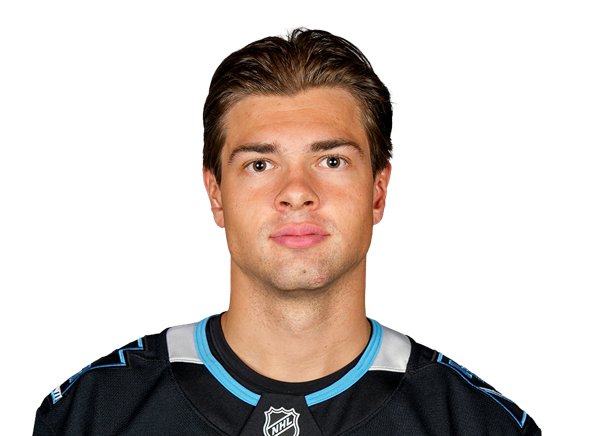
JJ Peterka
Goaltenders
#79
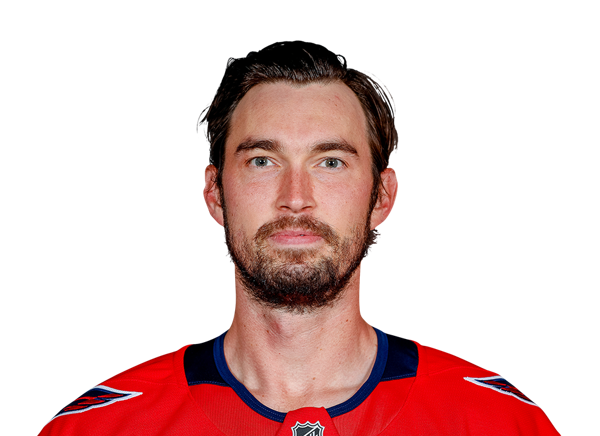
Charlie Lindgren
#1

Remi Poirier
#48
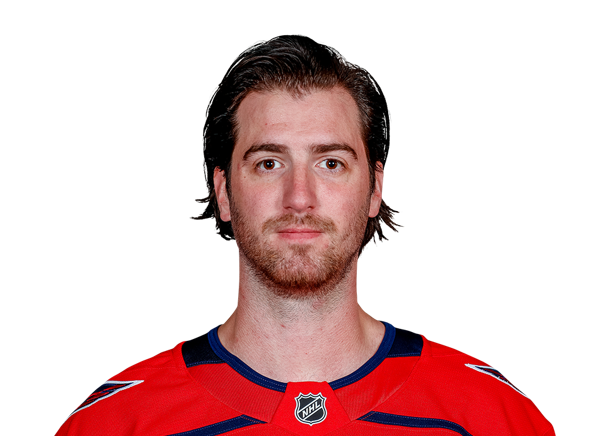
Logan Thompson
Defensemen
#6
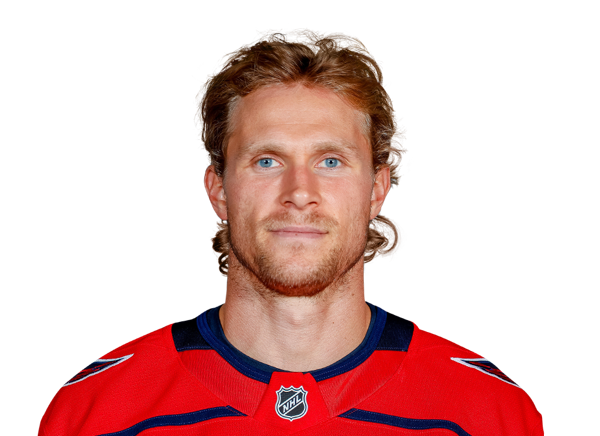
Jakob Chychrun
#73

Vincent Desharnais
#42
Martin Fehervary
#44
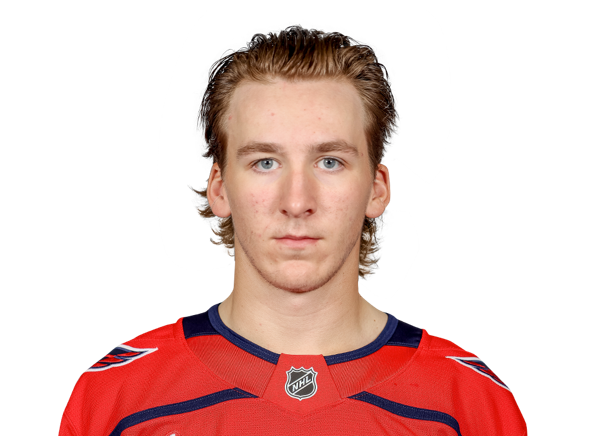
Cole Hutson
#27

Timothy Liljegren
#3
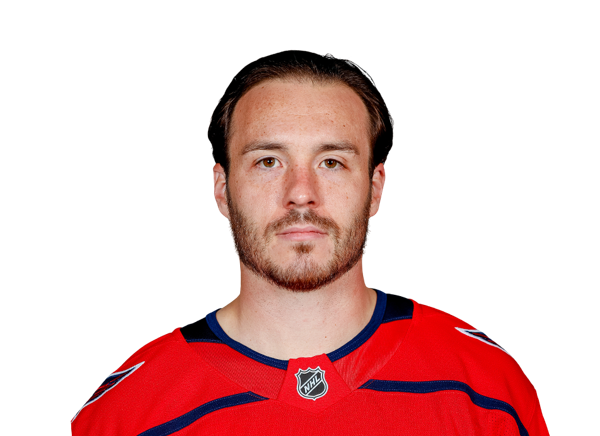
Matt Roy
#38
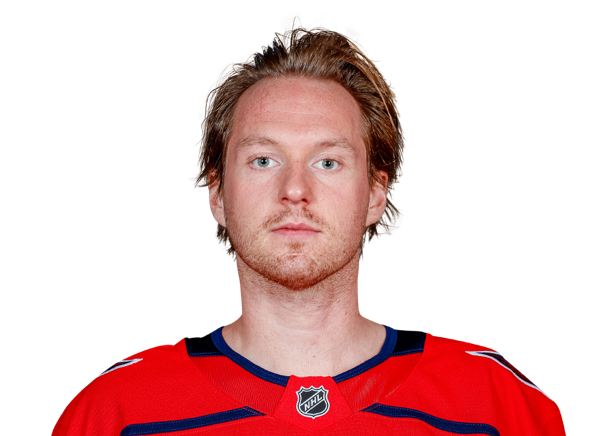
Rasmus Sandin
#6

Jack St. Ivany
Left Wings
#72

Anthony Beauvillier
#80
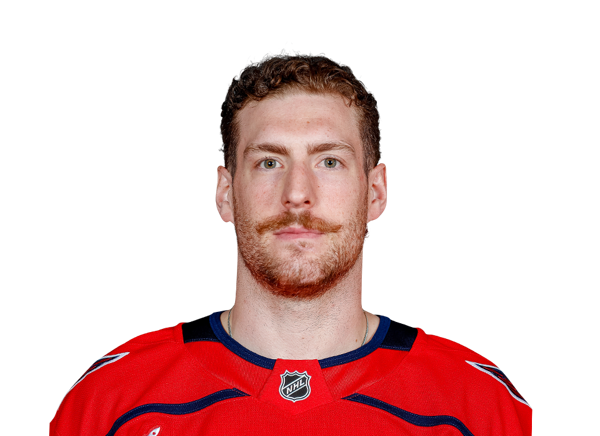
Pierre-Luc Dubois
#63
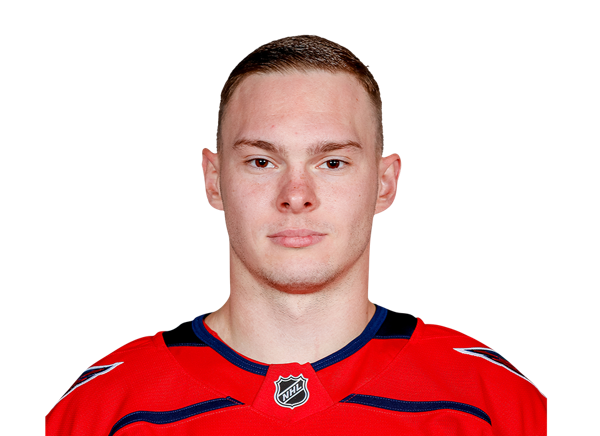
Ivan Miroshnichenko
#8
Alex Ovechkin
#62

Ilya Protas
Centers
#53

Ethen Frank
#22

Boone Jenner
#21
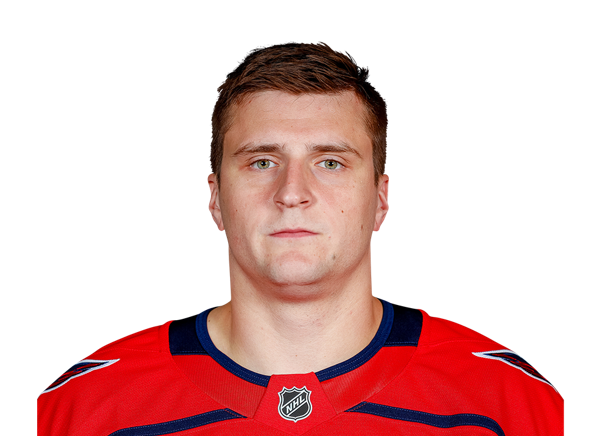
Aliaksei Protas
#17
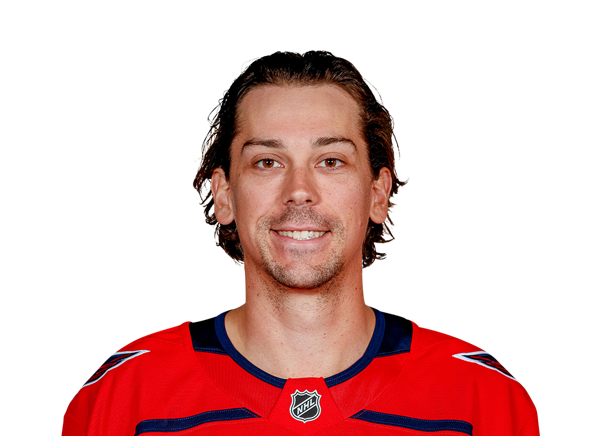
Dylan Strome
#49
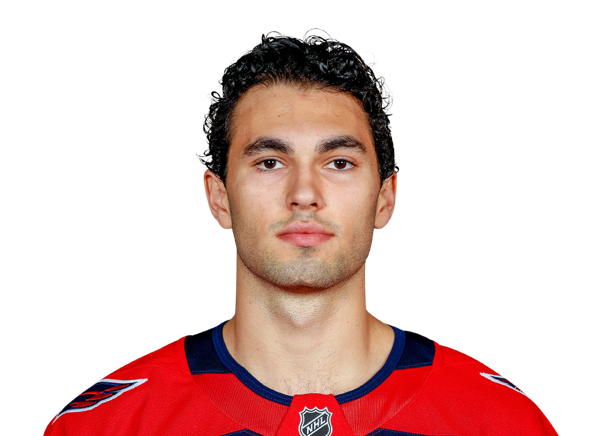
Patrick Thomas
Right Wings
#25
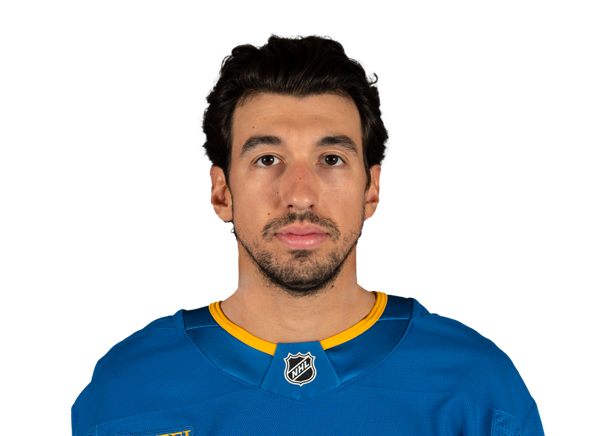
Jordan Kyrou
#9

Ryan Leonard
#34

Justin Sourdif
#89

Alex Tuch
#43
Tom Wilson
Bruins
1st in Atlantic Division
VS
Capitals
4th in Metropolitan Division
General
16
Games Played
14
5722:11
Time On Ice
4960:21
357:38
Time On Ice Per Game
354:18
0
Plus/Minus Rating
0
0:00
Production
0:00
5779
Shifts
4927
4
Losses
6
11
Wins
8
Offensive
57
Goals
49
94
Assists
81
512
Faceoffs Won
380
425
Faceoffs Lost
400
0
Game-Winning Goals
0
151
Points
130
10
Power Play Goals
8
20
Power Play Assists
14
0
Short Handed Goals
1
0
Short Handed Assists
0
421
Shots
386
0
Shootout Attempts
0
0
Shootout Goals
0
0.0
Shootout Shot Percentage
0.0
13.5
Shooting Percentage
12.7
54.6
Faceoff Win Percent
48.7
Defensive
2.38
Goals Against Average
3.43
410
Saves
339
.917
Save Percentage
.885
38
Goals Against
48
448
Shots Against
387
1
Overtime Losses
0
0
Shootout Saves
0
0
Shootout Shots Against
0
.000
Shootout Save Percentage
.000
Penalties
200
Penalty Minutes
139