

Philadelphia Flyers vs San Jose Sharks Live Score (1 Jan, 2027)
Team Stats
 PHI
SJ


0
Power Play Goals
2
26
Penalty Minutes
28
4.33
Avg Goals Against
3.50
40.7
Avg Shots Against
30.5
66.7
Penalty Kill %
66.7
4
Power Play Goals Against
3
0
Short Handed Goals Against
0
1.33
Avg Goals
4.50
20.7
Avg Shots
28.5
0.0
Power Play %
33.3
0
Short Handed Goals
1
Game Leaders
PHI
SJ
Game Information
Stage
Regular Season
Season
2027
Puck Drop
Fri, Jan 1, 4:00 PM
Venue
SAP Center at San Jose
Location
San Jose, CA
Injury Report


Head-to-Head
PHILast 2 Games
SJ
4◂
NHL Regular Season
FINAL
Mar 21, 2026
1
4◂
NHL Regular Season
FINAL
Dec 9, 2025
1
Last 5 Games







Division Standings
Eastern Conference — Metropolitan Division
| Team | GP | W | L | OT | Pct | PTS | DIFF | Strk |
|---|---|---|---|---|---|---|---|---|
 Hurricanes | 18 | 13 | 3 | 2 | — | 28 | +26 | W1 |
 Devils | 16 | 11 | 5 | 0 | — | 22 | +10 | W3 |
 Rangers | 17 | 9 | 7 | 1 | — | 19 | +2 | W2 |
 Capitals | 14 | 8 | 6 | 0 | — | 16 | +1 | L2 |
 Islanders | 15 | 7 | 6 | 2 | — | 16 | -1 | L2 |
 Blue Jackets | 14 | 7 | 7 | 0 | — | 14 | -4 | W2 |
 Penguins | 16 | 5 | 9 | 2 | — | 12 | -7 | L4 |
| Flyers | 18 | 4 | 10 | 4 | — | 12 | -22 | L2 |




Flyers
15th in Eastern Conference
VS
Sharks
11th in Western Conference
Goaltenders
#80

Dan Vladar
#53
Joseph Woll
Defensemen
#44

Simon Benoit
#59

Oliver Bonk
#9

Jamie Drysdale
#3

Helge Grans
#5

David Jiricek
#55

Rasmus Ristolainen
#6

Travis Sanheim
#24

Nick Seeler
#8

Cam York
Left Wings
#20

Alex Bump
#58

Michael Bunting
#27

Noah Cates
Centers
#52

Noel Acciari
#86

Denver Barkey
#14

Sean Couturier
#22

Christian Dvorak
#17

Jett Luchanko
#46

Trevor Zegras
Right Wings
#71
Tyson Foerster
#54

Cole Knuble
#11

Travis Konecny
#94

Porter Martone
#39
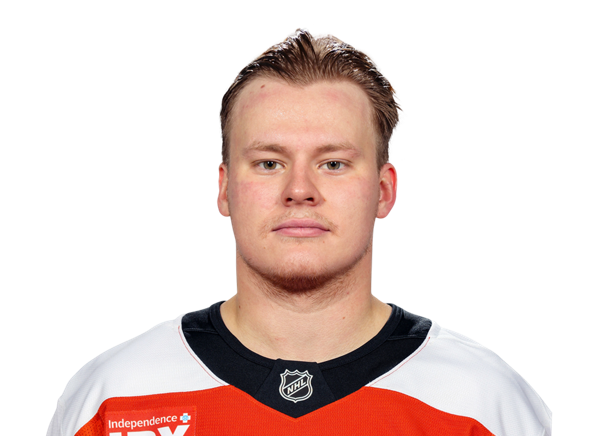
Matvei Michkov
#74

Owen Tippett
Goaltenders
#30

Yaroslav Askarov
#85
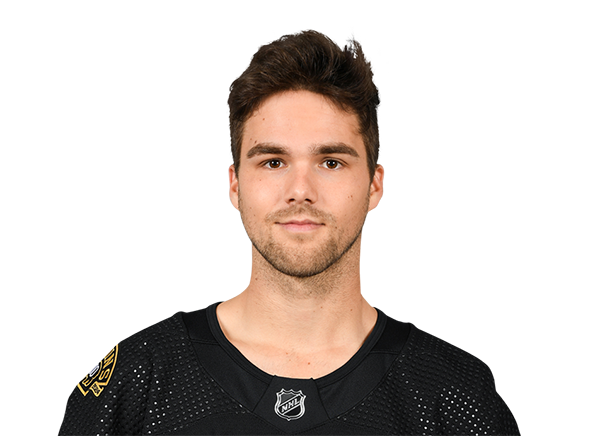
Kyle Keyser
#33

Alex Nedeljkovic
Defensemen
#5
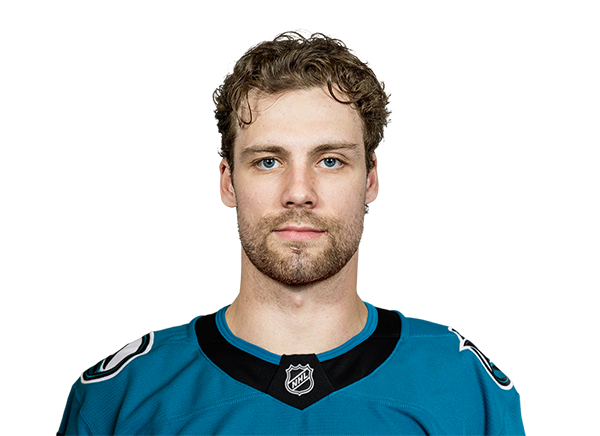
Nolan Allan
#6
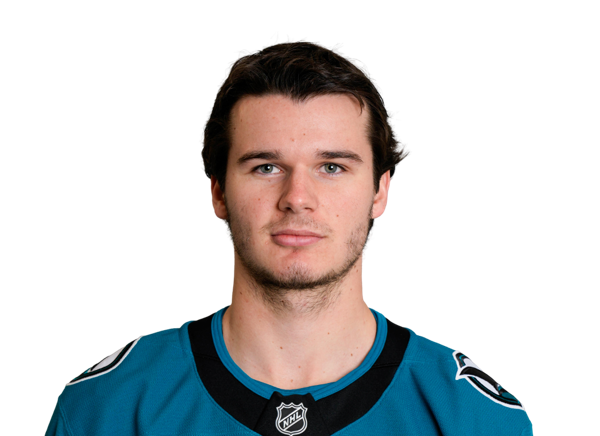
Sam Dickinson
#43

Michael Fisher
#24

Libor Hajek
#25

Mattias Havelid
#7
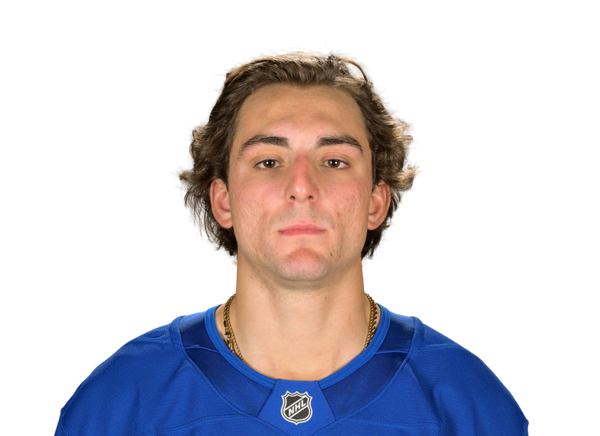
Michael Kesselring
#25
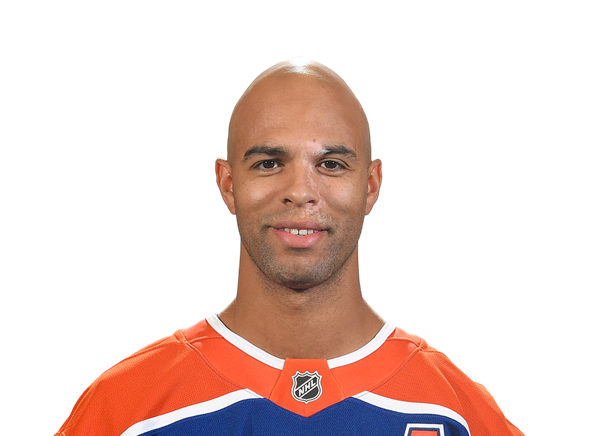
Darnell Nurse
#9
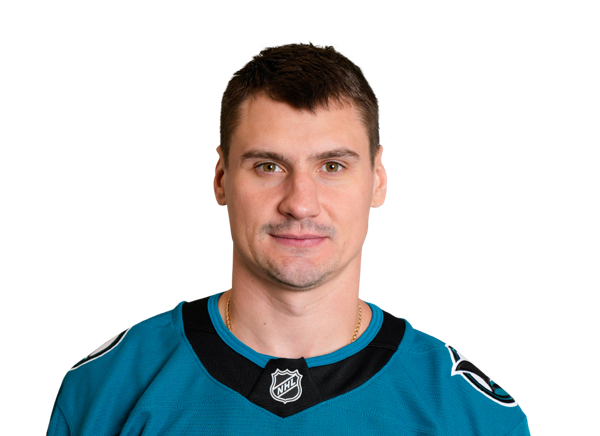
Dmitry Orlov
#48
Eric Pohlkamp
#65

Jacob Trouba
Left Wings
#92

Igor Chernyshov
#27
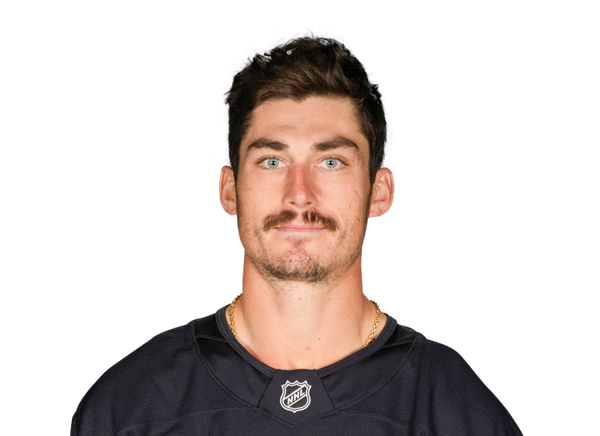
Mason Marchment
#13
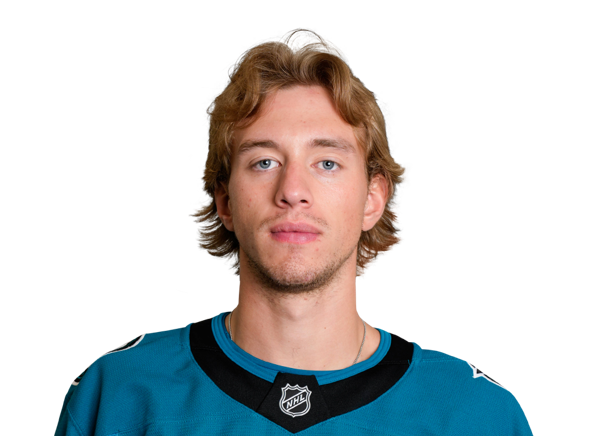
Quentin Musty
#44
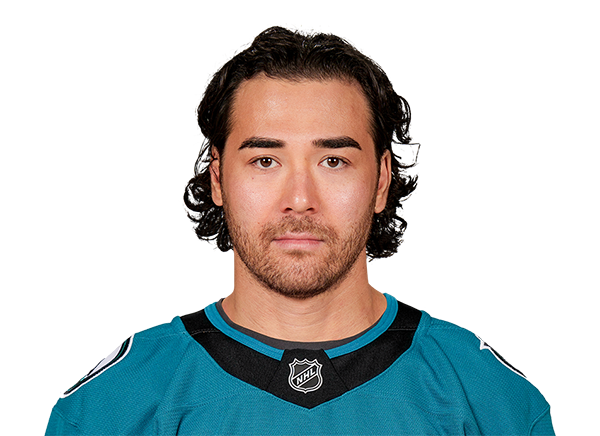
Kiefer Sherwood
#41
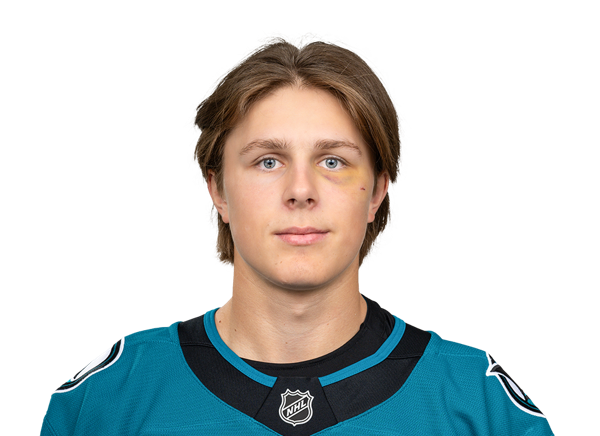
Ivar Stenberg
Centers
#18
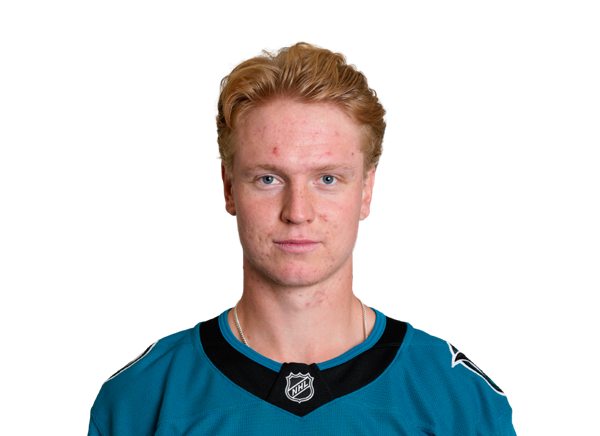
Filip Bystedt
#71

Macklin Celebrini
#10

Ty Dellandrea
#23
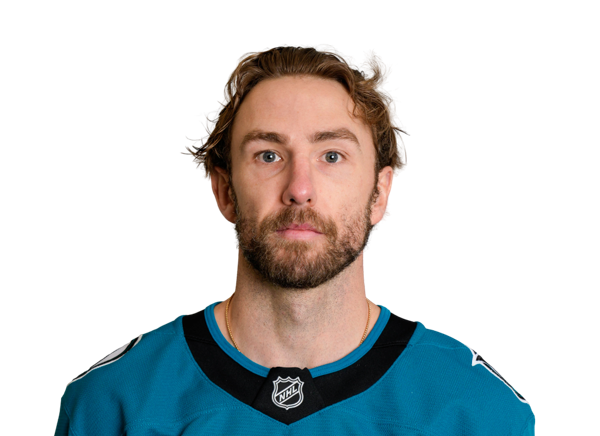
Barclay Goodrow
#77

Michael Misa
#63

Zack Ostapchuk
#2
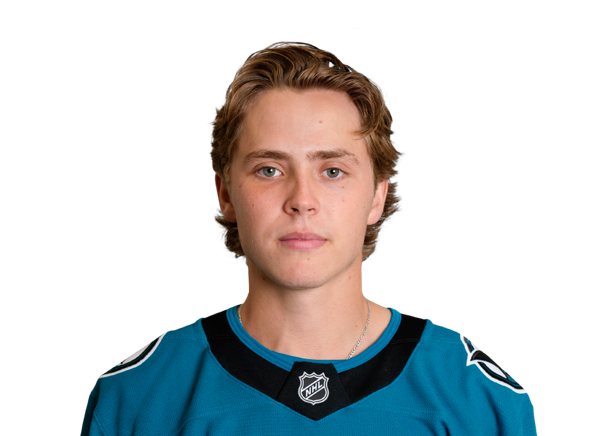
Will Smith
#73

Tyler Toffoli
#21

Alexander Wennberg
Right Wings
#81

Adam Gaudette
#54
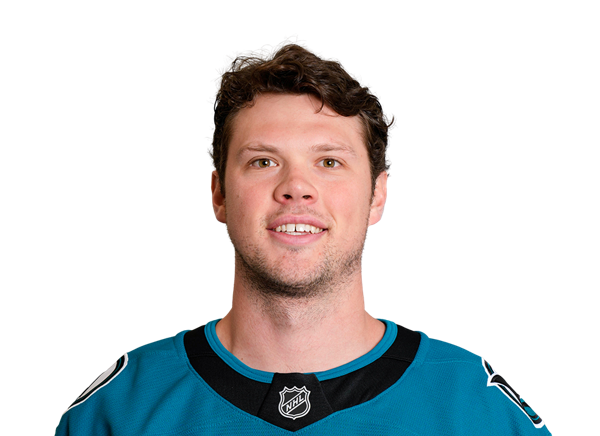
Patrick Giles
#51
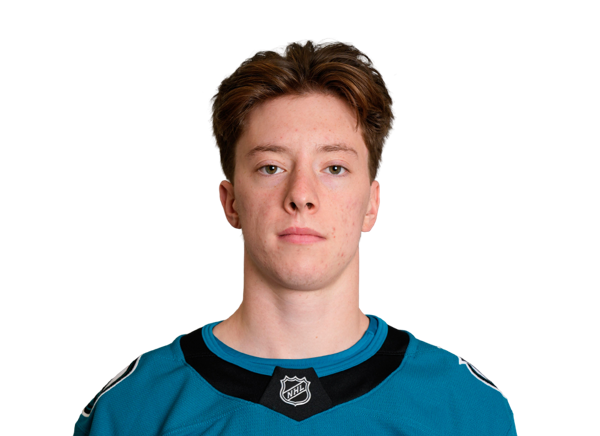
Collin Graf
#17

Brett Leason
Flyers
7th in Metropolitan Division
VS
Sharks
5th in Pacific Division
General
18
Games Played
17
6424:54
Time On Ice
6093:16
356:56
Time On Ice Per Game
358:25
0
Plus/Minus Rating
0
0:00
Production
0:00
6829
Shifts
6099
10
Losses
9
4
Wins
7
Offensive
39
Goals
43
69
Assists
71
518
Faceoffs Won
486
501
Faceoffs Lost
521
0
Game-Winning Goals
0
108
Points
114
9
Power Play Goals
14
18
Power Play Assists
28
1
Short Handed Goals
4
1
Short Handed Assists
4
423
Shots
466
5
Shootout Attempts
5
1
Shootout Goals
1
20.0
Shootout Shot Percentage
20.0
9.2
Shooting Percentage
9.2
50.8
Faceoff Win Percent
48.3
Defensive
3.33
Goals Against Average
3.53
466
Saves
454
.891
Save Percentage
.892
60
Goals Against
60
526
Shots Against
514
4
Overtime Losses
1
3
Shootout Saves
5
5
Shootout Shots Against
6
.600
Shootout Save Percentage
.833
Penalties
176
Penalty Minutes
175