

Vegas Golden Knights vs Tampa Bay Lightning Live Score (15 Jan, 2027)
Game Information
Stage
Regular Season
Season
2027
Puck Drop
Thu, Jan 14, 7:00 PM
Venue
Benchmark International Arena
Location
Tampa, FL
Injury Report
 Tampa Bay Lightning
Head-to-Head
 VGK
Last 3 Games
TB
2
NHL Regular Season
FINAL
Oct 20, 2026
▸6
3
NHL Regular Season
FINAL
Nov 6, 2025
▸6
1
NHL Regular Season
FINAL
Oct 26, 2025
▸2
Last 5 Games










Division Standings
Eastern Conference — Atlantic Division











Golden Knights
3rd in Western Conference
VS
Lightning
5th in Eastern Conference
Goaltenders
#79
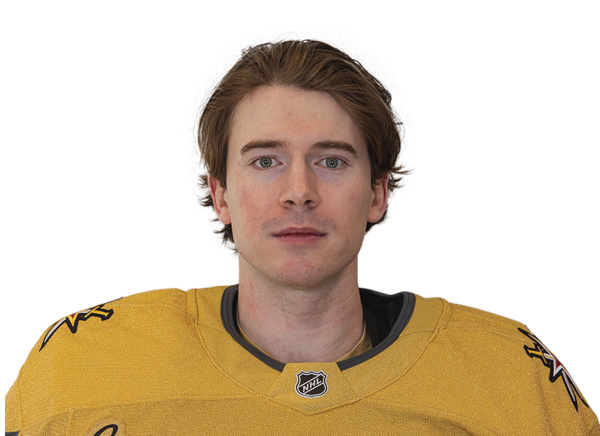
Carter Hart
#33
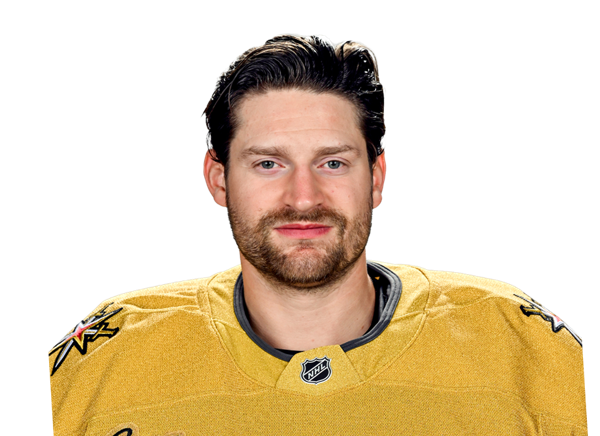
Adin Hill
Defensemen
#4

Rasmus Andersson
#52

Dylan Coghlan
#15

Noah Hanifin
#74

Viliam Kmec
#5

Jeremy Lauzon
#3

Brayden McNabb
#7
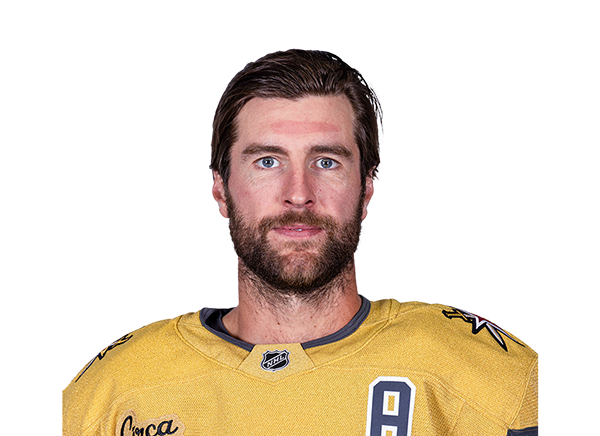
Alex Pietrangelo
#56
Juho Piiparinen
#27

Shea Theodore
#6

Antti Tuomisto
#29
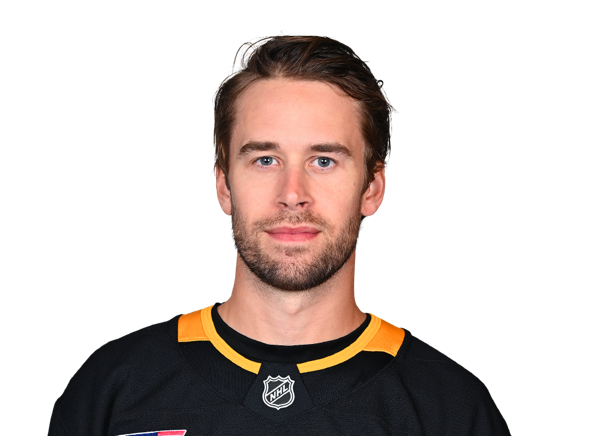
Parker Wotherspoon
Left Wings
#49

Ivan Barbashev
#24
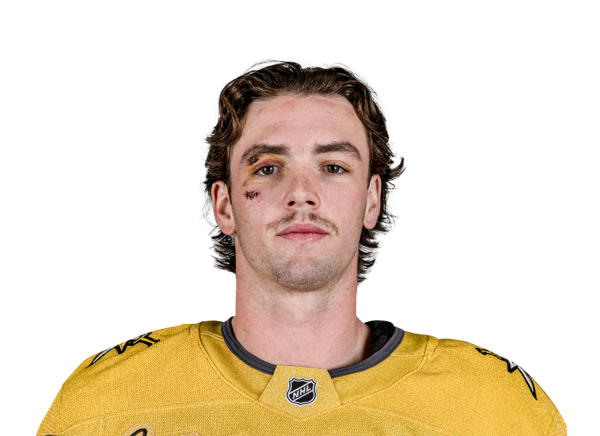
Trevor Connelly
#95
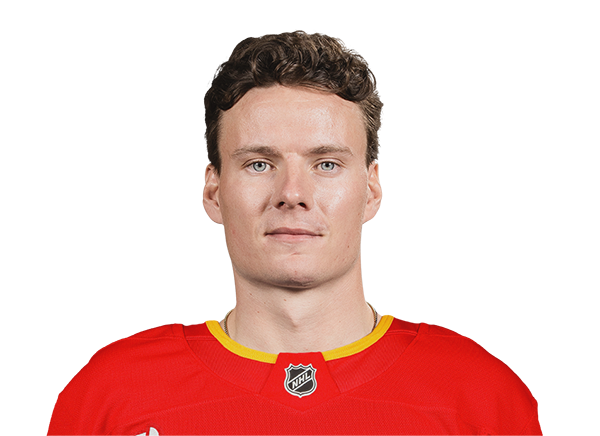
Victor Olofsson
Centers
#26

Nic Dowd
#9

Jack Eichel
#17
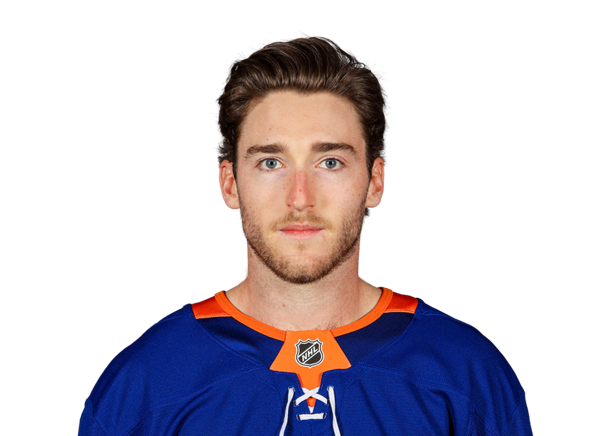
Marc Gatcomb
#48
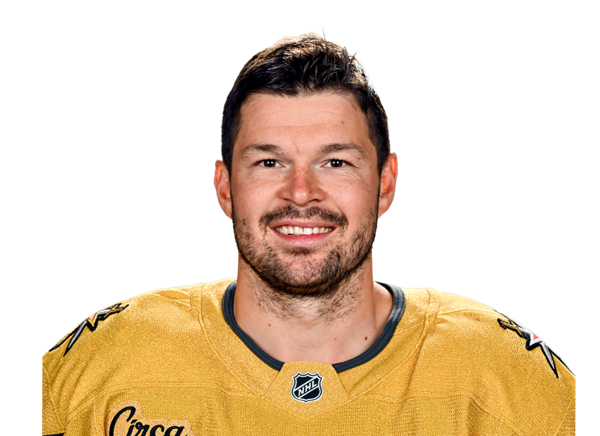
Tomas Hertl
#21

Brett Howden
#71

William Karlsson
#28

Tanner Laczynski
#36

Raphael Lavoie
#77
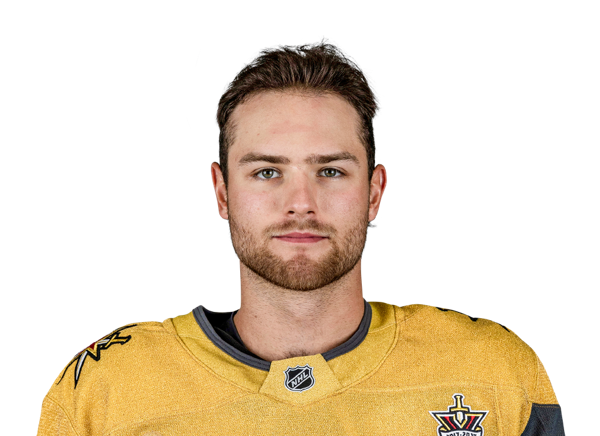
Kai Uchacz
Right Wings
#42
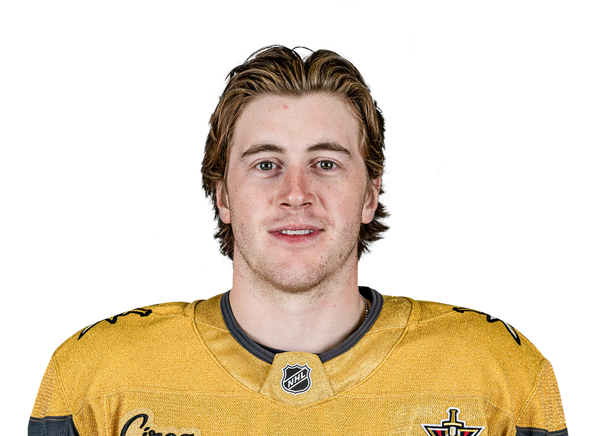
Braeden Bowman
#93

Mitch Marner
#46

Jonas Rondbjerg
#61
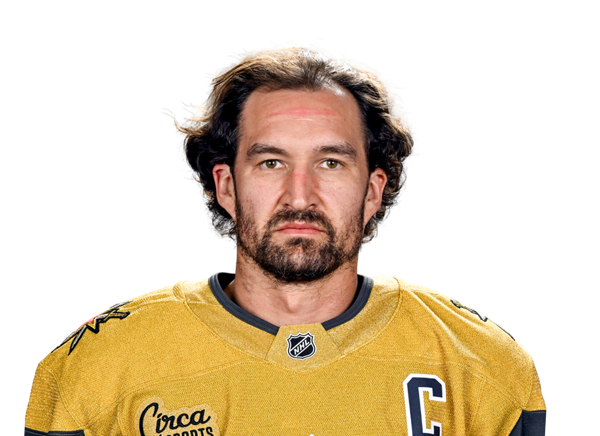
Mark Stone
Goaltenders
#35
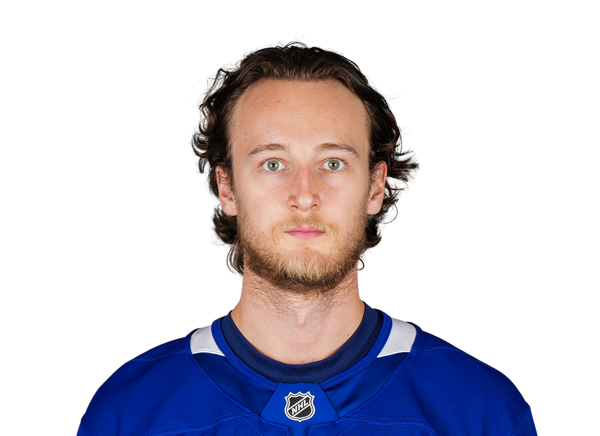
Dennis Hildeby
#88
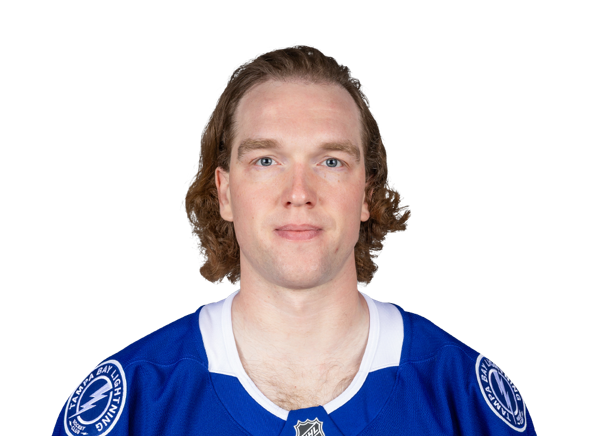
Andrei Vasilevskiy
Defensemen
#74

John Carlson
#81

Erik Cernak
#24

Max Crozier
#51
Charle-Edouard D'Astous
#77
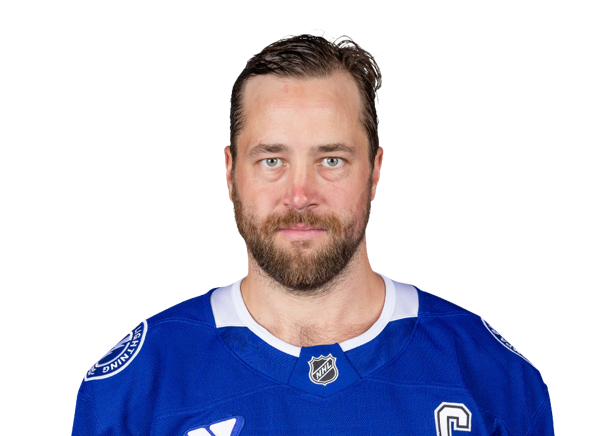
Victor Hedman
#78

Emil Lilleberg
#27

Ryan McDonagh
#90

JJ Moser
Left Wings
#38
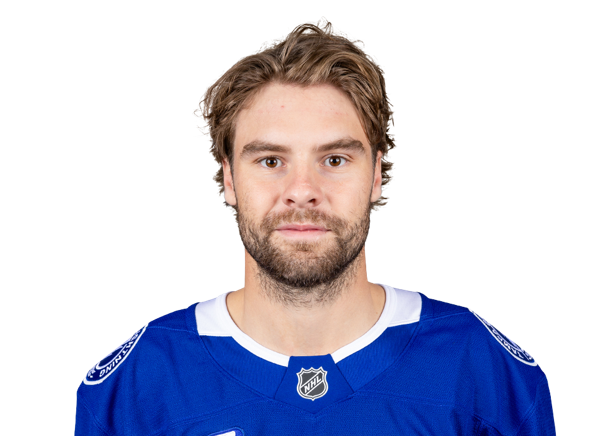
Brandon Hagel
#25
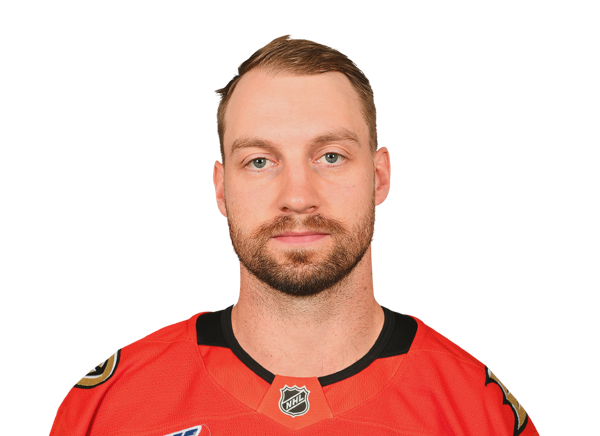
Jeffrey Viel
Centers
#71
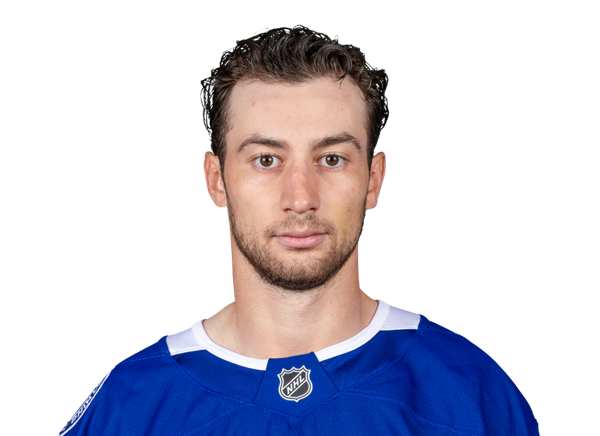
Anthony Cirelli
#94

Conor Geekie
#28
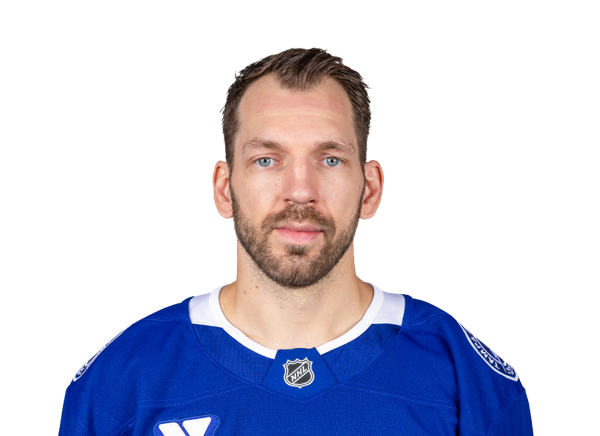
Zemgus Girgensons
#93
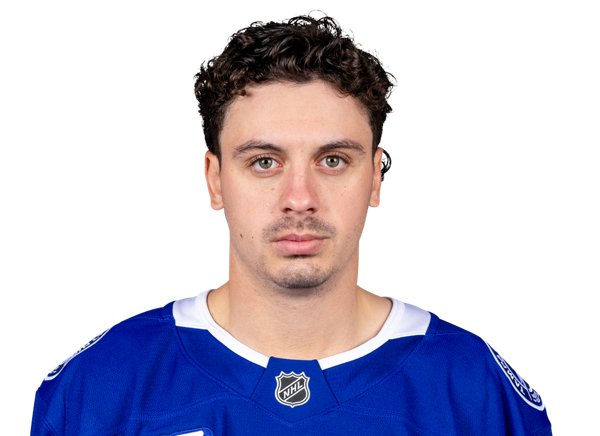
Gage Goncalves
#37
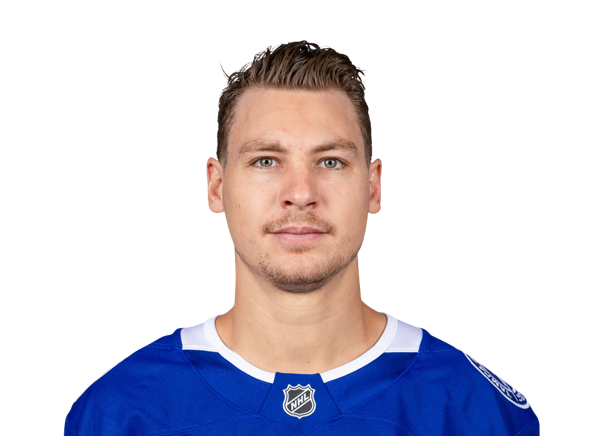
Yanni Gourde
#59

Jake Guentzel
#17

Dominic James
#21

Brayden Point
Right Wings
#29

Pontus Holmberg
#86

Nikita Kucherov
#95
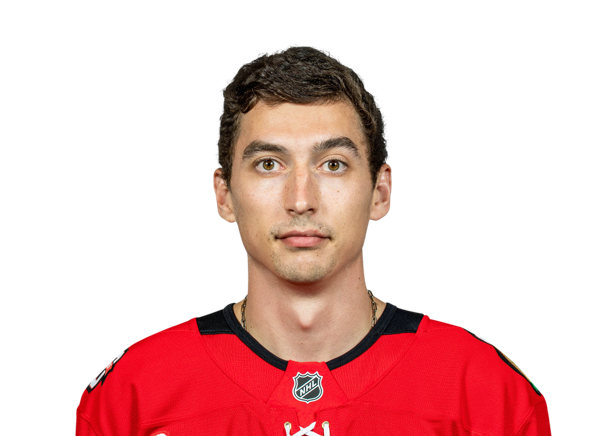
Ilya Mikheyev
#49

Scott Sabourin
Golden Knights
2nd in Pacific Division
VS
Lightning
4th in Atlantic Division
General
17
Games Played
14
6091:42
Time On Ice
4996:55
358:20
Time On Ice Per Game
356:55
0
Plus/Minus Rating
0
0:00
Production
0:00
6270
Shifts
5186
5
Losses
3
10
Wins
9
Offensive
57
Goals
52
96
Assists
79
478
Faceoffs Won
384
472
Faceoffs Lost
421
0
Game-Winning Goals
0
153
Points
131
15
Power Play Goals
8
29
Power Play Assists
16
3
Short Handed Goals
0
2
Short Handed Assists
0
483
Shots
418
5
Shootout Attempts
4
2
Shootout Goals
0
40.0
Shootout Shot Percentage
0.0
11.8
Shooting Percentage
12.4
50.3
Faceoff Win Percent
47.7
Defensive
2.82
Goals Against Average
3.14
388
Saves
301
.894
Save Percentage
.880
48
Goals Against
44
436
Shots Against
345
2
Overtime Losses
2
4
Shootout Saves
3
5
Shootout Shots Against
4
.800
Shootout Save Percentage
.750
Penalties
150
Penalty Minutes
110