

Nashville Predators vs Tampa Bay Lightning Live Score (30 Dec, 2026)
Team Stats
 NSH
TB


2
Power Play Goals
0
10
Penalty Minutes
19
2.00
Avg Goals Against
3.00
30.0
Avg Shots Against
23.0
80.0
Penalty Kill %
75.0
1
Power Play Goals Against
1
0
Short Handed Goals Against
0
1.50
Avg Goals
2.00
23.0
Avg Shots
27.5
28.6
Power Play %
0.0
0
Short Handed Goals
0
Game Leaders
NSH
TB
Game Information
Stage
Regular Season
Season
2027
Puck Drop
Tue, Dec 29, 7:00 PM
Venue
Benchmark International Arena
Location
Tampa, FL
Broadcast
Scripps Sports
Injury Report
Nashville PredatorsHead-to-Head
NSHLast 3 Games
TB
5◂
NHL Regular Season
FINAL
Oct 31, 2026
4
2
NHL Regular Season
FINAL
Mar 29, 2026
▸3
2
NHL Regular Season
FINAL
Oct 28, 2025
▸5
Last 5 Games








Division Standings
Eastern Conference — Atlantic Division









Predators
7th in Western Conference
VS
Lightning
4th in Eastern Conference
Goaltenders
#29

Justus Annunen
#74

Juuse Saros
Defensemen
#47

Jack Ahcan
#41

Nicolas Hague
#52
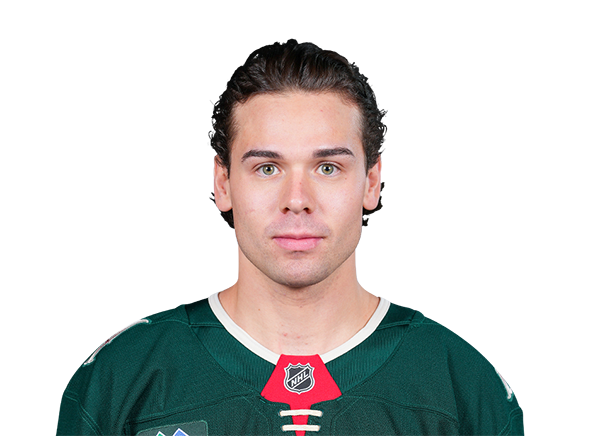
Daemon Hunt
#59

Roman Josi
#46

Ilya Lyubushkin
#48

Nick Perbix
#76

Brady Skjei
#3

Jayden Struble
#85
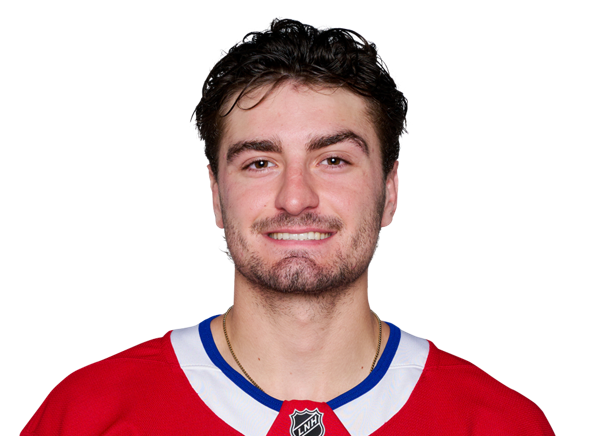
William Trudeau
#2

Adam Wilsby
Left Wings
#9
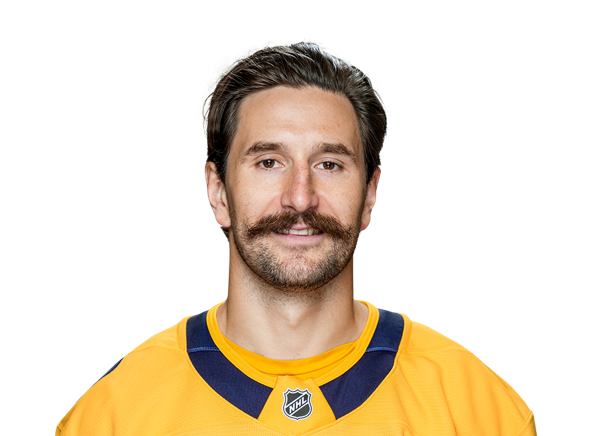
Filip Forsberg
#21

Nils Hoglander
#49
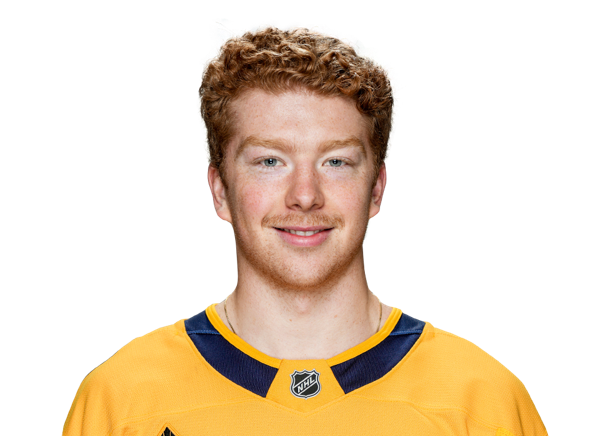
Reid Schaefer
Centers
#22

Mavrik Bourque
#79

Ross Colton
#18
Jack Drury
#84

Adam Edstrom
#14
Alexander Kerfoot
#90

Ryan O'Reilly
#51

Vitali Pinchuk
#91
Steven Stamkos
#51
Shane Wright
Right Wings
#81

Jonathan Marchessault
Goaltenders
#35
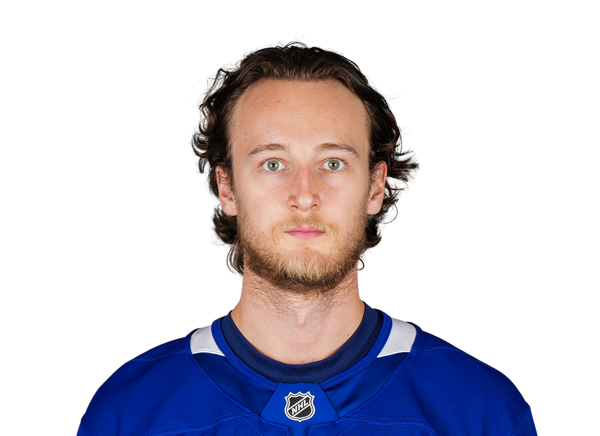
Dennis Hildeby
#88
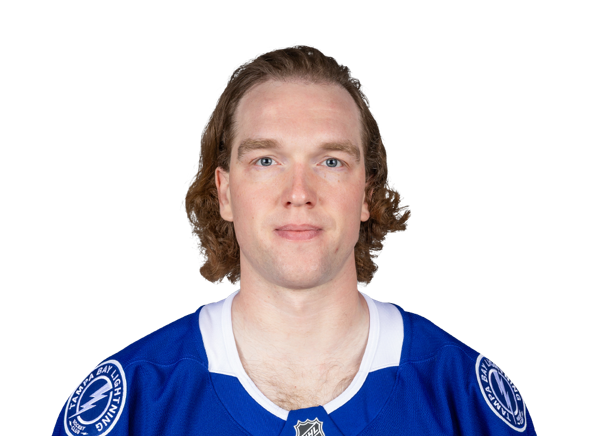
Andrei Vasilevskiy
Defensemen
#74

John Carlson
#81

Erik Cernak
#24

Max Crozier
#51

Charle-Edouard D'Astous
#77
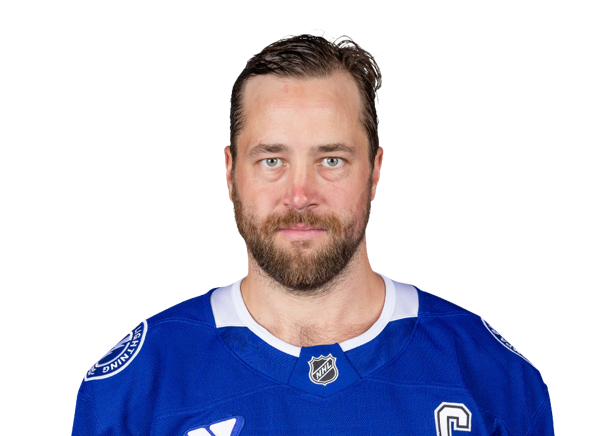
Victor Hedman
#78

Emil Lilleberg
#27

Ryan McDonagh
#90

JJ Moser
Left Wings
#38
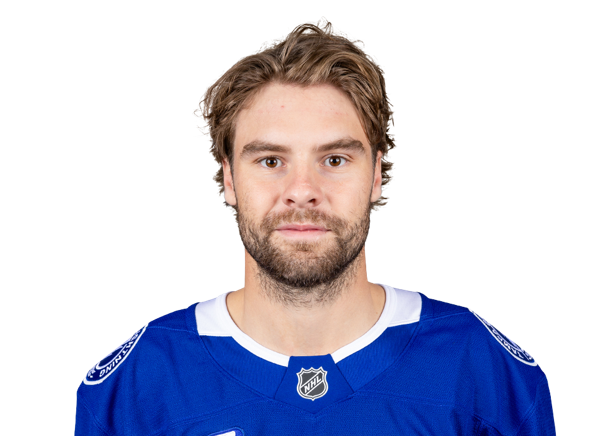
Brandon Hagel
#25

Jeffrey Viel
Centers
#71
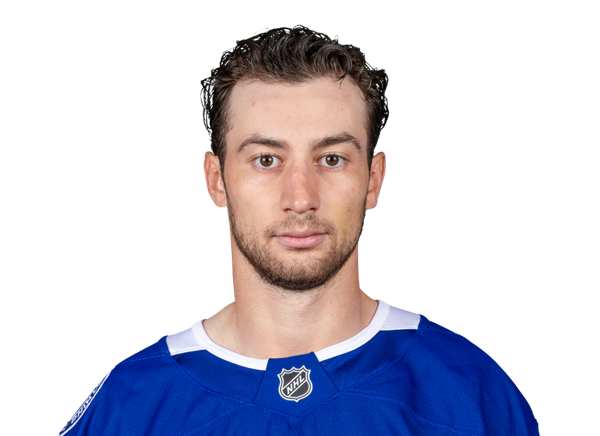
Anthony Cirelli
#94

Conor Geekie
#28
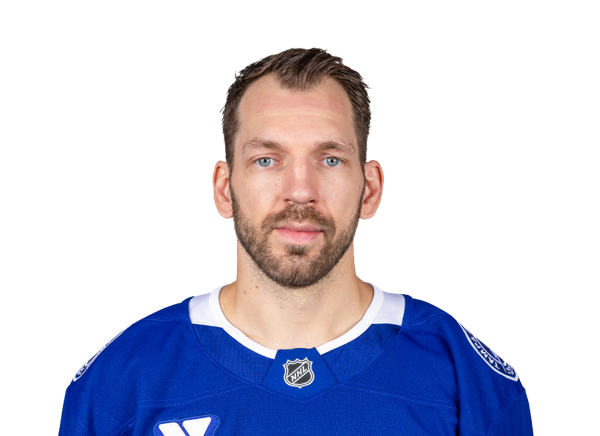
Zemgus Girgensons
#93
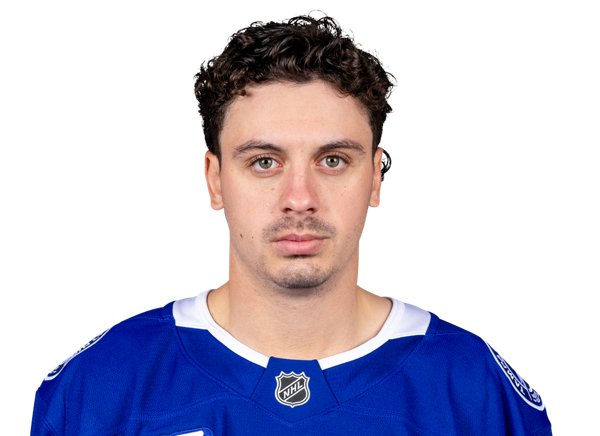
Gage Goncalves
#37
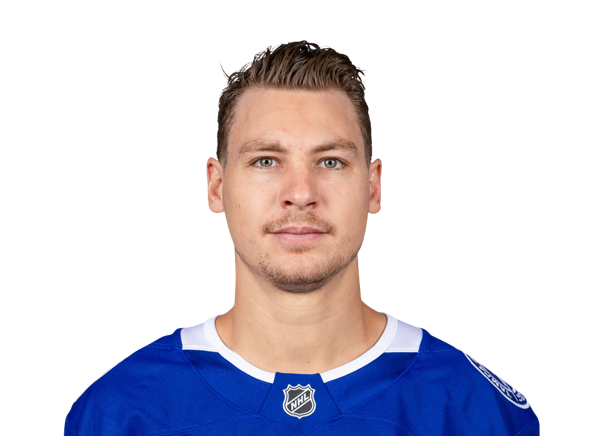
Yanni Gourde
#59

Jake Guentzel
#17

Dominic James
#21

Brayden Point
Right Wings
#29

Pontus Holmberg
#86

Nikita Kucherov
#95
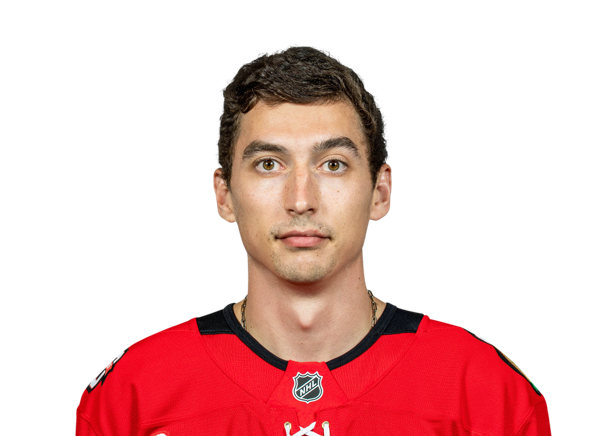
Ilya Mikheyev
#49

Scott Sabourin
Predators
5th in Central Division
VS
Lightning
3rd in Atlantic Division
General
16
Games Played
15
5792:05
Time On Ice
5354:55
362:00
Time On Ice Per Game
356:59
0
Plus/Minus Rating
0
0:00
Production
0:00
5856
Shifts
5567
4
Losses
3
7
Wins
10
Offensive
48
Goals
56
85
Assists
87
463
Faceoffs Won
427
450
Faceoffs Lost
447
0
Game-Winning Goals
0
133
Points
143
16
Power Play Goals
9
30
Power Play Assists
18
2
Short Handed Goals
0
4
Short Handed Assists
0
413
Shots
453
12
Shootout Attempts
4
2
Shootout Goals
0
16.7
Shootout Shot Percentage
0.0
11.6
Shooting Percentage
12.4
50.7
Faceoff Win Percent
48.9
Defensive
2.94
Goals Against Average
3.00
420
Saves
327
.899
Save Percentage
.886
47
Goals Against
45
467
Shots Against
372
5
Overtime Losses
2
6
Shootout Saves
3
11
Shootout Shots Against
4
.545
Shootout Save Percentage
.750
Penalties
114
Penalty Minutes
117