

Angels vs Red Sox Live Score (9 Sep, 2026)
Game Information
Stage
STD
Season
2026
First Pitch
Wed, Sep 9, 6:45 pm
Venue
Fenway Park
Location
Boston, Massachusetts
Venue Type
Outdoor
Broadcast
MLB.TV
Attendance
35,428
Live Situation
2Balls
2Strikes
0Outs
—Pitcher
—At Bat
Pitch Sequence
1
BALL
Sinker
95 MPH
2
BALL
Four-seam FB
100 MPH
3
STRIKE LOOKING
Four-seam FB
101 MPH
4
STRIKE LOOKING
Four-seam FB
100 MPH
5
BALL IN PLAY
Four-seam FB
100 MPH
Injury Report





Team Stats
 LAA
BOS

6
Runs
4
12
Hits
8
0
Errors
0
3
Home Runs
2
2
Walks
2
5
Strikeouts
8
Player Box Score
Los Angeles Angels
| Player | H-AB | AB | R | H | RBI | HR | BB | K | #P | AVG | OBP | SLG |
|---|---|---|---|---|---|---|---|---|---|---|---|---|
 Zach Neto |
2-3 | 3 | 1 | 2 | 3 | 1 | 0 | 0 | 17 | .244 | .324 | .443 |
 Mike Trout |
1-4 | 4 | 1 | 1 | 0 | 0 | 0 | 0 | 16 | .244 | .375 | .425 |
 Jose Siri |
2-4 | 4 | 1 | 2 | 2 | 1 | 0 | 0 | 16 | .225 | .281 | .396 |
 Vaughn Grissom |
0-4 | 4 | 0 | 0 | 0 | 0 | 0 | 0 | 14 | .245 | .308 | .385 |
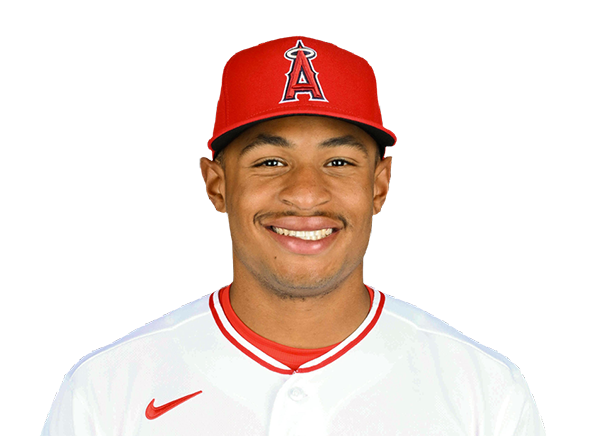 Christian Moore |
0-3 | 3 | 0 | 0 | 0 | 0 | 1 | 3 | 17 | .181 | .242 | .265 |
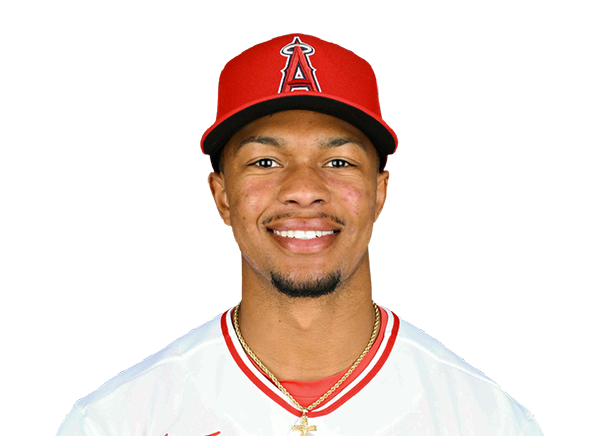 Kyren Paris |
0-3 | 3 | 0 | 0 | 0 | 0 | 1 | 1 | 17 | .000 | .182 | .000 |
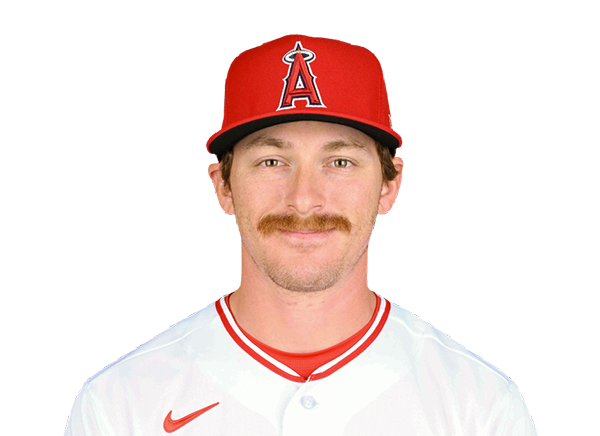 Wade Meckler |
0-0 | 0 | 0 | 0 | 0 | 0 | 0 | 0 | 0 | .298 | .373 | .388 |
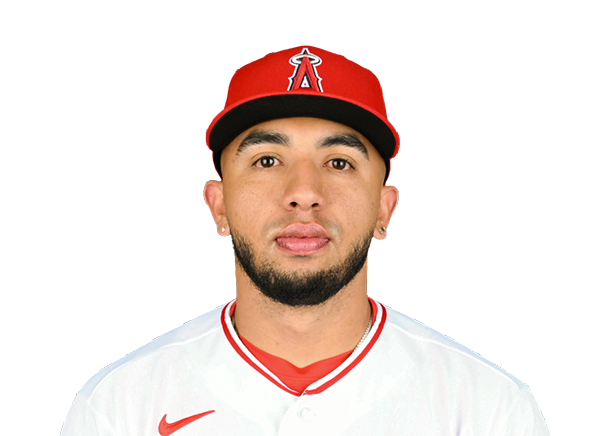 Oswald Peraza |
2-4 | 4 | 1 | 2 | 0 | 0 | 0 | 1 | 10 | .225 | .280 | .340 |
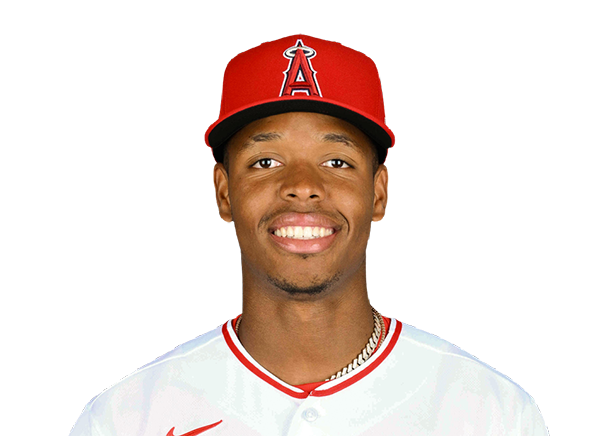 Denzer Guzman |
3-4 | 4 | 2 | 3 | 1 | 1 | 0 | 0 | 7 | .227 | .269 | .356 |
 Tyler Heineman |
2-3 | 3 | 0 | 2 | 0 | 0 | 0 | 0 | 8 | .179 | .227 | .228 |
Boston Red Sox
| Player | H-AB | AB | R | H | RBI | HR | BB | K | #P | AVG | OBP | SLG |
|---|---|---|---|---|---|---|---|---|---|---|---|---|
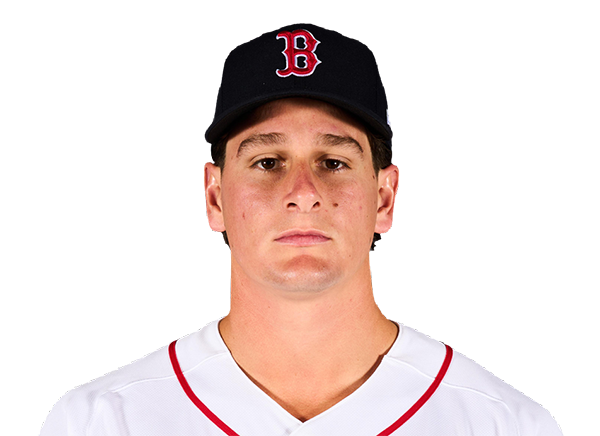 Roman Anthony |
1-5 | 5 | 1 | 1 | 2 | 1 | 0 | 3 | 23 | .236 | .344 | .382 |
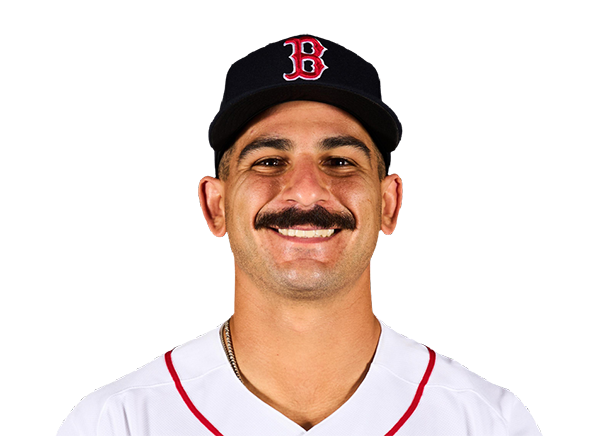 Mickey Gasper |
0-4 | 4 | 0 | 0 | 0 | 0 | 0 | 1 | 18 | .264 | .376 | .479 |
 Wilyer Abreu |
1-3 | 3 | 1 | 1 | 1 | 1 | 1 | 0 | 20 | .256 | .337 | .465 |
 Trevor Story |
1-4 | 4 | 0 | 1 | 0 | 0 | 0 | 1 | 15 | .233 | .263 | .335 |
 Nick Sogard |
1-4 | 4 | 0 | 1 | 0 | 0 | 0 | 2 | 20 | .266 | .362 | .402 |
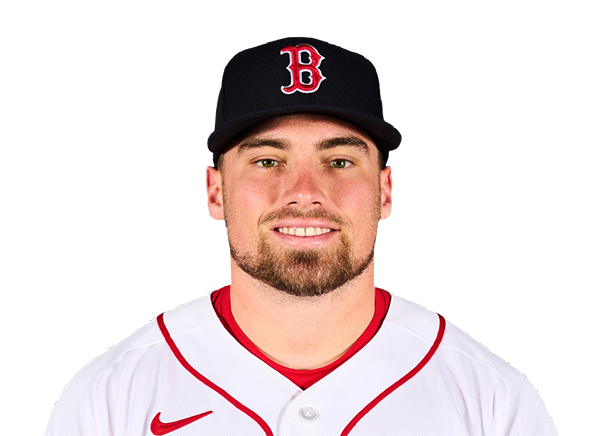 Caleb Durbin |
1-4 | 4 | 0 | 1 | 0 | 0 | 0 | 1 | 17 | .248 | .328 | .379 |
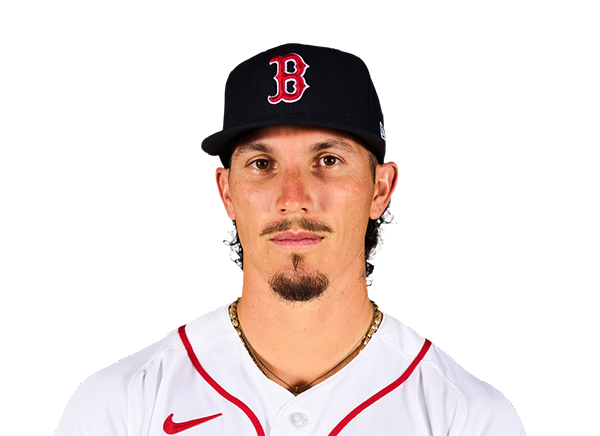 Jarren Duran |
2-3 | 3 | 2 | 2 | 0 | 0 | 1 | 0 | 17 | .207 | .263 | .367 |
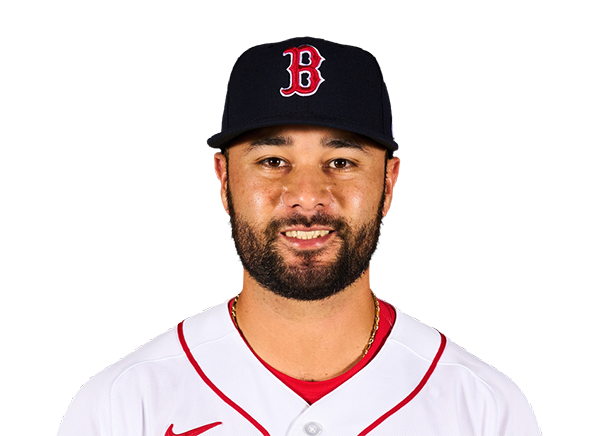 Isiah Kiner-Falefa |
0-4 | 4 | 0 | 0 | 0 | 0 | 0 | 0 | 12 | .269 | .342 | .351 |
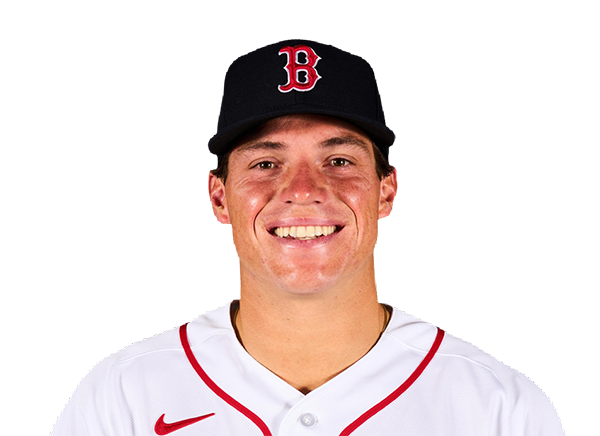 Nate Eaton |
1-4 | 4 | 0 | 1 | 1 | 0 | 0 | 0 | 15 | .139 | .279 | .278 |
Los Angeles Angels
| Player | IP | H | R | ER | BB | K | HR | PC-ST | ERA | PC |
|---|---|---|---|---|---|---|---|---|---|---|
 Ryan Johnson |
6.0 | 5 | 3 | 3 | 1 | 5 | 2 | 103-67 | 5.12 | 103 |
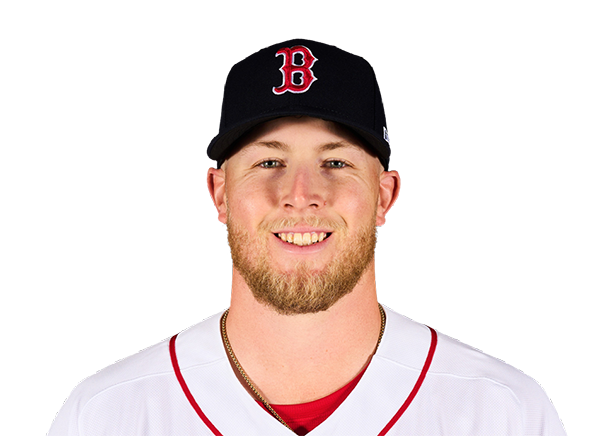 Ryan Watson |
0.2 | 1 | 0 | 0 | 0 | 0 | 0 | 6-4 | 4.19 | 6 |
 Tayler Saucedo |
0.1 | 0 | 0 | 0 | 0 | 1 | 0 | 6-3 | 3.24 | 6 |
 Samy Natera Jr. |
1.0 | 1 | 0 | 0 | 0 | 1 | 0 | 20-13 | 2.35 | 20 |
 Ben Joyce |
1.0 | 1 | 1 | 1 | 1 | 1 | 0 | 22-13 | 3.18 | 22 |
Boston Red Sox
| Player | IP | H | R | ER | BB | K | HR | PC-ST | ERA | PC |
|---|---|---|---|---|---|---|---|---|---|---|
 Jake Bennett |
5.1 | 9 | 6 | 6 | 1 | 2 | 3 | 78-54 | 3.69 | 78 |
 Wyatt Olds |
1.2 | 1 | 0 | 0 | 1 | 1 | 0 | 20-12 | 1.38 | 20 |
 Jovani Moran |
1.0 | 0 | 0 | 0 | 0 | 1 | 0 | 12-9 | 3.41 | 12 |
 Alec Gamboa |
1.0 | 2 | 0 | 0 | 0 | 1 | 0 | 12-9 | 1.29 | 12 |
H2H / Season Series
BOS4–6
LAA
BOS1–6
LAA
BOS5–2
LAA
LAA5–7
BOS
LAA1–8
BOS
LAA2–5
BOS
Last 5 Games
| Date | Opponent | Result |
|---|---|---|
| Sep 9 | @ BOS | W6–4 |
| Sep 8 | @ BOS | W6–1 |
| Sep 7 | @ BOS | L2–5 |
| Sep 6 |  @ PIT | L0–1 |
| Sep 5 | @ PIT | W6–1 |
| Date | Opponent | Result |
|---|---|---|
| Sep 9 | vs LAA | L4–6 |
| Sep 8 | vs LAA | L1–6 |
| Sep 7 | vs LAA | W5–2 |
| Sep 6 |  @ BAL | W3–1 |
| Sep 5 | @ BAL | W5–0 |
Standings
American League
| Team | W | L | PCT | GB | DIFF | STRK |
|---|---|---|---|---|---|---|
1 Rays | 87 | 58 | .600 | - | +58 | W2 |
2 White Sox | 75 | 70 | .517 | 12 | +41 | L2 |
3 Astros | 74 | 72 | .507 | 13.5 | -41 | L1 |
4 Yankees | 83 | 62 | .572 | 4 | +124 | W2 |
| 5Red Sox | 80 | 67 | .544 | 8 | +82 | L2 |
6 Guardians | 74 | 73 | .503 | 14 | -16 | L1 |
7 Blue Jays | 73 | 74 | .497 | 15 | -39 | L1 |
8 Rangers | 72 | 74 | .493 | 15.5 | -40 | L1 |
| 9Orioles | 71 | 76 | .483 | 17 | -27 | W1 |
10 Twins | 69 | 77 | .473 | 18.5 | -53 | L1 |
11 Mariners | 68 | 78 | .466 | 19.5 | -75 | W1 |
12 Tigers | 67 | 79 | .459 | 20.5 | +55 | W1 |
13 Royals | 65 | 82 | .442 | 23 | -88 | W1 |
14 Athletics | 59 | 88 | .401 | 29 | -187 | W1 |
| 15Angels | 56 | 90 | .384 | 31.5 | -73 | W2 |
National League
| Team | W | L | PCT | GB | DIFF | STRK |
|---|---|---|---|---|---|---|
1 Brewers | 91 | 56 | .619 | - | +172 | W3 |
2 Dodgers | 89 | 57 | .610 | 1.5 | +169 | W7 |
3 Braves | 85 | 61 | .582 | 5.5 | +108 | L3 |
4 Phillies | 82 | 64 | .562 | 8.5 | +38 | W1 |
5 Cubs | 81 | 66 | .551 | 10 | +128 | L4 |
6 Padres | 78 | 68 | .534 | 12.5 | +17 | W4 |
7 Diamondbacks | 78 | 69 | .531 | 13 | -1 | L1 |
| 8Pirates | 73 | 73 | .500 | 17.5 | +34 | W3 |
9 Marlins | 72 | 75 | .490 | 19 | +7 | L3 |
10 Cardinals | 72 | 75 | .490 | 19 | -12 | L3 |
11 Reds | 69 | 77 | .473 | 21.5 | -122 | L3 |
12 Mets | 68 | 78 | .466 | 22.5 | -40 | W4 |
13 Nationals | 67 | 81 | .453 | 24.5 | 0 | L7 |
14 Giants | 62 | 85 | .422 | 29 | -72 | W3 |
15 Rockies | 55 | 90 | .379 | 35 | -147 | L3 |
LAA
VS
BOS
Pitchers
Ryan Johnson
Catchers
Tyler Heineman
Infielders
Zach Neto
Vaughn Grissom
Oswald Peraza
Denzer Guzman
Outfielders
Mike Trout
Jose Siri
Kyren Paris
Designated Hitters
Christian Moore
Pitchers
Jake Bennett
Catchers
Mickey Gasper
Infielders
Trevor Story
Nick Sogard
Caleb Durbin
Isiah Kiner-Falefa
Outfielders
Wilyer Abreu
Jarren Duran
Nate Eaton
Designated Hitters
Roman Anthony
Angels
VS
Red Sox
Batting
146
Team Games Played
147
4879
At Bats
4936
1148
Hits
1223
565
Runs Batted In
623
141
Home Runs
153
79
Stolen Bases
99
.235
Batting Average
.248
591
Runs
652
221
Doubles
264
13
Triples
24
1818
Total Bases
1994
445
Walks
474
1382
Strikeouts
1195
.309
On Base Percentage
.322
.373
Slugging Percentage
.404
.682
OBP Pct + SLG Pct
.726
146
Games Played
147
146
Games Started
147
88
Hit By Pitch
87
0.0
Wins Above Replacement
0.0
0.0
Offensive Wins Above Replacement
0.0
23
Caught Stealing
37
1
Is Qualified
1
565.1
Runs Created
657.5
3.9
Runs Created Per 27 Outs
4.5
.081
Walks Per Plate Appearance
.085
0.32
Walk To Strikeout Ratio
0.40
.137
Isolated Power
.156
.240
Secondary Average
.265
3.92
Pitches Per Plate Appearance
3.84
375
Extra Base Hits
441
5469
Plate Appearances
5577
34.6
At Bats Per Home Run
32.3
27
Sacrifice Hit
31
27
Sacrifice Flies
46
Pitching
146
Team Games Played
147
50
Quality Starts
58
56
Wins
80
90
Losses
67
22
Saves
41
82
Holds
86
1136
Hits
1198
601
Earned runs
527
152
Home Runs
146
587
Walks
422
1304
Strikeouts
1267
9.1
Strikeouts Per 9 Innings
8.7
152.2
Pitches Per Start
140.7
1.34
Walks Plus Hits Per Inning Pitched
1.24
4.20
Earned Run Average
3.63
90
Losses
67
1289.0
Innings pitched
1308.1
.384
Win Percentage
.544
47
Save Opportunities
54
.235
Opponent Batting Average
.243
.324
Opponent's On-base pct.
.308
.378
Opponent's Slugging pct.
.382
.702
Opponent's OPB Pct + SLG Pct
.689
4837
At Bats
4934
200
Doubles
229
17
Triples
9
72
Batters Hit
59
97
Stolen Bases
103
146
Games Played
147
1
Complete Games
0
11
Shutouts
16
58
Wild Pitches
30
631
Runs Batted In
545
3
Balks
3
1289.0
Innings pitched
1308.1
9.1
Strikeouts Per 9 Innings
8.7
29
Caught Stealing
19
146
Games Started
147
0.0
Wins Above Replacement
0.0
1
Is Qualified
1
664
Runs
570
601
Earned Runs
527
1826
Total Bases
1883
Fielding
146
Team Games Played
147
1289
Full Innings
1308
5163
Total Chances
5279
3867
Putouts
3925
1217
Assists
1279
79
Errors
75
221
Double Plays
264
0.985
Fielding Percentage
0.986
35.5
Range Factor
35.8
0.0
Zone Rating
0.0
146
Games Played
147
0
Games Started
0
0.0
Defensive Wins Above Replacement
0.0
1
Qualified
1