

Astros vs Yankees Live Score (27 Aug, 2026)
Game Information
Stage
STD
Season
2026
First Pitch
Thu, Aug 27, 7:05 pm
Venue
Yankee Stadium
Location
Bronx, New York
Venue Type
Outdoor
Broadcast
MLB.TV
Attendance
41,203
Live Situation
0Balls
0Strikes
0Outs
—Pitcher
—At Bat
Pitch Sequence
1
BALL IN PLAY
Slider
84 MPH
Injury Report

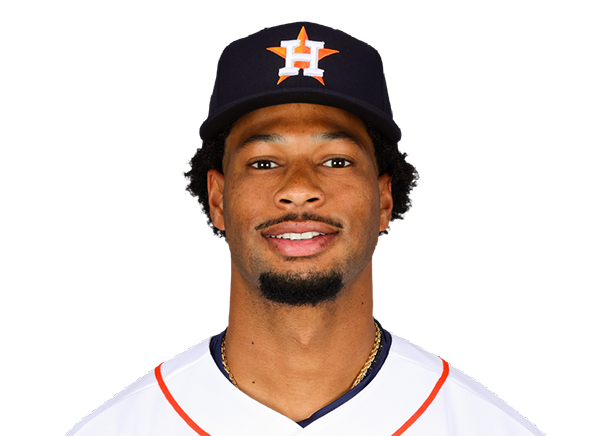
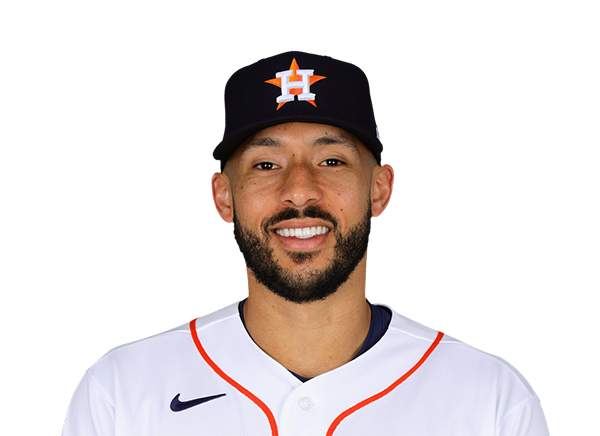
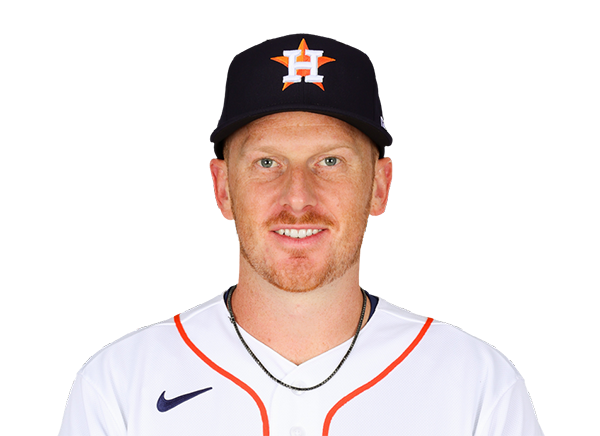

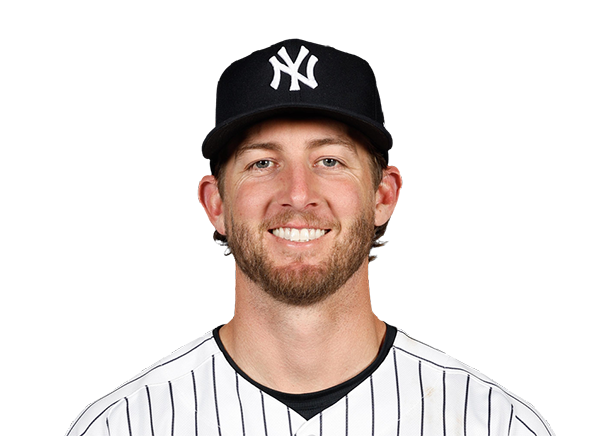
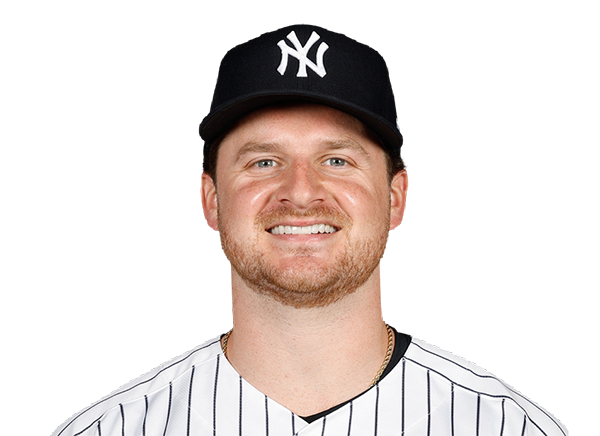
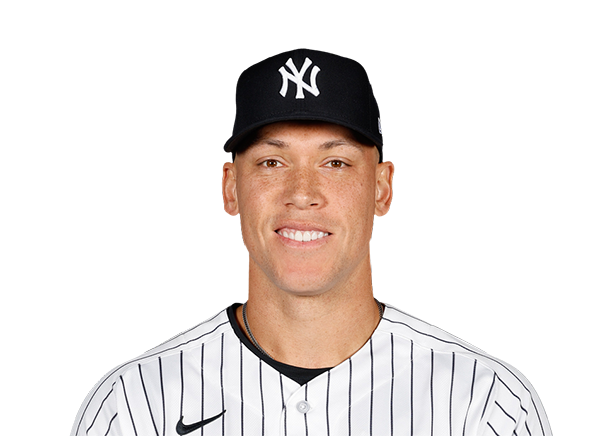
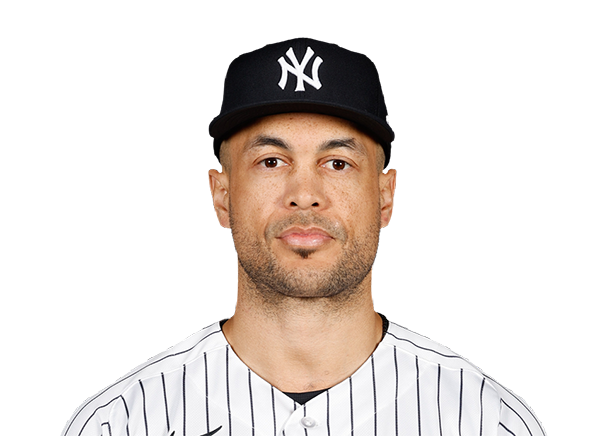
Team Stats
 HOU
NYY


5
Runs
1
9
Hits
5
0
Errors
2
2
Home Runs
0
2
Walks
2
8
Strikeouts
11
Player Box Score
Houston Astros
| Player | H-AB | AB | R | H | RBI | HR | BB | K | #P | AVG | OBP | SLG |
|---|---|---|---|---|---|---|---|---|---|---|---|---|
 Jeremy Pena | 1-4 | 4 | 2 | 1 | 1 | 1 | 0 | 2 | 13 | .282 | .336 | .477 |
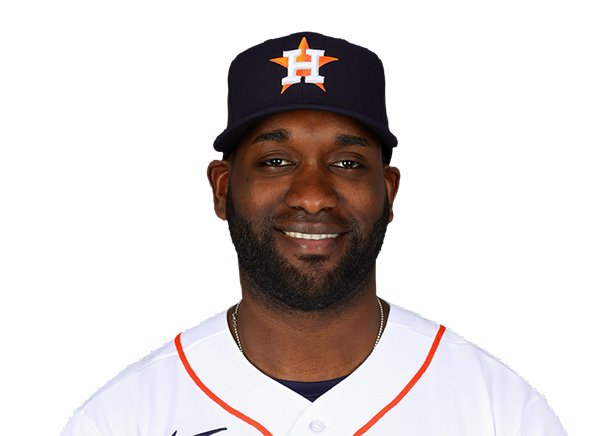 Yordan Alvarez | 0-4 | 4 | 0 | 0 | 0 | 0 | 0 | 3 | 17 | .319 | .434 | .609 |
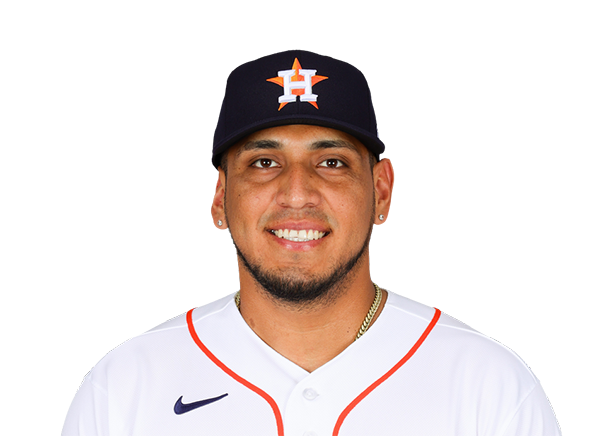 Isaac Paredes | 2-4 | 4 | 0 | 2 | 1 | 0 | 1 | 1 | 16 | .261 | .357 | .425 |
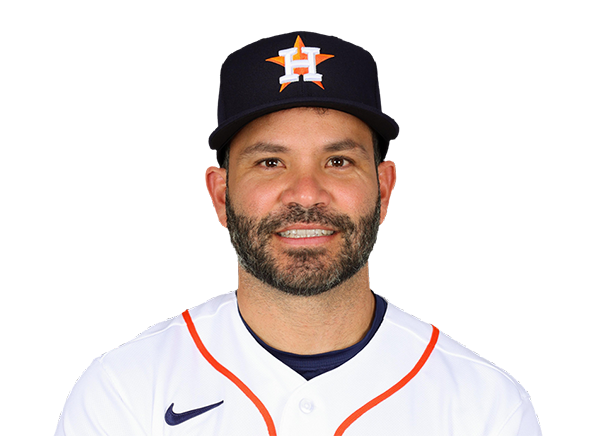 Jose Altuve | 0-4 | 4 | 0 | 0 | 0 | 0 | 0 | 0 | 14 | .245 | .309 | .397 |
 Nick Allen | 1-1 | 1 | 0 | 1 | 0 | 0 | 0 | 0 | 2 | .264 | .308 | .347 |
 Daulton Varsho | 0-4 | 4 | 1 | 0 | 0 | 0 | 1 | 2 | 26 | .234 | .298 | .370 |
 Christian Walker | 3-4 | 4 | 2 | 3 | 2 | 1 | 0 | 0 | 8 | .233 | .308 | .441 |
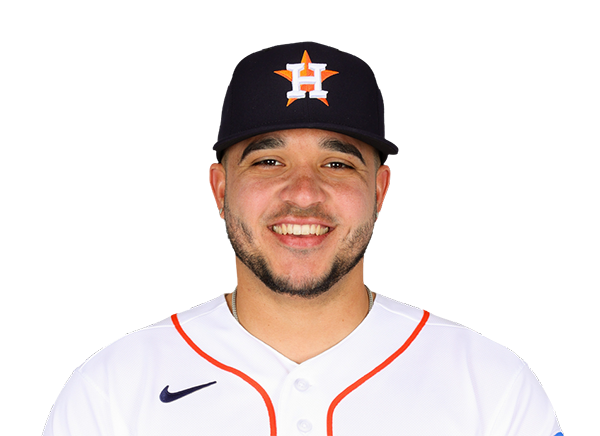 Yainer Diaz | 1-4 | 4 | 0 | 1 | 0 | 0 | 0 | 0 | 12 | .261 | .289 | .419 |
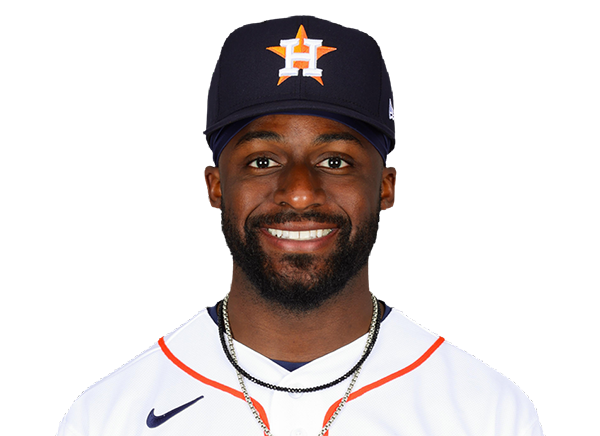 Taylor Trammell | 1-4 | 4 | 0 | 1 | 0 | 0 | 0 | 0 | 11 | .209 | .295 | .367 |
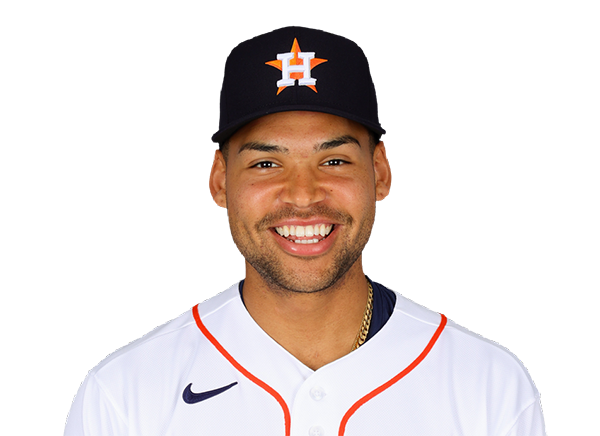 Cam Smith | 0-4 | 4 | 0 | 0 | 0 | 0 | 0 | 0 | 8 | .214 | .281 | .387 |
New York Yankees
| Player | H-AB | AB | R | H | RBI | HR | BB | K | #P | AVG | OBP | SLG |
|---|---|---|---|---|---|---|---|---|---|---|---|---|
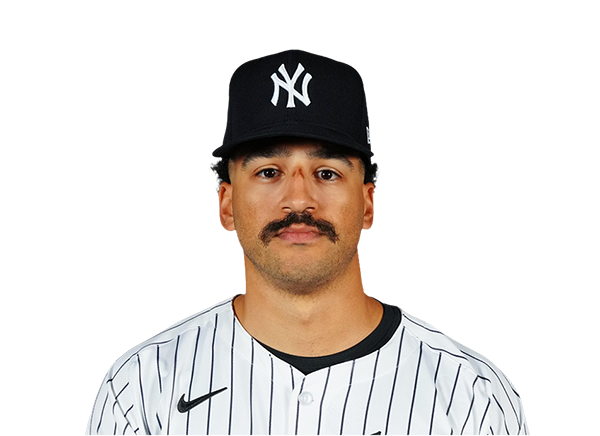 Trent Grisham | 0-4 | 4 | 0 | 0 | 0 | 0 | 0 | 1 | 17 | .217 | .314 | .412 |
 Ben Rice | 2-4 | 4 | 1 | 2 | 0 | 0 | 0 | 0 | 15 | .253 | .351 | .531 |
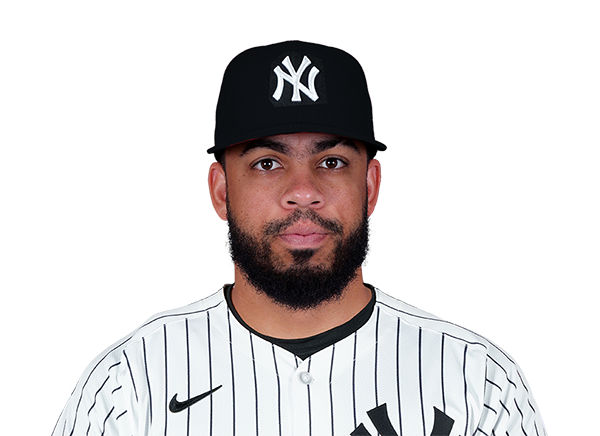 Luis Garcia Jr. | 0-4 | 4 | 0 | 0 | 0 | 0 | 0 | 2 | 18 | .284 | .317 | .557 |
 Cody Bellinger | 0-2 | 2 | 0 | 0 | 1 | 0 | 1 | 0 | 25 | .256 | .345 | .421 |
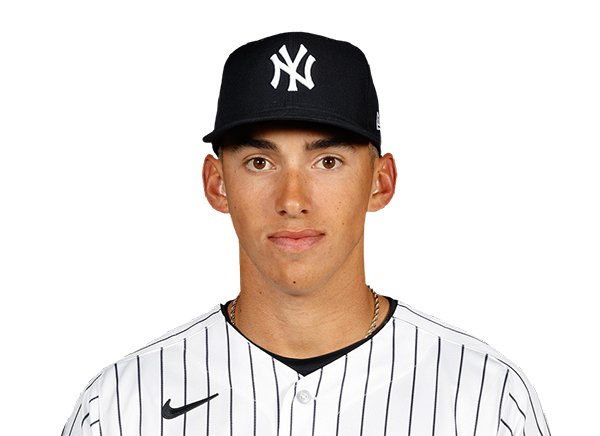 George Lombard Jr. | 1-4 | 4 | 0 | 1 | 0 | 0 | 0 | 2 | 12 | .264 | .316 | .389 |
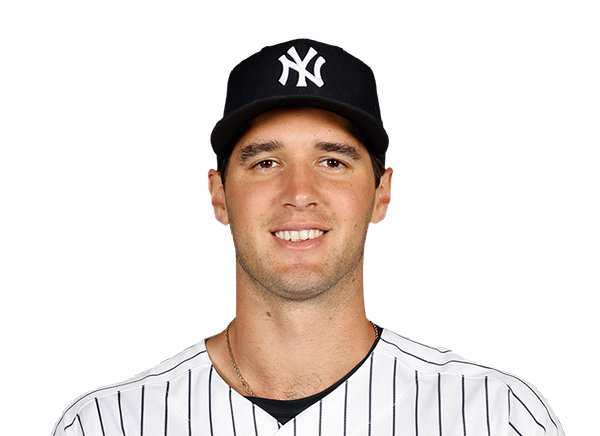 Spencer Jones | 0-3 | 3 | 0 | 0 | 0 | 0 | 0 | 1 | 13 | .229 | .307 | .418 |
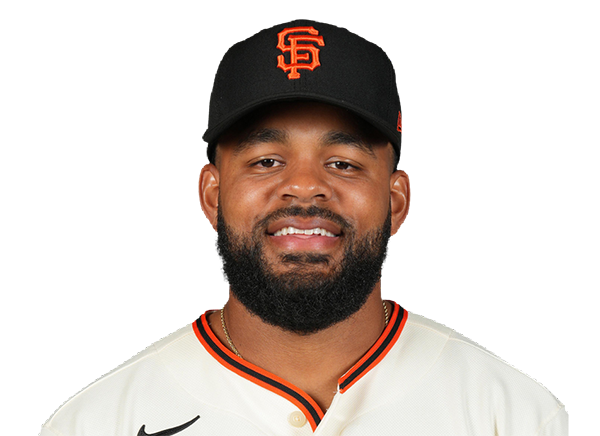 Heliot Ramos | 0-1 | 1 | 0 | 0 | 0 | 0 | 0 | 1 | 4 | .240 | .291 | .386 |
 Jazz Chisholm Jr. | 1-2 | 2 | 0 | 1 | 0 | 0 | 1 | 1 | 14 | .227 | .307 | .404 |
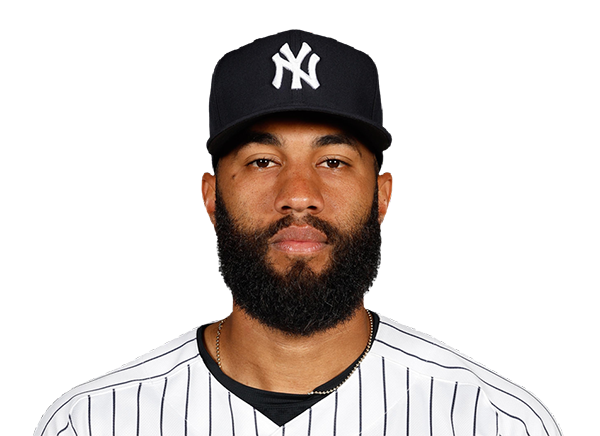 Amed Rosario | 0-1 | 1 | 0 | 0 | 0 | 0 | 0 | 0 | 1 | .225 | .271 | .422 |
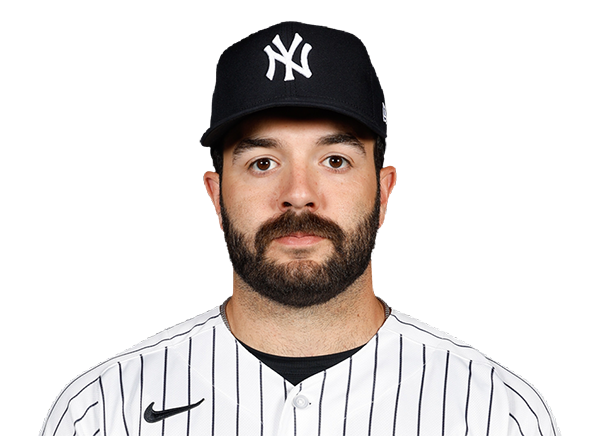 Austin Wells | 0-3 | 3 | 0 | 0 | 0 | 0 | 0 | 3 | 16 | .180 | .277 | .294 |
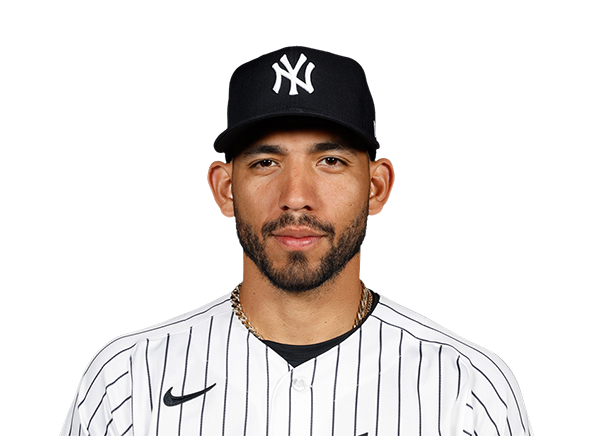 Jose Caballero | 1-3 | 3 | 0 | 1 | 0 | 0 | 0 | 0 | 8 | .234 | .291 | .370 |
Houston Astros
| Player | IP | H | R | ER | BB | K | HR | PC-ST | ERA | PC |
|---|---|---|---|---|---|---|---|---|---|---|
 Hayden Wesneski | 5.0 | 3 | 1 | 1 | 2 | 6 | 0 | 91-55 | 3.86 | 91 |
 Steven Okert | 1.0 | 1 | 0 | 0 | 0 | 0 | 0 | 12-8 | 2.17 | 12 |
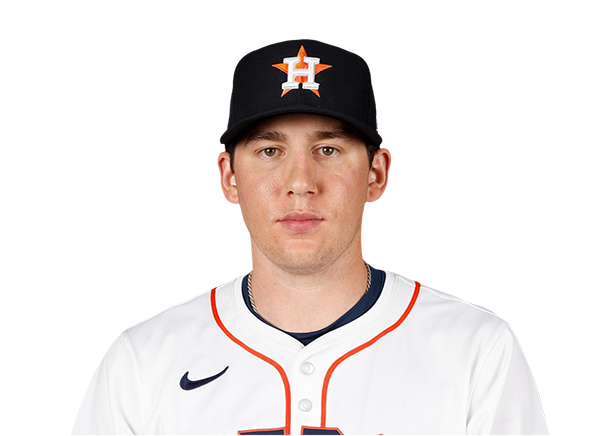 AJ Blubaugh | 2.0 | 1 | 0 | 0 | 0 | 3 | 0 | 32-21 | 3.17 | 32 |
 Josh Hader | 1.0 | 0 | 0 | 0 | 0 | 2 | 0 | 8-7 | 0.79 | 8 |
New York Yankees
| Player | IP | H | R | ER | BB | K | HR | PC-ST | ERA | PC |
|---|---|---|---|---|---|---|---|---|---|---|
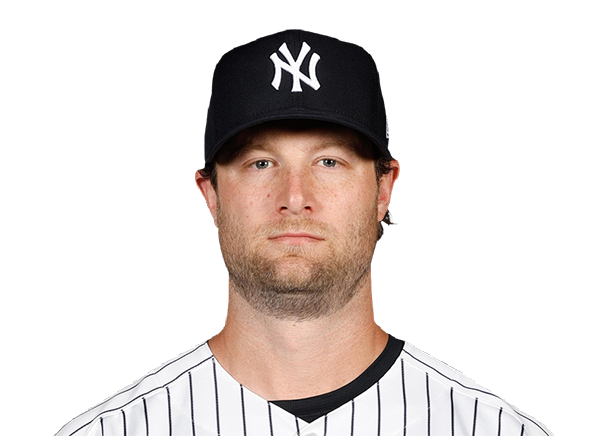 Gerrit Cole | 6.0 | 6 | 3 | 3 | 1 | 5 | 1 | 79-59 | 3.19 | 79 |
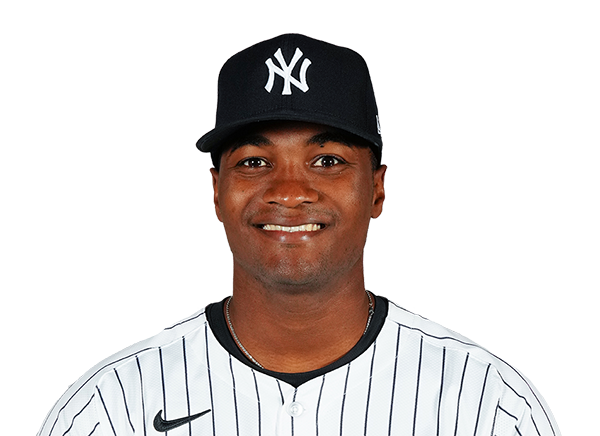 Yerry De los Santos | 1.0 | 1 | 1 | 1 | 0 | 1 | 1 | 14-8 | 1.45 | 14 |
 Justin Topa | 2.0 | 2 | 1 | 0 | 1 | 2 | 0 | 34-23 | 7.29 | 34 |
H2H / Season Series
NYY1–5
HOU
NYY9–3
HOU
NYY7–9
HOU
HOU7–4
NYY
HOU3–8
NYY
HOU4–12
NYY
Last 5 Games
| Date | Opponent | Result |
|---|---|---|
| Aug 27 | @ NYY | W5–1 |
| Aug 26 | @ NYY | L3–9 |
| Aug 25 | @ NYY | W9–7 |
| Aug 23 |  vs ATH | L6–7 |
| Aug 22 | vs ATH | L3–4 |
| Date | Opponent | Result |
|---|---|---|
| Aug 27 | vs HOU | L1–5 |
| Aug 26 | vs HOU | W9–3 |
| Aug 25 | vs HOU | L7–9 |
| Aug 23 |  vs TOR | W8–3 |
| Aug 22 | vs TOR | L3–4 |
Standings
American League
| Team | W | L | PCT | GB | DIFF | STRK |
|---|---|---|---|---|---|---|
1 Rays | 79 | 54 | .594 | - | +47 | W1 |
2 White Sox | 70 | 63 | .526 | 9 | +44 | W2 |
| 3Astros | 67 | 67 | .500 | 12.5 | -44 | W1 |
| 4Yankees | 75 | 58 | .564 | 4 | +100 | L1 |
5 Red Sox | 73 | 60 | .549 | 6 | +101 | L1 |
6 Guardians | 68 | 66 | .507 | 11.5 | -4 | W7 |
7 Rangers | 66 | 68 | .493 | 13.5 | -47 | L2 |
8 Orioles | 65 | 69 | .485 | 14.5 | -24 | L1 |
| 9Blue Jays | 65 | 70 | .481 | 15 | -65 | L1 |
10 Mariners | 64 | 70 | .478 | 15.5 | -57 | L1 |
11 Twins | 64 | 70 | .478 | 15.5 | -56 | L2 |
12 Tigers | 62 | 71 | .466 | 17 | +70 | L1 |
13 Royals | 60 | 75 | .444 | 20 | -81 | W1 |
| 14Athletics | 53 | 81 | .396 | 26.5 | -185 | W2 |
15 Angels | 52 | 82 | .388 | 27.5 | -75 | L4 |
National League
| Team | W | L | PCT | GB | DIFF | STRK |
|---|---|---|---|---|---|---|
1 Brewers | 83 | 51 | .619 | - | +173 | W2 |
2 Dodgers | 80 | 54 | .597 | 3 | +148 | L3 |
3 Braves | 79 | 55 | .590 | 4 | +113 | W4 |
4 Cubs | 76 | 58 | .567 | 7 | +119 | L2 |
5 Phillies | 74 | 60 | .552 | 9 | +23 | W1 |
6 Padres | 72 | 62 | .537 | 11 | +17 | W1 |
7 Diamondbacks | 71 | 63 | .530 | 12 | +5 | W2 |
8 Marlins | 68 | 66 | .507 | 15 | +19 | W1 |
9 Cardinals | 67 | 68 | .496 | 16.5 | -13 | W1 |
10 Pirates | 65 | 70 | .481 | 18.5 | +24 | L1 |
11 Reds | 63 | 71 | .470 | 20 | -100 | W1 |
12 Nationals | 63 | 73 | .463 | 21 | +12 | W1 |
13 Mets | 60 | 74 | .448 | 23 | -52 | L2 |
14 Giants | 54 | 79 | .406 | 28.5 | -74 | L1 |
15 Rockies | 52 | 82 | .388 | 31 | -138 | L1 |
HOU
VS
NYY
Pitchers
Hayden Wesneski
Steven Okert
AJ Blubaugh
Josh Hader
Catchers
Yainer Diaz
Infielders
Jeremy Pena
Isaac Paredes
Jose Altuve
Nick Allen
Christian Walker
Outfielders
Daulton Varsho
Taylor Trammell
Cam Smith
Designated Hitters
Yordan Alvarez
Pitchers
Gerrit Cole
Yerry De los Santos
Justin Topa
Catchers
Austin Wells
Infielders
Luis Garcia Jr.
George Lombard Jr.
Jazz Chisholm Jr.
Jose Caballero
Outfielders
Trent Grisham
Cody Bellinger
Spencer Jones
Designated Hitters
Ben Rice
Other Players
Heliot Ramos
Amed Rosario
Astros
VS
Yankees
Batting
133
Team Games Played
132
4474
At Bats
4360
1084
Hits
1008
579
Runs Batted In
567
177
Home Runs
183
40
Stolen Bases
128
.242
Batting Average
.231
608
Runs
595
196
Doubles
196
15
Triples
16
1841
Total Bases
1785
443
Walks
483
1091
Strikeouts
1215
.317
On Base Percentage
.311
.411
Slugging Percentage
.409
.728
OBP Pct + SLG Pct
.720
133
Games Played
132
0
Games Started
0
61
Hit By Pitch
34
0.0
Wins Above Replacement
0.0
0.0
Offensive Wins Above Replacement
0.0
19
Caught Stealing
42
1
Is Qualified
1
584.9
Runs Created
569.6
4.4
Runs Created Per 27 Outs
4.4
.088
Walks Per Plate Appearance
.098
0.41
Walk To Strikeout Ratio
0.40
.169
Isolated Power
.178
.273
Secondary Average
.309
3.88
Pitches Per Plate Appearance
3.99
388
Extra Base Hits
395
5031
Plate Appearances
4918
25.3
At Bats Per Home Run
23.8
17
Sacrifice Hit
7
34
Sacrifice Flies
30
Pitching
133
Team Games Played
132
36
Quality Starts
53
66
Wins
75
67
Losses
57
40
Saves
39
65
Holds
72
1070
Hits
986
614
Earned runs
424
177
Home Runs
131
550
Walks
402
1161
Strikeouts
1183
8.9
Strikeouts Per 9 Innings
9.0
152.6
Pitches Per Start
144.8
1.37
Walks Plus Hits Per Inning Pitched
1.18
4.68
Earned Run Average
3.23
67
Losses
57
1180.1
Innings pitched
1179.2
.496
Win Percentage
.568
49
Save Opportunities
65
.241
Opponent Batting Average
.225
.333
Opponent's On-base pct.
.295
.409
Opponent's Slugging pct.
.365
.742
Opponent's OPB Pct + SLG Pct
.660
4437
At Bats
4388
175
Doubles
187
19
Triples
18
79
Batters Hit
47
107
Stolen Bases
62
133
Games Played
132
0
Complete Games
0
8
Shutouts
12
44
Wild Pitches
30
626
Runs Batted In
470
5
Balks
3
1180.1
Innings pitched
1179.2
8.9
Strikeouts Per 9 Innings
9.0
36
Caught Stealing
18
133
Games Started
132
0.0
Wins Above Replacement
0.0
1
Is Qualified
1
656
Runs
491
614
Earned Runs
424
1814
Total Bases
1602
Fielding
133
Team Games Played
132
1180
Full Innings
1180
4583
Total Chances
4769
3541
Putouts
3539
982
Assists
1156
60
Errors
74
196
Double Plays
196
0.987
Fielding Percentage
0.984
34.5
Range Factor
35.8
0.0
Zone Rating
0.0
133
Games Played
132
0
Games Started
0
0.0
Defensive Wins Above Replacement
0.0
1
Qualified
1