

Athletics vs Diamondbacks Live Score (22 Jul, 2026)
Game Information
Stage
Standard
Season
2026
First Pitch
Wed, Jul 22, 3:40 pm
Venue
Chase Field
Location
Phoenix, Arizona
Attendance
19,343
Live Situation
1Balls
0Strikes
0Outs
—Pitcher
—At Bat
Pitch Sequence
1
BALL
Eephus Pitch
40 MPH
2
BALL IN PLAY
Eephus Pitch
48 MPH
Injury Report
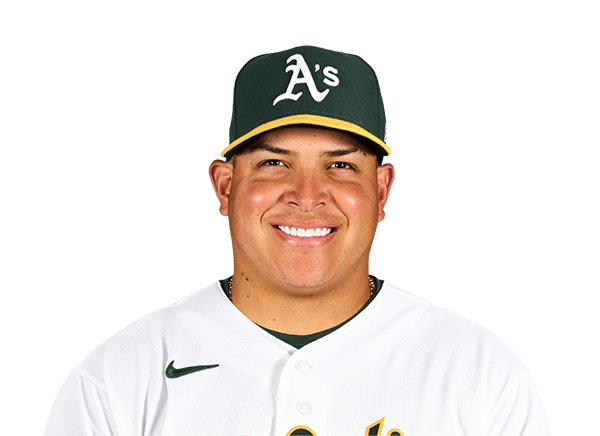


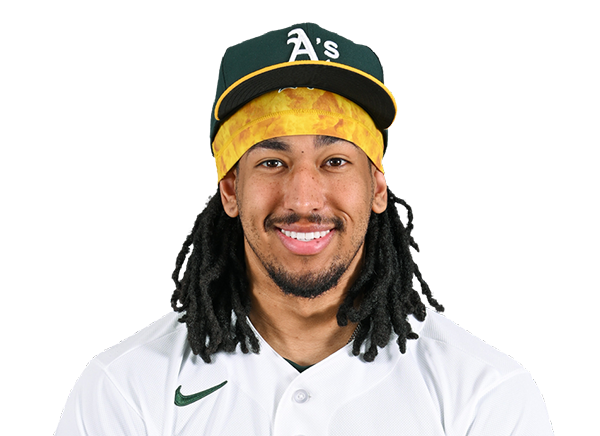



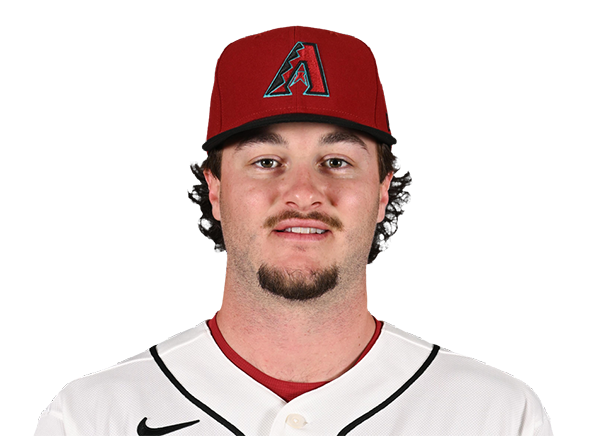
Team Stats
 ATH
ARI


5
Runs
15
10
Hits
17
0
Errors
0
1
Home Runs
5
3
Walks
8
5
Strikeouts
8
Player Box Score
Athletics
| Player | H-AB | AB | R | H | RBI | HR | BB | K | #P | AVG | OBP | SLG |
|---|---|---|---|---|---|---|---|---|---|---|---|---|
 Jacob Wilson | 1-4 | 4 | 0 | 1 | 0 | 0 | 0 | 1 | 15 | .291 | .322 | .422 |
 Alika Williams | 0-0 | 0 | 0 | 0 | 1 | 0 | 0 | 0 | 5 | .272 | .299 | .435 |
 Tyler Soderstrom | 1-3 | 3 | 0 | 1 | 1 | 0 | 0 | 0 | 20 | .248 | .346 | .474 |
 Henry Bolte | 0-2 | 2 | 0 | 0 | 0 | 0 | 0 | 0 | 5 | .251 | .329 | .335 |
 Shea Langeliers | 2-3 | 3 | 0 | 2 | 0 | 0 | 0 | 1 | 18 | .263 | .333 | .497 |
 Max Muncy | 0-1 | 1 | 0 | 0 | 0 | 0 | 0 | 1 | 4 | .223 | .298 | .389 |
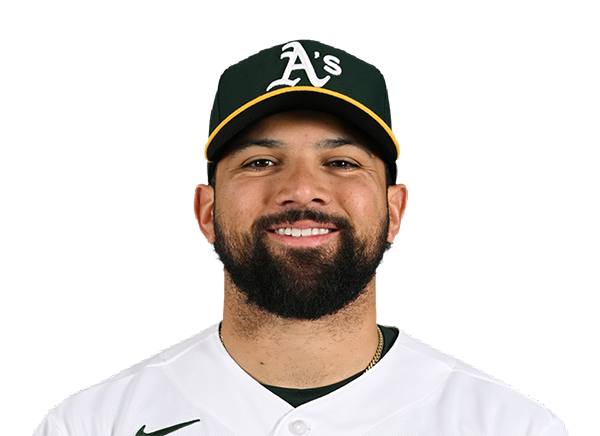 Carlos Cortes | 0-4 | 4 | 0 | 0 | 0 | 0 | 0 | 1 | 11 | .275 | .351 | .436 |
 Donovan Walton | 1-3 | 3 | 1 | 1 | 0 | 0 | 1 | 1 | 18 | .182 | .500 | .455 |
 Tommy White | 0-3 | 3 | 1 | 0 | 0 | 0 | 1 | 0 | 13 | .368 | .429 | .421 |
 Jeff McNeil | 2-4 | 4 | 2 | 2 | 1 | 1 | 0 | 0 | 19 | .238 | .301 | .321 |
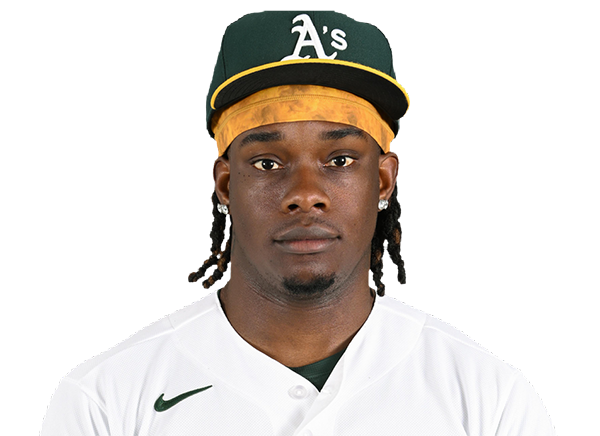 Lawrence Butler | 1-3 | 3 | 0 | 1 | 1 | 0 | 1 | 0 | 15 | .201 | .298 | .301 |
 Jonah Heim | 2-3 | 3 | 1 | 2 | 1 | 0 | 0 | 0 | 14 | .233 | .278 | .438 |
Arizona Diamondbacks
| Player | H-AB | AB | R | H | RBI | HR | BB | K | #P | AVG | OBP | SLG |
|---|---|---|---|---|---|---|---|---|---|---|---|---|
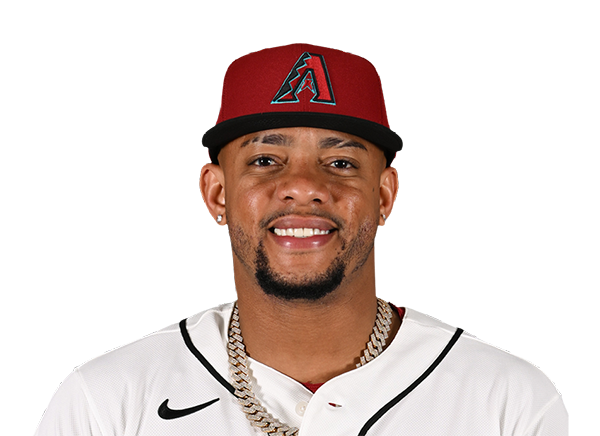 Ketel Marte | 2-4 | 4 | 1 | 2 | 0 | 0 | 0 | 1 | 10 | .258 | .313 | .461 |
 Tyler Locklear | 1-2 | 2 | 0 | 1 | 1 | 0 | 0 | 1 | 12 | .250 | .400 | .250 |
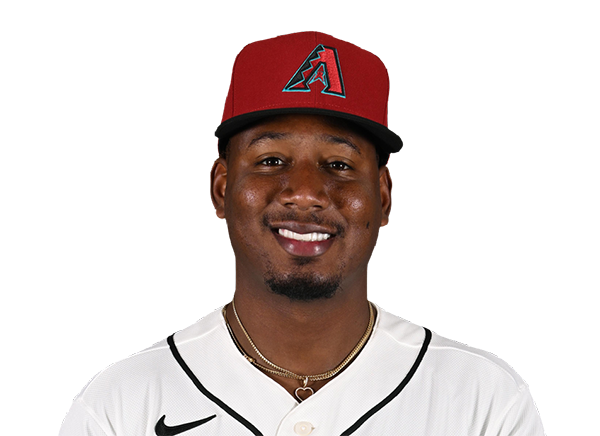 Geraldo Perdomo | 0-5 | 5 | 0 | 0 | 0 | 0 | 1 | 1 | 23 | .237 | .352 | .355 |
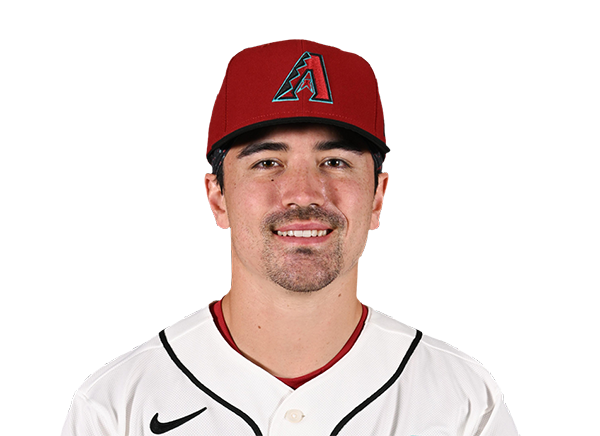 Corbin Carroll | 2-4 | 4 | 2 | 2 | 1 | 1 | 0 | 0 | 15 | .252 | .344 | .490 |
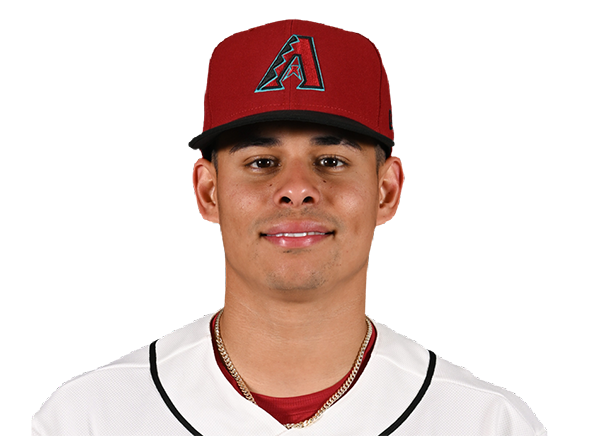 Jorge Barrosa | 0-0 | 0 | 0 | 0 | 0 | 0 | 1 | 0 | 4 | .193 | .278 | .353 |
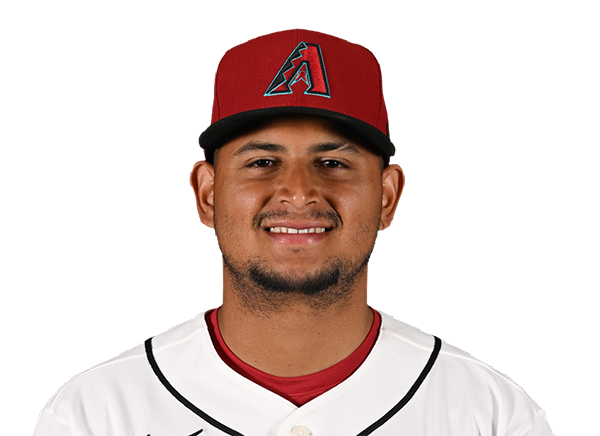 Gabriel Moreno | 1-4 | 4 | 2 | 1 | 1 | 1 | 1 | 1 | 24 | .302 | .391 | .442 |
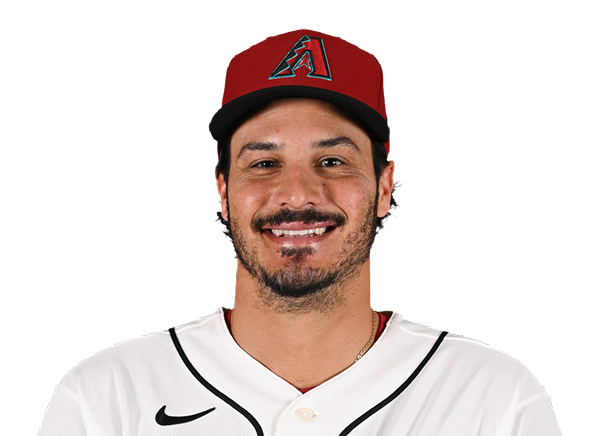 Nolan Arenado | 1-1 | 1 | 3 | 1 | 1 | 1 | 3 | 0 | 16 | .245 | .323 | .430 |
 Max Kepler | 0-1 | 1 | 0 | 0 | 0 | 0 | 0 | 0 | 3 | .235 | .281 | .412 |
 Ildemaro Vargas | 3-4 | 4 | 3 | 3 | 1 | 0 | 1 | 0 | 16 | .264 | .310 | .403 |
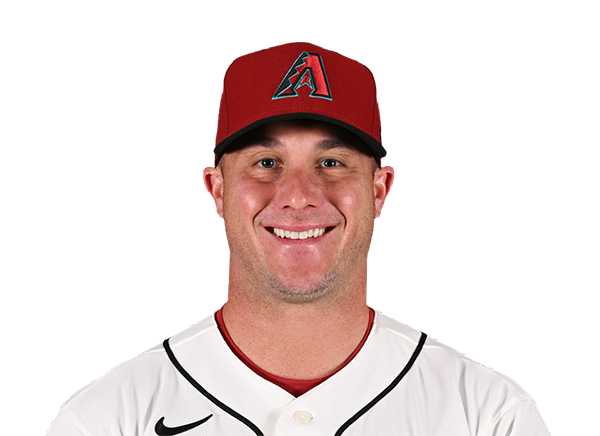 James McCann | 3-4 | 4 | 2 | 3 | 3 | 1 | 1 | 1 | 20 | .257 | .276 | .419 |
 Tim Tawa | 2-5 | 5 | 1 | 2 | 2 | 0 | 0 | 2 | 19 | .217 | .282 | .396 |
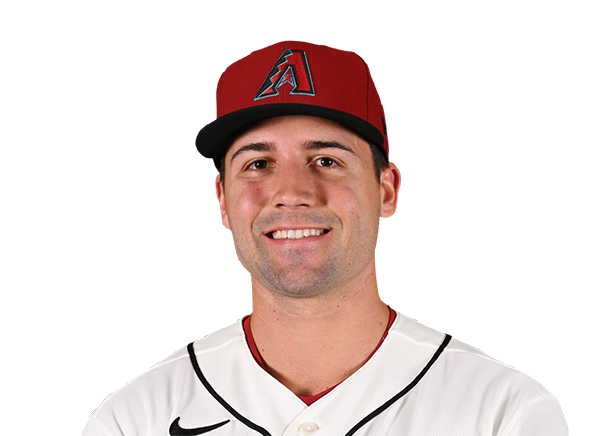 Ryan Waldschmidt | 2-4 | 4 | 1 | 2 | 3 | 1 | 0 | 1 | 10 | .260 | .308 | .374 |
Athletics
| Player | IP | H | R | ER | BB | K | HR | PC-ST | ERA | PC |
|---|---|---|---|---|---|---|---|---|---|---|
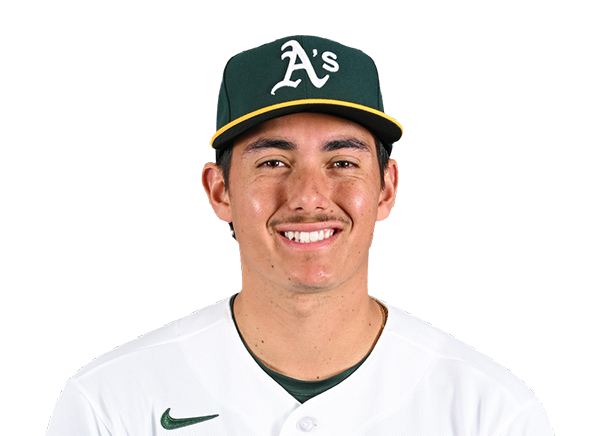 Gage Jump | 4.2 | 8 | 6 | 6 | 4 | 5 | 3 | 83-48 | 4.42 | 83 |
 Yunior Tur | 0.2 | 5 | 8 | 8 | 3 | 1 | 2 | 40-21 | 47.25 | 40 |
 Hayden Juenger | 2.1 | 4 | 1 | 1 | 1 | 2 | 0 | 45-31 | 8.31 | 45 |
|
Carlos Cortes | 0.1 | 0 | 0 | 0 | 0 | 0 | 0 | 4-2 | 10.50 | 4 |
Arizona Diamondbacks
| Player | IP | H | R | ER | BB | K | HR | PC-ST | ERA | PC |
|---|---|---|---|---|---|---|---|---|---|---|
 Merrill Kelly | 5.0 | 5 | 2 | 2 | 1 | 3 | 1 | 87-52 | 5.12 | 87 |
 Gerardo Carrillo | 2.0 | 3 | 1 | 1 | 1 | 1 | 0 | 42-25 | 4.50 | 42 |
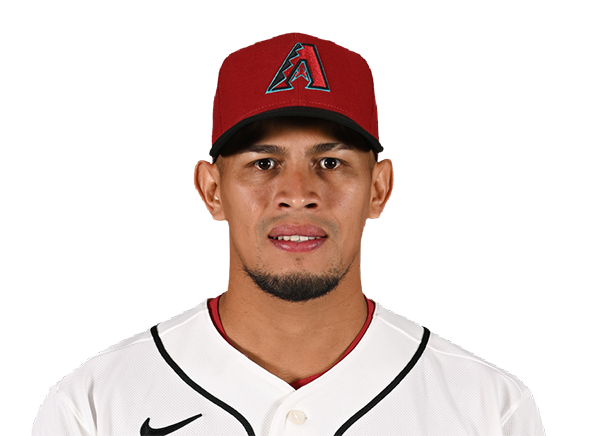 Jonathan Loaisiga | 1.0 | 0 | 0 | 0 | 0 | 1 | 0 | 8-6 | 2.03 | 8 |
|
Ildemaro Vargas | 1.0 | 2 | 2 | 2 | 1 | 0 | 0 | 20-9 | 6.75 | 20 |
H2H / Season Series
ARI15–5
ATH
ARI6–5
ATH
ARI2–5
ATH
ARI3–13
ATH
ATH1–3
ARI
Last 5 Games
| Date | Opponent | Result |
|---|---|---|
| Aug 22 |  @ HOU | W4–3 |
| Aug 21 | @ HOU | L0–4 |
| Aug 20 |  @ KC | L2–6 |
| Aug 19 | @ KC | L7–9 |
| Aug 18 | @ KC | L3–4 |
| Date | Opponent | Result |
|---|---|---|
| Aug 22 |  vs CIN | L5–11 |
| Aug 21 | vs CIN | W9–0 |
| Aug 19 |  @ BOS | W7–6 |
| Aug 18 | @ BOS | L4–9 |
| Aug 17 | @ BOS | L1–11 |
Standings
American League
| Team | W | L | PCT | GB | DIFF | STRK |
|---|---|---|---|---|---|---|
1 Rays | 76 | 53 | .589 | - | +42 | L3 |
2 White Sox | 67 | 62 | .519 | 9 | +42 | L1 |
| 3Astros | 65 | 65 | .500 | 11.5 | -43 | L1 |
4 Yankees | 73 | 56 | .566 | 3 | +95 | L1 |
| 5Red Sox | 70 | 59 | .543 | 6 | +98 | W2 |
6 Rangers | 64 | 66 | .492 | 12.5 | -48 | L1 |
7 Guardians | 64 | 66 | .492 | 12.5 | -14 | W3 |
8 Blue Jays | 64 | 67 | .489 | 13 | -50 | W1 |
9 Twins | 63 | 67 | .485 | 13.5 | -47 | L2 |
10 Orioles | 63 | 67 | .485 | 13.5 | -33 | W2 |
11 Mariners | 62 | 68 | .477 | 14.5 | -44 | W2 |
12 Tigers | 61 | 68 | .473 | 15 | +77 | L4 |
| 13Royals | 57 | 74 | .435 | 20 | -95 | W7 |
14 Angels | 52 | 78 | .400 | 24.5 | -68 | W1 |
| 15Athletics | 50 | 80 | .385 | 26.5 | -188 | W1 |
National League
| Team | W | L | PCT | GB | DIFF | STRK |
|---|---|---|---|---|---|---|
1 Brewers | 81 | 49 | .623 | - | +163 | W3 |
2 Dodgers | 79 | 51 | .608 | 2 | +147 | W5 |
3 Braves | 75 | 55 | .577 | 6 | +108 | L2 |
4 Cubs | 74 | 56 | .569 | 7 | +98 | L3 |
5 Phillies | 72 | 58 | .554 | 9 | +25 | W8 |
6 Padres | 70 | 60 | .538 | 11 | +9 | W2 |
| 7Diamondbacks | 68 | 62 | .523 | 13 | +7 | L1 |
8 Marlins | 66 | 64 | .508 | 15 | +17 | W2 |
9 Cardinals | 66 | 65 | .504 | 15.5 | 0 | L2 |
10 Pirates | 63 | 68 | .481 | 18.5 | +29 | L2 |
| 11Reds | 62 | 68 | .477 | 19 | -92 | W1 |
12 Nationals | 61 | 70 | .466 | 20.5 | +14 | L3 |
13 Mets | 59 | 71 | .454 | 22 | -39 | W1 |
14 Giants | 52 | 77 | .403 | 28.5 | -79 | L3 |
15 Rockies | 50 | 79 | .388 | 30.5 | -131 | L5 |
ATH
VS
ARI
Pitchers
Carlos Cortes
Gage Jump
Yunior Tur
Hayden Juenger
Catchers
Jonah Heim
Infielders
Jacob Wilson
Alika Williams
Donovan Walton
Tommy White
Jeff McNeil
Outfielders
Tyler Soderstrom
Henry Bolte
Max Muncy
Lawrence Butler
Designated Hitters
Shea Langeliers
Pitchers
Ildemaro Vargas
Merrill Kelly
Gerardo Carrillo
Jonathan Loaisiga
Catchers
James McCann
Infielders
Ketel Marte
Tyler Locklear
Geraldo Perdomo
Gabriel Moreno
Nolan Arenado
Tim Tawa
Outfielders
Corbin Carroll
Jorge Barrosa
Max Kepler
Ryan Waldschmidt
Athletics
VS
Diamondbacks
Batting
130
Team Games Played
130
4405
At Bats
4369
1074
Hits
1069
536
Runs Batted In
565
154
Home Runs
129
68
Stolen Bases
89
.244
Batting Average
.245
561
Runs
593
200
Doubles
226
11
Triples
33
1758
Total Bases
1748
434
Walks
439
1104
Strikeouts
944
.318
On Base Percentage
.318
.399
Slugging Percentage
.400
.717
OBP Pct + SLG Pct
.718
130
Games Played
130
130
Games Started
130
56
Hit By Pitch
47
0.0
Wins Above Replacement
0.0
0.0
Offensive Wins Above Replacement
0.0
27
Caught Stealing
20
1
Is Qualified
1
557.2
Runs Created
573.6
4.3
Runs Created Per 27 Outs
4.5
.088
Walks Per Plate Appearance
.089
0.39
Walk To Strikeout Ratio
0.47
.155
Isolated Power
.155
.263
Secondary Average
.272
3.81
Pitches Per Plate Appearance
3.94
365
Extra Base Hits
388
4937
Plate Appearances
4930
28.6
At Bats Per Home Run
33.9
18
Sacrifice Hit
32
22
Sacrifice Flies
40
Pitching
130
Team Games Played
130
27
Quality Starts
47
50
Wins
68
80
Losses
62
31
Saves
31
71
Holds
71
1214
Hits
1111
700
Earned runs
538
198
Home Runs
153
516
Walks
381
1091
Strikeouts
881
8.5
Strikeouts Per 9 Innings
6.9
153.8
Pitches Per Start
140.9
1.51
Walks Plus Hits Per Inning Pitched
1.29
5.48
Earned Run Average
4.20
80
Losses
62
1149.0
Innings pitched
1154.0
.385
Win Percentage
.523
57
Save Opportunities
46
.271
Opponent Batting Average
.253
.351
Opponent's On-base pct.
.317
.466
Opponent's Slugging pct.
.419
.817
Opponent's OPB Pct + SLG Pct
.736
4486
At Bats
4399
242
Doubles
220
21
Triples
26
63
Batters Hit
50
86
Stolen Bases
76
130
Games Played
130
1
Complete Games
1
6
Shutouts
8
38
Wild Pitches
26
727
Runs Batted In
571
8
Balks
5
1149.0
Innings pitched
1154.0
8.5
Strikeouts Per 9 Innings
6.9
34
Caught Stealing
17
130
Games Started
130
0.0
Wins Above Replacement
0.0
1
Is Qualified
1
749
Runs
586
700
Earned Runs
538
2092
Total Bases
1842
Fielding
130
Team Games Played
130
1149
Full Innings
1154
4486
Total Chances
4641
3447
Putouts
3462
976
Assists
1131
63
Errors
48
200
Double Plays
226
0.986
Fielding Percentage
0.990
34.6
Range Factor
35.8
0.0
Zone Rating
0.0
130
Games Played
130
0
Games Started
0
0.0
Defensive Wins Above Replacement
0.0
1
Qualified
1