

Athletics vs Orioles Live Score (10 May, 2026)
Game Information
Stage
Standard
Season
2026
First Pitch
Sun, May 10, 1:35 pm
Venue
Oriole Park at Camden Yards
Location
Baltimore, Maryland
Attendance
24,213
Live Situation
1Balls
0Strikes
0Outs
—Pitcher
—At Bat
Pitch Sequence
1
BALL
Slider
89 MPH
2
BALL IN PLAY
Curve
86 MPH
Injury Report
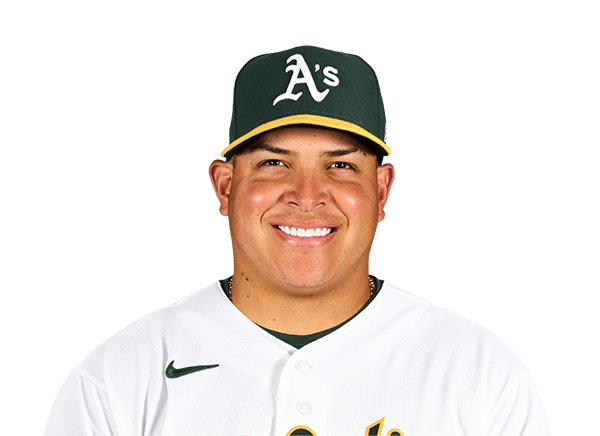
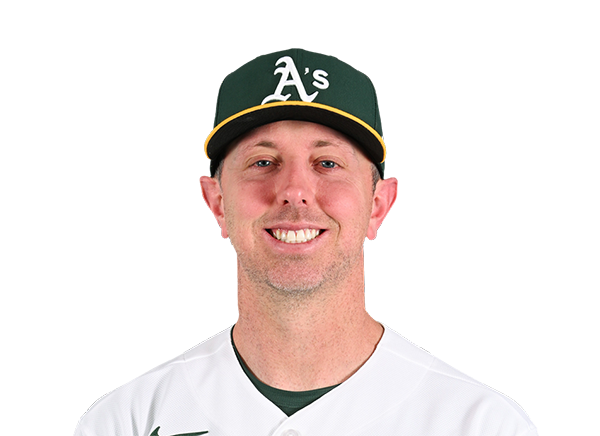
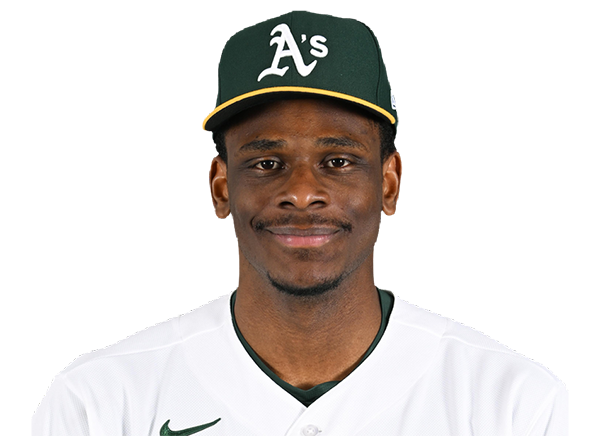
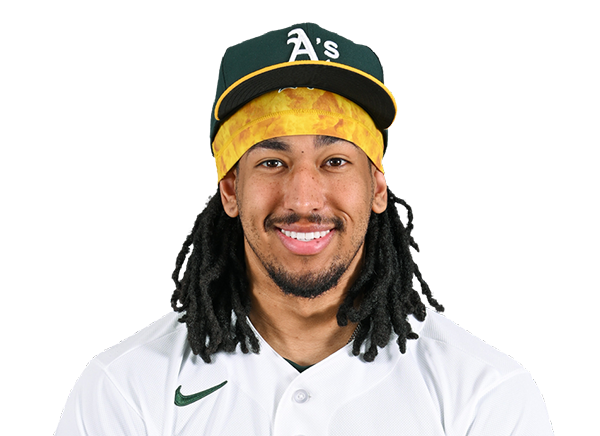


Team Stats
 ATH
BAL


1
Runs
2
4
Hits
6
0
Errors
1
0
Home Runs
0
4
Walks
5
10
Strikeouts
10
Player Box Score
Athletics
| Player | H-AB | AB | R | H | RBI | HR | BB | K | #P | AVG | OBP | SLG |
|---|---|---|---|---|---|---|---|---|---|---|---|---|
 Nick Kurtz | 0-3 | 3 | 0 | 0 | 0 | 0 | 1 | 2 | 15 | .259 | .414 | .427 |
 Shea Langeliers | 0-2 | 2 | 0 | 0 | 0 | 0 | 1 | 0 | 16 | .336 | .394 | .617 |
 Brent Rooker | 0-3 | 3 | 0 | 0 | 0 | 0 | 1 | 2 | 18 | .189 | .272 | .367 |
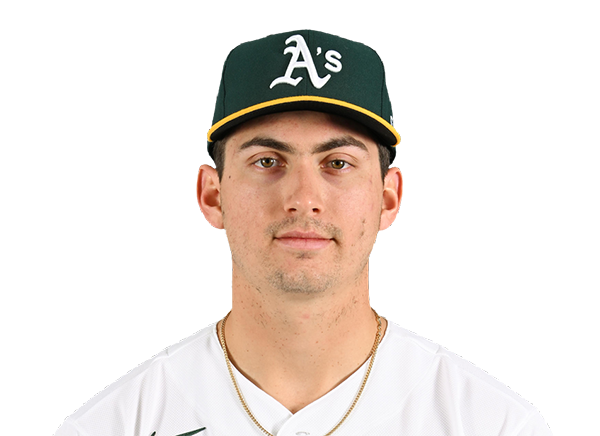 Tyler Soderstrom | 1-4 | 4 | 1 | 1 | 0 | 0 | 0 | 0 | 14 | .207 | .293 | .407 |
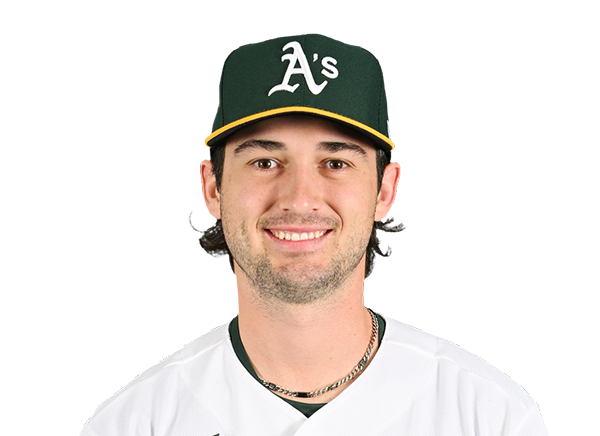 Jacob Wilson | 1-2 | 2 | 0 | 1 | 0 | 0 | 0 | 0 | 8 | .292 | .311 | .398 |
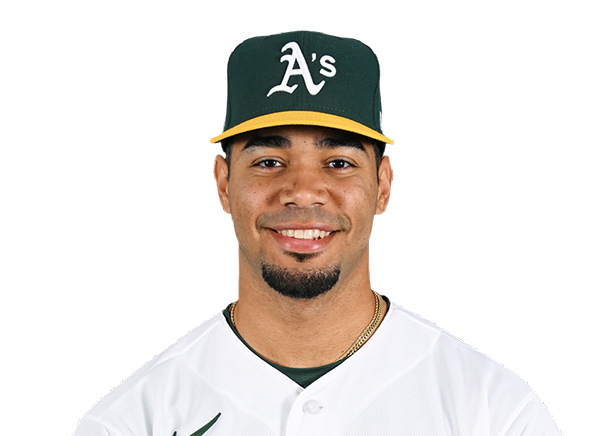 Darell Hernaiz | 0-1 | 1 | 0 | 0 | 0 | 0 | 0 | 1 | 4 | .208 | .311 | .264 |
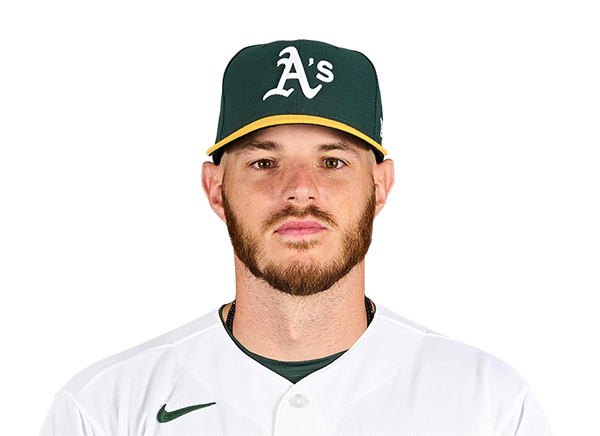 Jonah Heim | 0-1 | 1 | 0 | 0 | 0 | 0 | 0 | 1 | 3 | .000 | .000 | .000 |
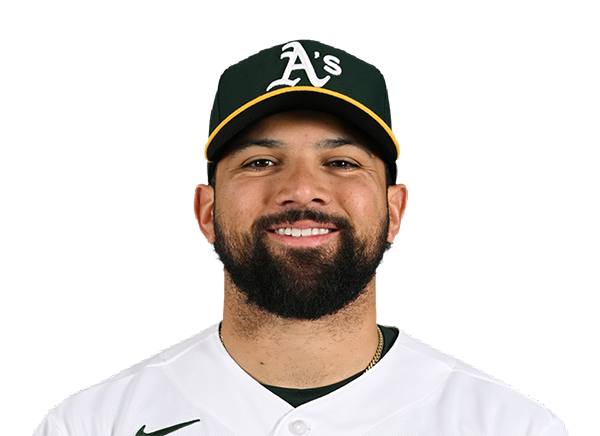 Carlos Cortes | 1-3 | 3 | 0 | 1 | 1 | 0 | 0 | 0 | 18 | .355 | .408 | .570 |
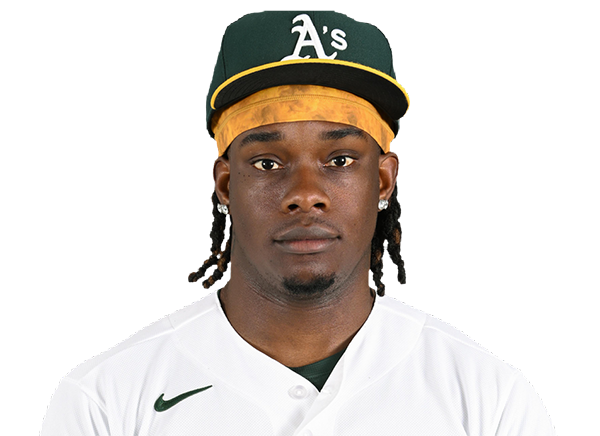 Lawrence Butler | 0-3 | 3 | 0 | 0 | 0 | 0 | 1 | 2 | 29 | .179 | .278 | .282 |
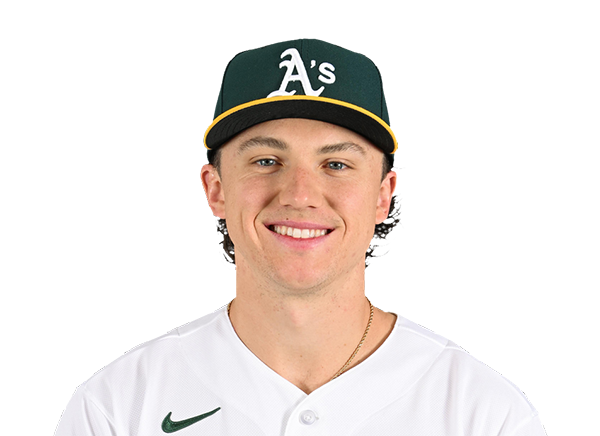 Zack Gelof | 1-4 | 4 | 0 | 1 | 0 | 0 | 0 | 1 | 12 | .274 | .328 | .484 |
 Jeff McNeil | 0-3 | 3 | 0 | 0 | 0 | 0 | 0 | 1 | 10 | .283 | .348 | .375 |
Baltimore Orioles
| Player | H-AB | AB | R | H | RBI | HR | BB | K | #P | AVG | OBP | SLG |
|---|---|---|---|---|---|---|---|---|---|---|---|---|
 Gunnar Henderson | 2-4 | 4 | 0 | 2 | 1 | 0 | 0 | 1 | 11 | .211 | .269 | .421 |
 Taylor Ward | 0-2 | 2 | 0 | 0 | 0 | 0 | 2 | 2 | 21 | .262 | .426 | .376 |
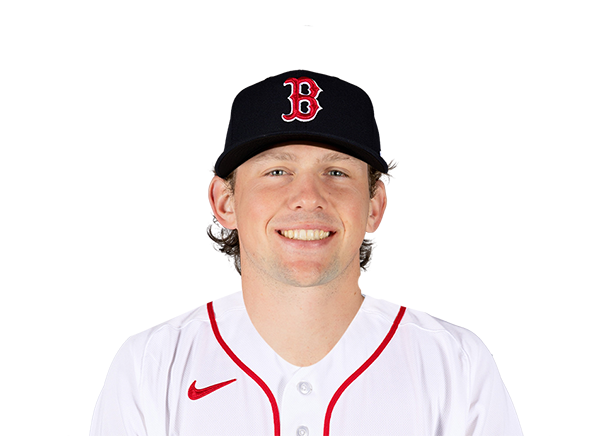 Adley Rutschman | 0-4 | 4 | 0 | 0 | 0 | 0 | 0 | 2 | 12 | .304 | .360 | .565 |
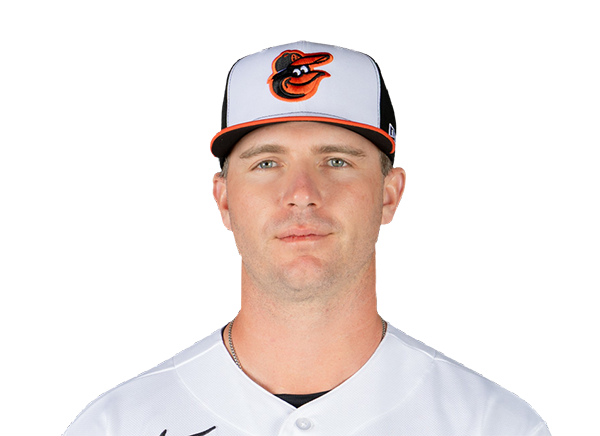 Pete Alonso | 0-4 | 4 | 0 | 0 | 0 | 0 | 0 | 1 | 20 | .214 | .313 | .435 |
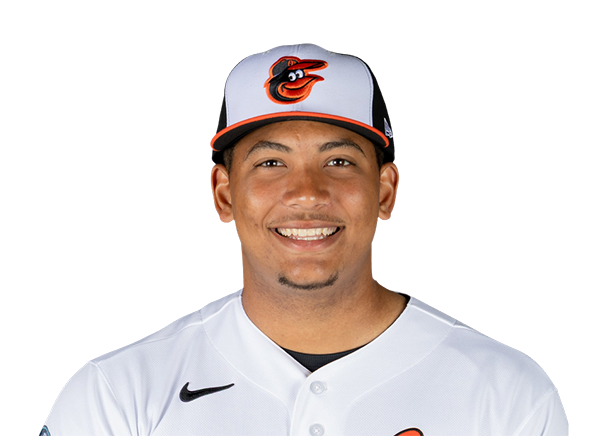 Samuel Basallo | 1-4 | 4 | 1 | 1 | 0 | 0 | 0 | 2 | 18 | .270 | .333 | .470 |
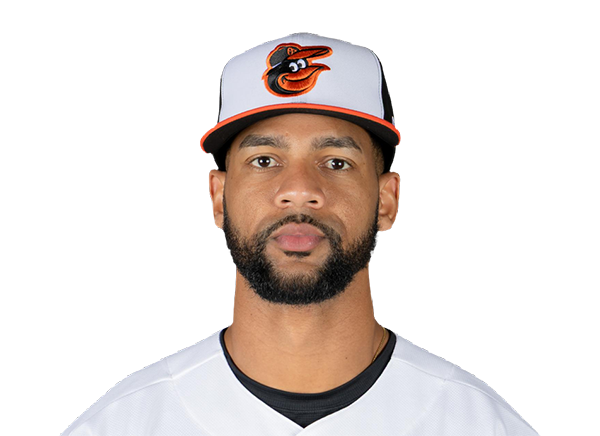 Leody Taveras | 1-4 | 4 | 0 | 1 | 0 | 0 | 0 | 0 | 14 | .269 | .376 | .409 |
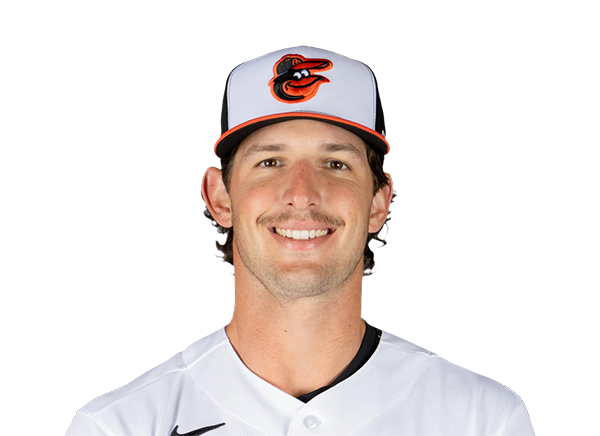 Dylan Beavers | 2-4 | 4 | 1 | 2 | 1 | 0 | 0 | 0 | 15 | .243 | .331 | .369 |
 Weston Wilson | 0-1 | 1 | 0 | 0 | 0 | 0 | 2 | 1 | 17 | .250 | .444 | .300 |
 Jeremiah Jackson | 0-0 | 0 | 0 | 0 | 0 | 0 | 0 | 0 | 0 | .246 | .267 | .413 |
 Blaze Alexander | 0-1 | 1 | 0 | 0 | 0 | 0 | 1 | 1 | 9 | .229 | .289 | .277 |
Athletics
| Player | IP | H | R | ER | BB | K | HR | PC-ST | ERA | PC |
|---|---|---|---|---|---|---|---|---|---|---|
 Luis Severino | 5.1 | 6 | 2 | 2 | 4 | 4 | 0 | 102-61 | 4.07 | 102 |
 Justin Sterner | 0.2 | 0 | 0 | 0 | 1 | 2 | 0 | 12-7 | 4.12 | 12 |
 Luis Medina | 2.0 | 0 | 0 | 0 | 0 | 4 | 0 | 23-15 | 1.84 | 23 |
Baltimore Orioles
| Player | IP | H | R | ER | BB | K | HR | PC-ST | ERA | PC |
|---|---|---|---|---|---|---|---|---|---|---|
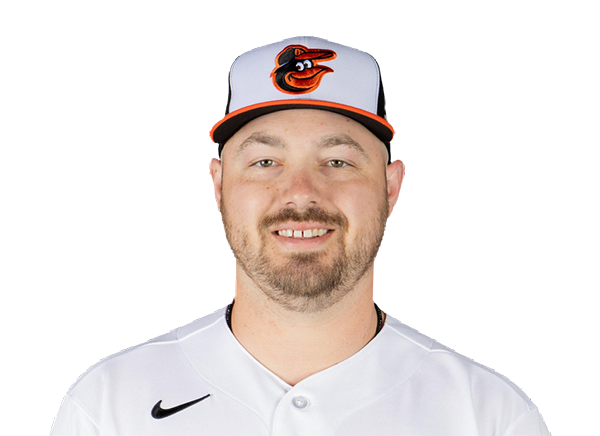 Keegan Akin | 1.0 | 0 | 0 | 0 | 0 | 2 | 0 | 13-8 | 9.45 | 13 |
 Chris Bassitt | 6.0 | 4 | 1 | 1 | 1 | 6 | 0 | 94-66 | 5.21 | 94 |
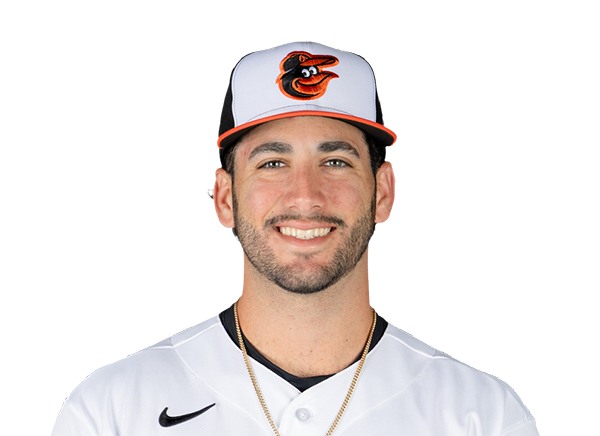 Anthony Nunez | 1.0 | 0 | 0 | 0 | 2 | 1 | 0 | 23-10 | 4.26 | 23 |
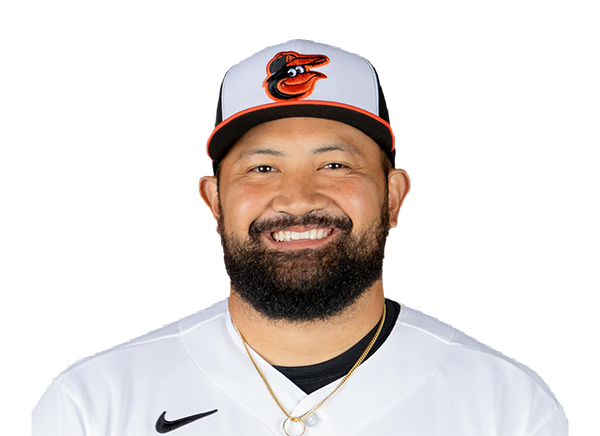 Rico Garcia | 1.0 | 0 | 0 | 0 | 1 | 1 | 0 | 17-9 | 0.50 | 17 |
H2H / Season Series
BAL2–1
ATH
BAL2–6
ATH
BAL3–4
ATH
Last 5 Games
| Date | Opponent | Result |
|---|---|---|
| Aug 23 |  @ HOU | W7–6 |
| Aug 22 | @ HOU | W4–3 |
| Aug 21 | @ HOU | L0–4 |
| Aug 20 |  @ KC | L2–6 |
| Aug 19 | @ KC | L7–9 |
| Date | Opponent | Result |
|---|---|---|
| Aug 23 |  vs TB | L1–3 |
| Aug 22 | vs TB | W3–2 |
| Aug 21 | vs TB | W5–3 |
| Aug 20 |  vs NYY | L1–6 |
| Aug 19 | vs NYY | L3–5 |
Standings
American League
| Team | W | L | PCT | GB | DIFF | STRK |
|---|---|---|---|---|---|---|
| 1Rays | 77 | 53 | .592 | - | +44 | W1 |
2 White Sox | 68 | 62 | .523 | 9 | +43 | W1 |
| 3Astros | 65 | 66 | .496 | 12.5 | -44 | L2 |
| 4Yankees | 74 | 56 | .569 | 3 | +100 | W1 |
5 Red Sox | 71 | 59 | .546 | 6 | +99 | W3 |
6 Rangers | 65 | 66 | .496 | 12.5 | -46 | W1 |
7 Guardians | 65 | 66 | .496 | 12.5 | -9 | W4 |
8 Blue Jays | 64 | 68 | .485 | 14 | -55 | L1 |
9 Twins | 63 | 68 | .481 | 14.5 | -54 | L3 |
| 10Orioles | 63 | 68 | .481 | 14.5 | -35 | L1 |
11 Mariners | 62 | 69 | .473 | 15.5 | -61 | L1 |
12 Tigers | 61 | 69 | .469 | 16 | +73 | L5 |
| 13Royals | 58 | 74 | .439 | 20 | -91 | W8 |
14 Angels | 52 | 79 | .397 | 25.5 | -70 | L1 |
| 15Athletics | 51 | 80 | .389 | 26.5 | -187 | W2 |
National League
| Team | W | L | PCT | GB | DIFF | STRK |
|---|---|---|---|---|---|---|
1 Brewers | 81 | 50 | .618 | - | +161 | L1 |
2 Dodgers | 80 | 51 | .611 | 1 | +151 | W6 |
3 Braves | 76 | 55 | .580 | 5 | +110 | W1 |
4 Cubs | 75 | 56 | .573 | 6 | +115 | W1 |
5 Phillies | 73 | 58 | .557 | 8 | +27 | W9 |
6 Padres | 71 | 60 | .542 | 10 | +16 | W3 |
7 Diamondbacks | 69 | 62 | .527 | 12 | +9 | W1 |
8 Marlins | 67 | 64 | .511 | 14 | +21 | W3 |
9 Cardinals | 66 | 66 | .500 | 15.5 | -2 | L3 |
10 Pirates | 63 | 69 | .477 | 18.5 | +25 | L3 |
11 Reds | 62 | 69 | .473 | 19 | -94 | L1 |
12 Nationals | 61 | 71 | .462 | 20.5 | +10 | L4 |
13 Mets | 59 | 72 | .450 | 22 | -40 | L1 |
14 Giants | 52 | 78 | .400 | 28.5 | -80 | L4 |
15 Rockies | 50 | 80 | .385 | 30.5 | -136 | L6 |
ATH
VS
BAL
Pitchers
Luis Severino
Justin Sterner
Luis Medina
Catchers
Shea Langeliers
Infielders
Nick Kurtz
Jacob Wilson
Darell Hernaiz
Zack Gelof
Jeff McNeil
Outfielders
Tyler Soderstrom
Carlos Cortes
Lawrence Butler
Designated Hitters
Brent Rooker
Other Players
Jonah Heim
Pitchers
Keegan Akin
Chris Bassitt
Anthony Nunez
Rico Garcia
Catchers
Samuel Basallo
Infielders
Gunnar Henderson
Pete Alonso
Weston Wilson
Jeremiah Jackson
Blaze Alexander
Outfielders
Taylor Ward
Leody Taveras
Dylan Beavers
Designated Hitters
Adley Rutschman
Athletics
VS
Orioles
Batting
131
Team Games Played
131
4441
At Bats
4348
1084
Hits
1020
543
Runs Batted In
563
156
Home Runs
159
68
Stolen Bases
68
.244
Batting Average
.235
568
Runs
583
202
Doubles
188
11
Triples
18
1776
Total Bases
1721
437
Walks
491
1120
Strikeouts
1202
.318
On Base Percentage
.317
.400
Slugging Percentage
.396
.718
OBP Pct + SLG Pct
.713
131
Games Played
131
0
Games Started
0
58
Hit By Pitch
48
0.0
Wins Above Replacement
0.0
0.0
Offensive Wins Above Replacement
0.0
27
Caught Stealing
29
1
Is Qualified
1
563.5
Runs Created
553.7
4.3
Runs Created Per 27 Outs
4.3
.088
Walks Per Plate Appearance
.099
0.39
Walk To Strikeout Ratio
0.41
.156
Isolated Power
.161
.263
Secondary Average
.283
3.82
Pitches Per Plate Appearance
4.00
369
Extra Base Hits
365
4978
Plate Appearances
4937
28.5
At Bats Per Home Run
27.3
18
Sacrifice Hit
16
22
Sacrifice Flies
32
Pitching
131
Team Games Played
131
27
Quality Starts
51
51
Wins
63
80
Losses
68
32
Saves
34
73
Holds
68
1222
Hits
1132
704
Earned runs
543
200
Home Runs
139
522
Walks
435
1101
Strikeouts
1038
8.6
Strikeouts Per 9 Innings
8.0
0.0
Pitches Per Start
0.0
1.51
Walks Plus Hits Per Inning Pitched
1.34
5.47
Earned Run Average
4.19
80
Losses
68
1158.0
Innings pitched
1165.2
.389
Win Percentage
.481
58
Save Opportunities
52
.270
Opponent Batting Average
.254
.350
Opponent's On-base pct.
.322
.466
Opponent's Slugging pct.
.408
.816
Opponent's OPB Pct + SLG Pct
.730
4521
At Bats
4462
243
Doubles
226
21
Triples
23
63
Batters Hit
37
86
Stolen Bases
69
131
Games Played
131
1
Complete Games
1
0
Shutouts
0
39
Wild Pitches
41
0
Runs Batted In
0
8
Balks
2
1158.0
Innings pitched
1165.2
8.6
Strikeouts Per 9 Innings
8.0
34
Caught Stealing
33
131
Games Started
131
0.0
Wins Above Replacement
0.0
1
Is Qualified
1
755
Runs
618
700
Earned Runs
540
2107
Total Bases
1821
Fielding
131
Team Games Played
131
1158
Full Innings
1166
4520
Total Chances
4708
3474
Putouts
3497
982
Assists
1129
64
Errors
82
202
Double Plays
188
0.986
Fielding Percentage
0.983
34.6
Range Factor
35.7
0.0
Zone Rating
0.0
131
Games Played
131
0
Games Started
0
0.0
Defensive Wins Above Replacement
0.0
1
Qualified
1