

Blue Jays vs Astros Live Score (5 Aug, 2026)
Game Information
Stage
Standard
Season
2026
First Pitch
Tue, Aug 4, 8:10 pm
Venue
Daikin Park
Location
Houston, Texas
Attendance
30,450
Live Situation
1Balls
1Strikes
0Outs
—Pitcher
—At Bat
Pitch Sequence
1
STRIKE SWINGING
Changeup
86 MPH
2
BALL
Changeup
87 MPH
3
BALL IN PLAY
Changeup
86 MPH
Injury Report
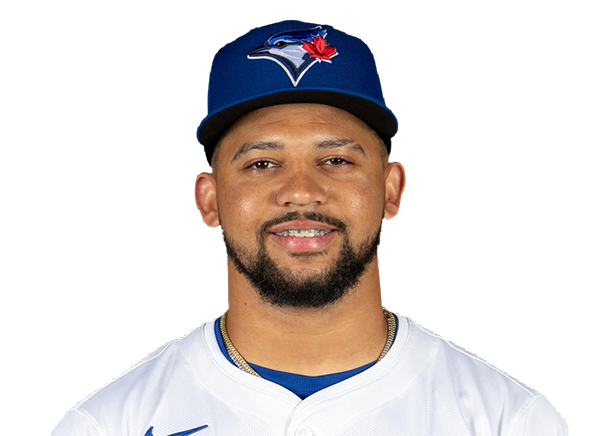



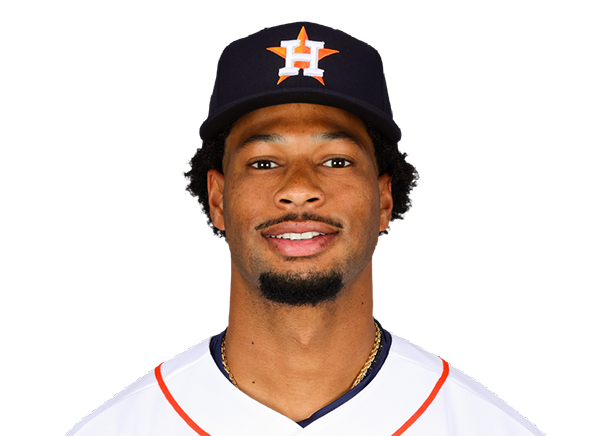
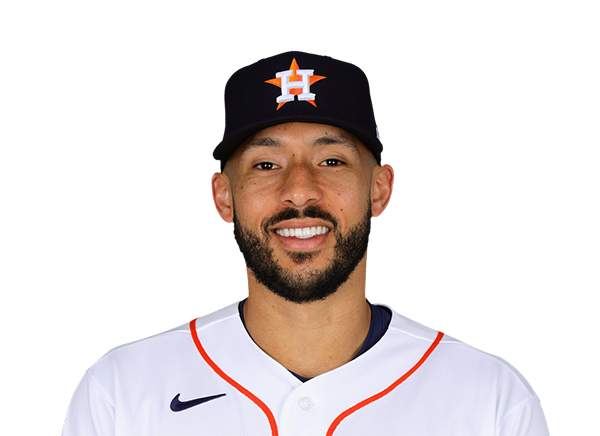

Team Stats
 TOR
HOU


2
Runs
7
5
Hits
9
1
Errors
1
0
Home Runs
1
2
Walks
7
6
Strikeouts
4
Player Box Score
Toronto Blue Jays
| Player | H-AB | AB | R | H | RBI | HR | BB | K | #P | AVG | OBP | SLG |
|---|---|---|---|---|---|---|---|---|---|---|---|---|
 Nathan Lukes | 0-4 | 4 | 0 | 0 | 0 | 0 | 0 | 0 | 11 | .267 | .325 | .371 |
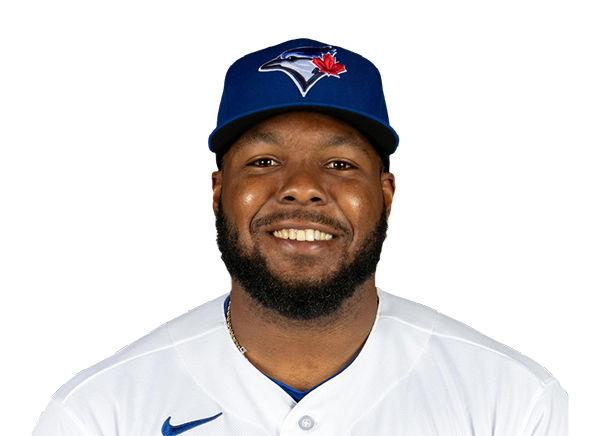 Vladimir Guerrero Jr. | 0-3 | 3 | 0 | 0 | 0 | 0 | 1 | 0 | 18 | .259 | .338 | .349 |
 Kazuma Okamoto | 0-4 | 4 | 0 | 0 | 0 | 0 | 0 | 3 | 23 | .229 | .303 | .443 |
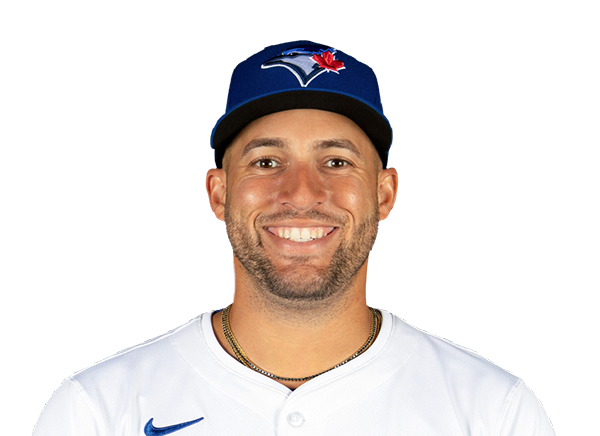 George Springer | 1-3 | 3 | 0 | 1 | 0 | 0 | 1 | 1 | 20 | .240 | .321 | .408 |
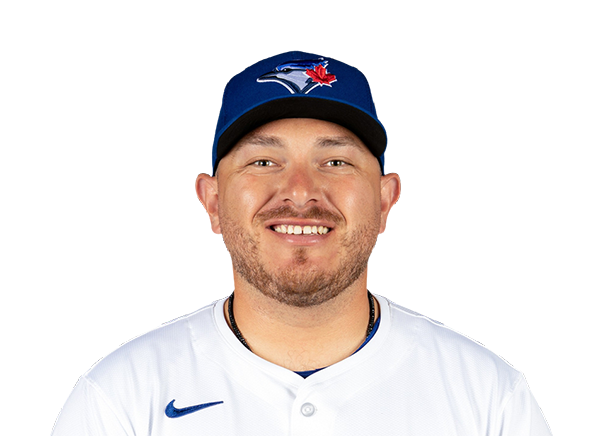 Alejandro Kirk | 1-4 | 4 | 0 | 1 | 0 | 0 | 0 | 0 | 7 | .237 | .316 | .356 |
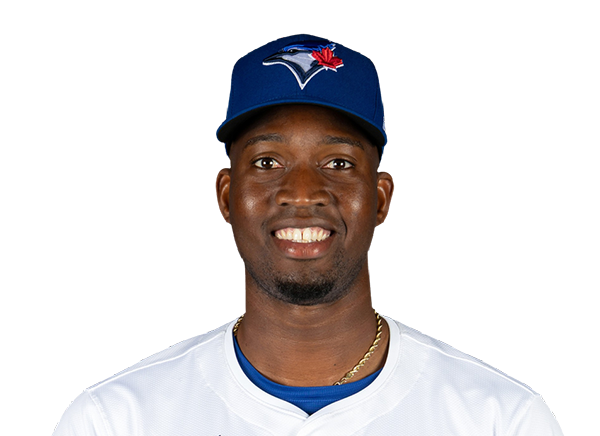 Jesus Sanchez | 0-2 | 2 | 0 | 0 | 0 | 0 | 0 | 0 | 4 | .269 | .310 | .426 |
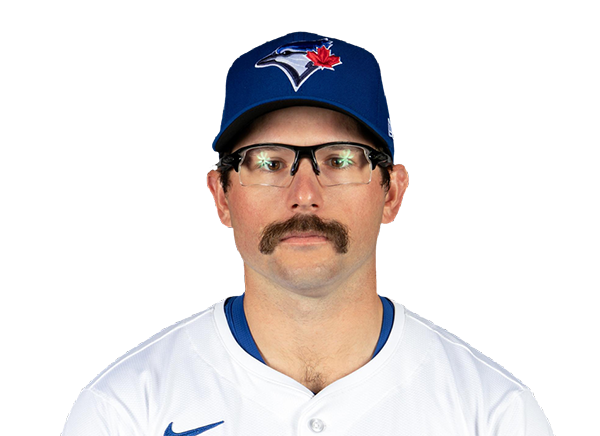 Davis Schneider | 0-1 | 1 | 0 | 0 | 0 | 0 | 0 | 1 | 4 | .145 | .280 | .282 |
 Josh Smith | 0-1 | 1 | 0 | 0 | 0 | 0 | 0 | 0 | 3 | .000 | .000 | .000 |
 Ernie Clement | 0-3 | 3 | 0 | 0 | 0 | 0 | 0 | 0 | 5 | .286 | .310 | .410 |
 Andres Gimenez | 1-3 | 3 | 1 | 1 | 0 | 0 | 0 | 1 | 11 | .231 | .274 | .348 |
 Myles Straw | 2-3 | 3 | 1 | 2 | 1 | 0 | 0 | 0 | 6 | .231 | .285 | .346 |
Houston Astros
| Player | H-AB | AB | R | H | RBI | HR | BB | K | #P | AVG | OBP | SLG |
|---|---|---|---|---|---|---|---|---|---|---|---|---|
 Jeremy Pena | 0-3 | 3 | 0 | 0 | 0 | 0 | 2 | 1 | 25 | .317 | .376 | .519 |
 Yordan Alvarez | 1-4 | 4 | 1 | 1 | 0 | 0 | 1 | 1 | 22 | .329 | .443 | .644 |
 Isaac Paredes | 0-4 | 4 | 0 | 0 | 0 | 0 | 0 | 1 | 18 | .249 | .346 | .413 |
 Daulton Varsho | 0-2 | 2 | 0 | 0 | 0 | 0 | 2 | 0 | 19 | .167 | .444 | .167 |
 Christian Walker | 1-4 | 4 | 2 | 1 | 0 | 0 | 0 | 1 | 20 | .237 | .313 | .458 |
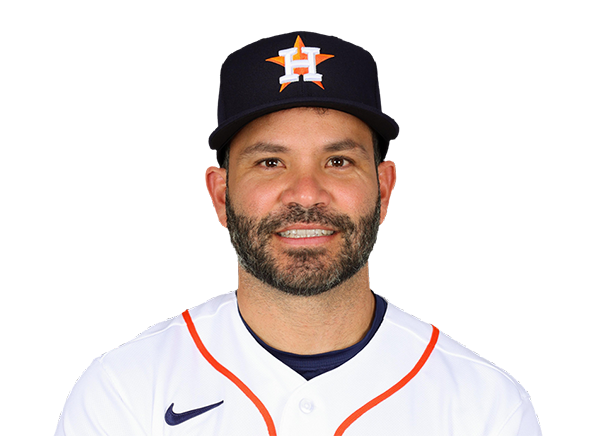 Jose Altuve | 3-4 | 4 | 2 | 3 | 2 | 0 | 0 | 0 | 10 | .241 | .304 | .389 |
 Nick Allen | 0-0 | 0 | 0 | 0 | 0 | 0 | 0 | 0 | 0 | .257 | .306 | .327 |
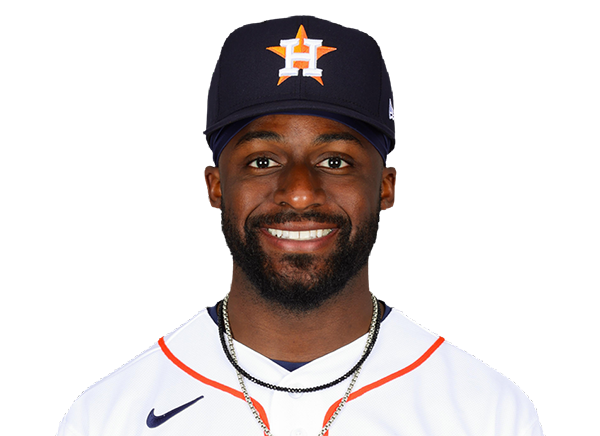 Taylor Trammell | 1-3 | 3 | 2 | 1 | 3 | 1 | 1 | 0 | 10 | .238 | .327 | .411 |
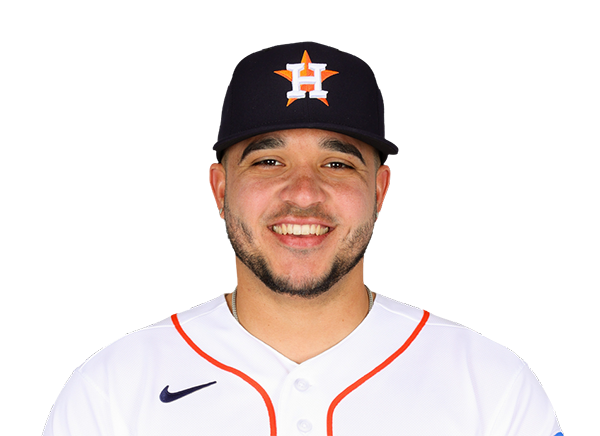 Yainer Diaz | 2-4 | 4 | 0 | 2 | 1 | 0 | 0 | 0 | 9 | .265 | .290 | .422 |
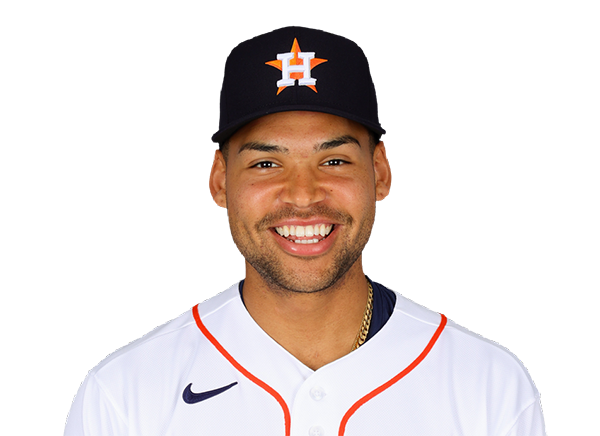 Cam Smith | 1-3 | 3 | 0 | 1 | 1 | 0 | 1 | 0 | 12 | .217 | .289 | .372 |
Toronto Blue Jays
| Player | IP | H | R | ER | BB | K | HR | PC-ST | ERA | PC |
|---|---|---|---|---|---|---|---|---|---|---|
 Trey Yesavage | 2.0 | 0 | 0 | 0 | 1 | 0 | 0 | 27-16 | 3.65 | 27 |
 Chad Dallas | 3.0 | 7 | 6 | 6 | 4 | 3 | 1 | 74-47 | 8.22 | 74 |
 Braydon Fisher | 1.0 | 0 | 0 | 0 | 0 | 1 | 0 | 14-9 | 3.93 | 14 |
 Brendon Little | 1.0 | 2 | 1 | 1 | 1 | 0 | 0 | 18-9 | 11.77 | 18 |
 Mason Fluharty | 1.0 | 0 | 0 | 0 | 1 | 0 | 0 | 12-8 | 4.23 | 12 |
Houston Astros
| Player | IP | H | R | ER | BB | K | HR | PC-ST | ERA | PC |
|---|---|---|---|---|---|---|---|---|---|---|
 Hayden Wesneski | 6.0 | 4 | 2 | 2 | 2 | 4 | 0 | 78-51 | 3.86 | 78 |
 Bennett Sousa | 1.0 | 0 | 0 | 0 | 0 | 1 | 0 | 7-6 | 2.89 | 7 |
 Enyel De Los Santos | 2.0 | 1 | 0 | 0 | 0 | 1 | 0 | 27-21 | 4.22 | 27 |
H2H / Season Series
HOU4–5
TOR
HOU7–2
TOR
HOU1–3
TOR
TOR1–3
HOU
TOR7–9
HOU
TOR4–2
HOU
Last 5 Games
| Date | Opponent | Result |
|---|---|---|
| Aug 22 |  @ NYY | W4–3 |
| Aug 21 | @ NYY | L1–3 |
| Aug 20 |  @ TB | W5–1 |
| Aug 19 | @ TB | L6–7 |
| Aug 18 | @ TB | W10–5 |
| Date | Opponent | Result |
|---|---|---|
| Aug 22 |  vs ATH | L3–4 |
| Aug 21 | vs ATH | W4–0 |
| Aug 20 |  vs LAA | L3–18 |
| Aug 19 | vs LAA | W3–2 |
| Aug 18 | vs LAA | L1–3 |
Standings
American League
| Team | W | L | PCT | GB | DIFF | STRK |
|---|---|---|---|---|---|---|
| 1Rays | 76 | 53 | .589 | - | +42 | L3 |
2 White Sox | 67 | 62 | .519 | 9 | +42 | L1 |
| 3Astros | 65 | 65 | .500 | 11.5 | -43 | L1 |
| 4Yankees | 73 | 56 | .566 | 3 | +95 | L1 |
5 Red Sox | 70 | 59 | .543 | 6 | +98 | W2 |
6 Rangers | 64 | 66 | .492 | 12.5 | -48 | L1 |
7 Guardians | 64 | 66 | .492 | 12.5 | -14 | W3 |
| 8Blue Jays | 64 | 67 | .489 | 13 | -50 | W1 |
9 Twins | 63 | 67 | .485 | 13.5 | -47 | L2 |
10 Orioles | 63 | 67 | .485 | 13.5 | -33 | W2 |
11 Mariners | 62 | 68 | .477 | 14.5 | -44 | W2 |
12 Tigers | 61 | 68 | .473 | 15 | +77 | L4 |
13 Royals | 57 | 74 | .435 | 20 | -95 | W7 |
| 14Angels | 52 | 78 | .400 | 24.5 | -68 | W1 |
| 15Athletics | 50 | 80 | .385 | 26.5 | -188 | W1 |
National League
| Team | W | L | PCT | GB | DIFF | STRK |
|---|---|---|---|---|---|---|
1 Brewers | 81 | 49 | .623 | - | +163 | W3 |
2 Dodgers | 79 | 51 | .608 | 2 | +147 | W5 |
3 Braves | 75 | 55 | .577 | 6 | +108 | L2 |
4 Cubs | 74 | 56 | .569 | 7 | +98 | L3 |
5 Phillies | 72 | 58 | .554 | 9 | +25 | W8 |
6 Padres | 70 | 60 | .538 | 11 | +9 | W2 |
7 Diamondbacks | 68 | 62 | .523 | 13 | +7 | L1 |
8 Marlins | 66 | 64 | .508 | 15 | +17 | W2 |
9 Cardinals | 66 | 65 | .504 | 15.5 | 0 | L2 |
10 Pirates | 63 | 68 | .481 | 18.5 | +29 | L2 |
11 Reds | 62 | 68 | .477 | 19 | -92 | W1 |
12 Nationals | 61 | 70 | .466 | 20.5 | +14 | L3 |
13 Mets | 59 | 71 | .454 | 22 | -39 | W1 |
14 Giants | 52 | 77 | .403 | 28.5 | -79 | L3 |
15 Rockies | 50 | 79 | .388 | 30.5 | -131 | L5 |
TOR
VS
HOU
Pitchers
Trey Yesavage
Catchers
Alejandro Kirk
Infielders
Vladimir Guerrero Jr.
Kazuma Okamoto
Ernie Clement
Andres Gimenez
Outfielders
Nathan Lukes
Jesus Sanchez
Myles Straw
Designated Hitters
George Springer
Pitchers
Hayden Wesneski
Catchers
Yainer Diaz
Infielders
Jeremy Pena
Isaac Paredes
Christian Walker
Jose Altuve
Outfielders
Daulton Varsho
Taylor Trammell
Cam Smith
Designated Hitters
Yordan Alvarez
Blue Jays
VS
Astros
Batting
114
Team Games Played
115
3818
At Bats
3880
924
Hits
955
425
Runs Batted In
510
108
Home Runs
156
51
Stolen Bases
37
.242
Batting Average
.246
444
Runs
536
177
Doubles
173
7
Triples
10
1439
Total Bases
1616
306
Walks
391
818
Strikeouts
941
.303
On Base Percentage
.322
.377
Slugging Percentage
.416
.680
OBP Pct + SLG Pct
.739
114
Games Played
115
114
Games Started
115
42
Hit By Pitch
56
0.0
Wins Above Replacement
0.0
0.0
Offensive Wins Above Replacement
0.0
12
Caught Stealing
15
1
Is Qualified
1
437.7
Runs Created
522.4
3.9
Runs Created Per 27 Outs
4.6
.073
Walks Per Plate Appearance
.089
0.37
Walk To Strikeout Ratio
0.42
.135
Isolated Power
.170
.225
Secondary Average
.277
3.80
Pitches Per Plate Appearance
3.88
292
Extra Base Hits
339
4215
Plate Appearances
4370
35.4
At Bats Per Home Run
24.9
14
Sacrifice Hit
15
32
Sacrifice Flies
26
Pitching
114
Team Games Played
115
34
Quality Starts
34
53
Wins
59
61
Losses
56
35
Saves
36
74
Holds
55
921
Hits
909
456
Earned runs
522
119
Home Runs
153
408
Walks
482
1004
Strikeouts
1007
9.0
Strikeouts Per 9 Innings
8.9
148.7
Pitches Per Start
152.1
1.32
Walks Plus Hits Per Inning Pitched
1.36
4.07
Earned Run Average
4.61
61
Losses
56
1007.2
Innings pitched
1019.1
.465
Win Percentage
.513
48
Save Opportunities
43
.242
Opponent Batting Average
.238
.318
Opponent's On-base pct.
.333
.382
Opponent's Slugging pct.
.406
.699
Opponent's OPB Pct + SLG Pct
.738
3805
At Bats
3814
158
Doubles
147
8
Triples
16
29
Batters Hit
71
104
Stolen Bases
92
114
Games Played
115
1
Complete Games
0
8
Shutouts
7
32
Wild Pitches
38
480
Runs Batted In
534
5
Balks
5
1007.2
Innings pitched
1019.1
9.0
Strikeouts Per 9 Innings
8.9
35
Caught Stealing
28
114
Games Started
115
0.0
Wins Above Replacement
0.0
1
Is Qualified
1
505
Runs
560
456
Earned Runs
522
1452
Total Bases
1547
Fielding
114
Team Games Played
115
1008
Full Innings
1019
4064
Total Chances
3941
3023
Putouts
3058
967
Assists
835
74
Errors
48
177
Double Plays
173
0.982
Fielding Percentage
0.988
35.6
Range Factor
34.4
0.0
Zone Rating
0.0
114
Games Played
115
0
Games Started
0
0.0
Defensive Wins Above Replacement
0.0
1
Qualified
1