

Blue Jays vs Orioles Live Score (21 Sep, 2026)
Game Information
Stage
STD
Season
2026
First Pitch
Mon, Sep 21, 6:35 pm
Venue
Oriole Park at Camden Yards
Location
Baltimore, Maryland
Venue Type
Outdoor
Broadcast
ESPN Unlmtd
Attendance
12,067
Live Situation
3Balls
2Strikes
0Outs
—Pitcher
—At Bat
Pitch Sequence
1
BALL
Curve
87 MPH
2
BALL
Changeup
86 MPH
3
BALL
Four-seam FB
94 MPH
4
STRIKE LOOKING
Four-seam FB
94 MPH
5
STRIKE LOOKING
Four-seam FB
95 MPH
6
STRIKE FOUL
Changeup
88 MPH
7
BALL IN PLAY
Four-seam FB
96 MPH
Injury Report


Team Stats
 TOR
BAL


3
Runs
4
6
Hits
6
0
Errors
0
0
Home Runs
3
3
Walks
2
5
Strikeouts
10
Player Box Score
Toronto Blue Jays
| Player | H-AB | AB | R | H | RBI | HR | BB | K | #P | AVG | OBP | SLG |
|---|---|---|---|---|---|---|---|---|---|---|---|---|
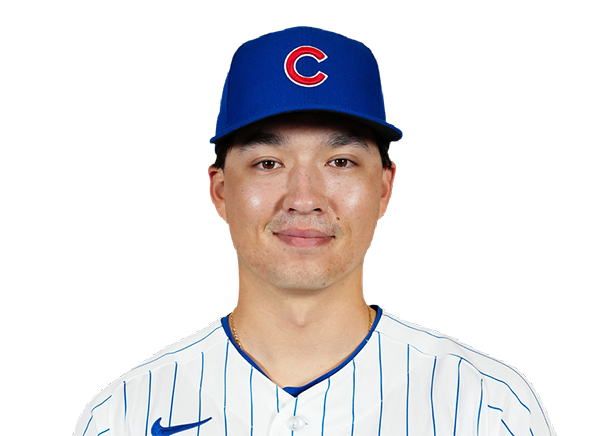 Brett Bateman | 0-1 | 1 | 1 | 0 | 0 | 0 | 1 | 0 | 16 | .320 | .394 | .413 |
 Myles Straw | 0-2 | 2 | 0 | 0 | 0 | 0 | 0 | 0 | 4 | .237 | .303 | .343 |
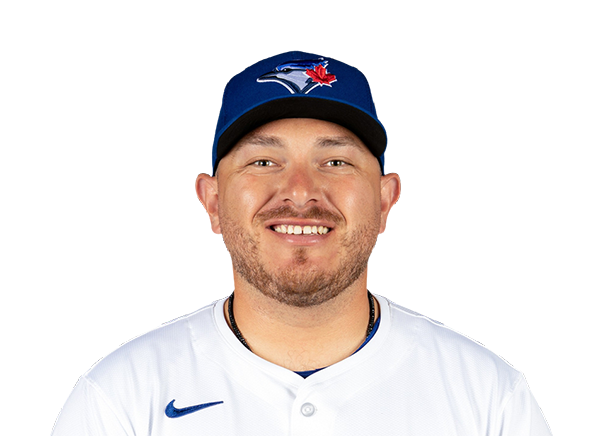 Alejandro Kirk | 1-3 | 3 | 1 | 1 | 0 | 0 | 1 | 0 | 21 | .283 | .355 | .423 |
 Brandon Valenzuela | 0-0 | 0 | 0 | 0 | 0 | 0 | 0 | 0 | 0 | .219 | .304 | .361 |
 Nathan Lukes | 1-3 | 3 | 1 | 1 | 1 | 0 | 1 | 0 | 10 | .275 | .324 | .387 |
 George Springer | 2-4 | 4 | 0 | 2 | 1 | 0 | 0 | 1 | 12 | .251 | .324 | .408 |
 Sean Keys | 0-3 | 3 | 0 | 0 | 1 | 0 | 0 | 2 | 14 | .196 | .250 | .353 |
 Kazuma Okamoto | 1-4 | 4 | 0 | 1 | 0 | 0 | 0 | 1 | 14 | .235 | .310 | .458 |
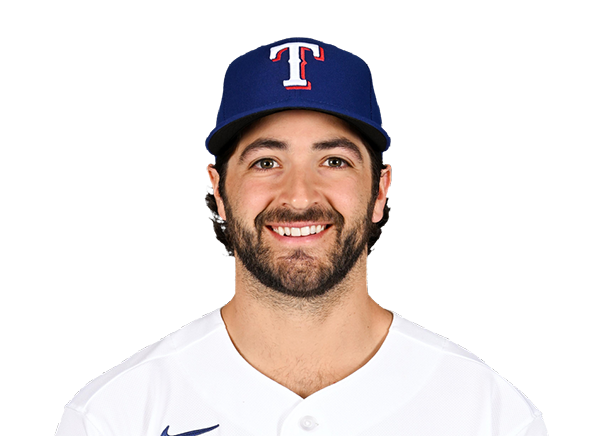 Josh Smith | 0-4 | 4 | 0 | 0 | 0 | 0 | 0 | 1 | 22 | .211 | .303 | .332 |
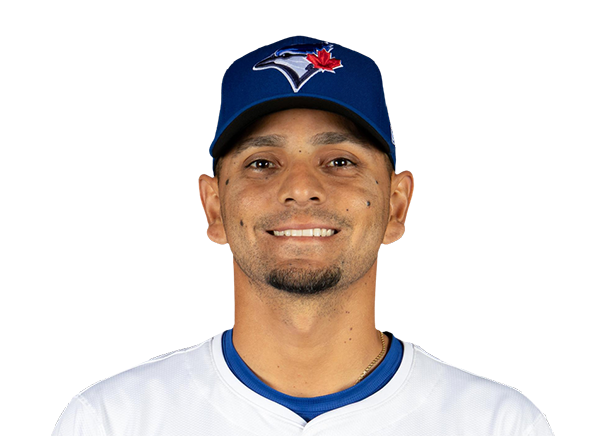 Andres Gimenez | 1-3 | 3 | 0 | 1 | 0 | 0 | 0 | 0 | 5 | .242 | .287 | .356 |
 Ernie Clement | 0-3 | 3 | 0 | 0 | 0 | 0 | 0 | 0 | 9 | .264 | .290 | .370 |
Baltimore Orioles
| Player | H-AB | AB | R | H | RBI | HR | BB | K | #P | AVG | OBP | SLG |
|---|---|---|---|---|---|---|---|---|---|---|---|---|
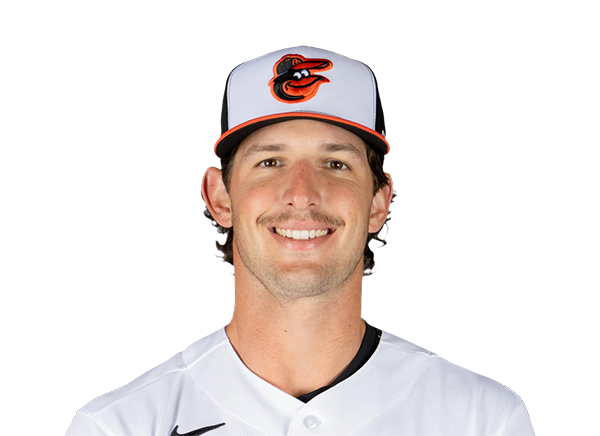 Dylan Beavers | 0-4 | 4 | 0 | 0 | 0 | 0 | 0 | 2 | 18 | .231 | .306 | .364 |
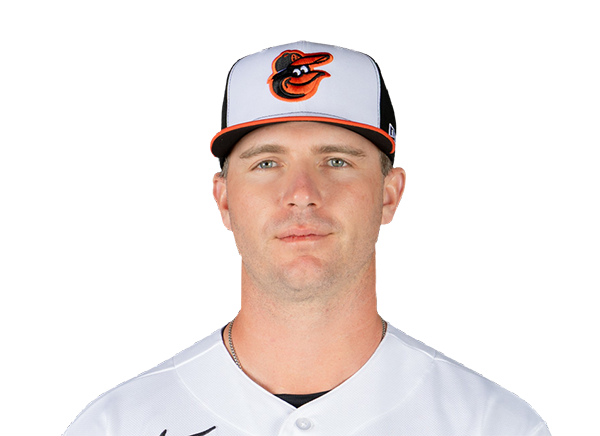 Pete Alonso | 2-4 | 4 | 2 | 2 | 3 | 2 | 0 | 1 | 16 | .265 | .359 | .510 |
 Gunnar Henderson | 3-4 | 4 | 1 | 3 | 1 | 1 | 0 | 0 | 17 | .227 | .310 | .408 |
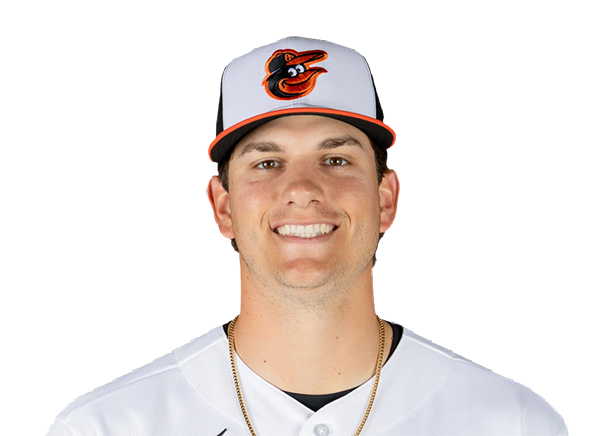 Coby Mayo | 0-4 | 4 | 0 | 0 | 0 | 0 | 0 | 2 | 15 | .227 | .295 | .466 |
 Christian Encarnacion-Strand | 1-3 | 3 | 0 | 1 | 0 | 0 | 0 | 0 | 12 | .268 | .320 | .497 |
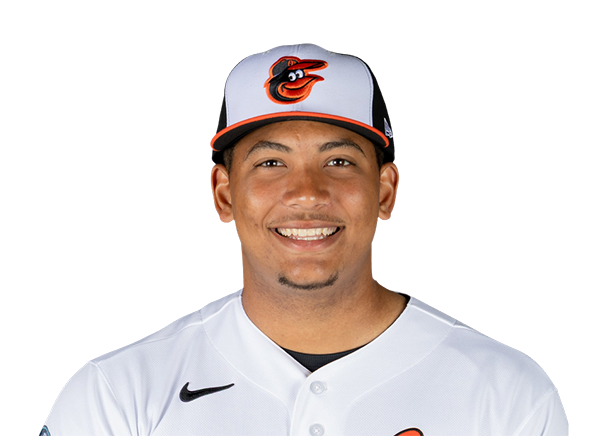 Samuel Basallo | 0-2 | 2 | 0 | 0 | 0 | 0 | 0 | 2 | 10 | .222 | .291 | .406 |
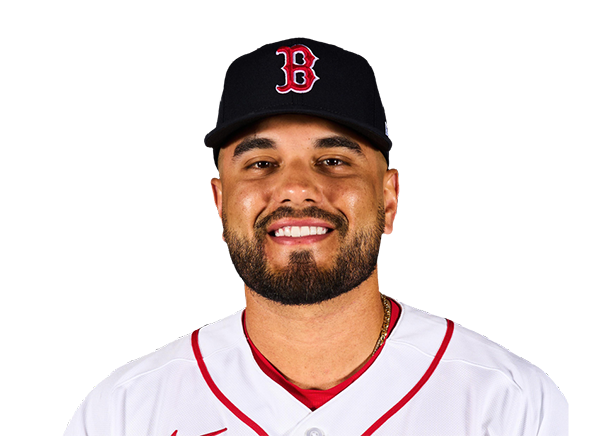 Carlos Narvaez | 0-1 | 1 | 0 | 0 | 0 | 0 | 0 | 0 | 1 | .166 | .244 | .232 |
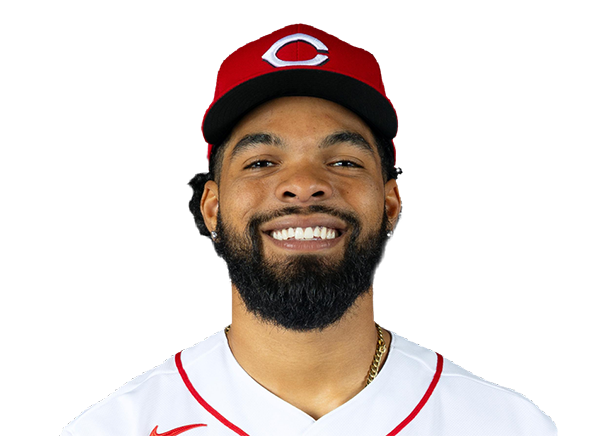 Rece Hinds | 0-3 | 3 | 0 | 0 | 0 | 0 | 0 | 0 | 10 | .155 | .227 | .241 |
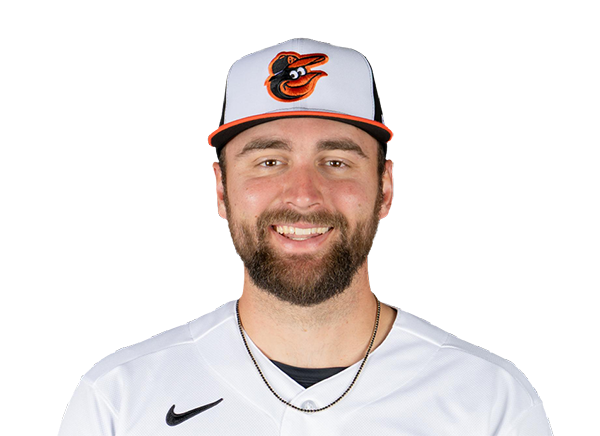 Colton Cowser | 0-1 | 1 | 0 | 0 | 0 | 0 | 1 | 1 | 8 | .224 | .314 | .366 |
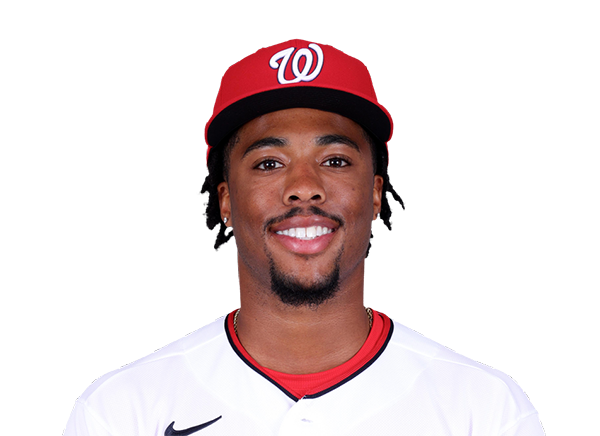 Christian Franklin | 0-0 | 0 | 1 | 0 | 0 | 0 | 1 | 0 | 6 | .135 | .304 | .189 |
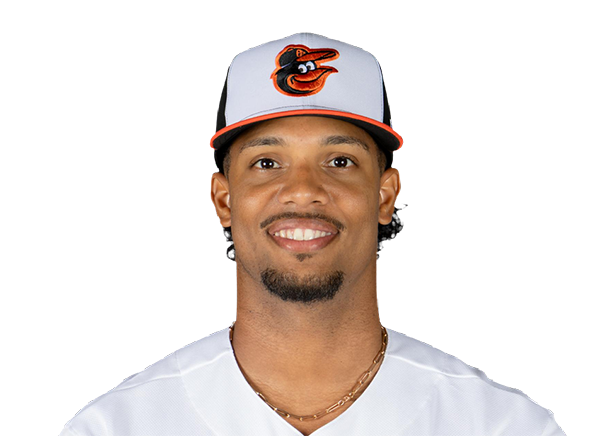 Jose Barrero | 0-2 | 2 | 0 | 0 | 0 | 0 | 0 | 2 | 7 | .000 | .000 | .000 |
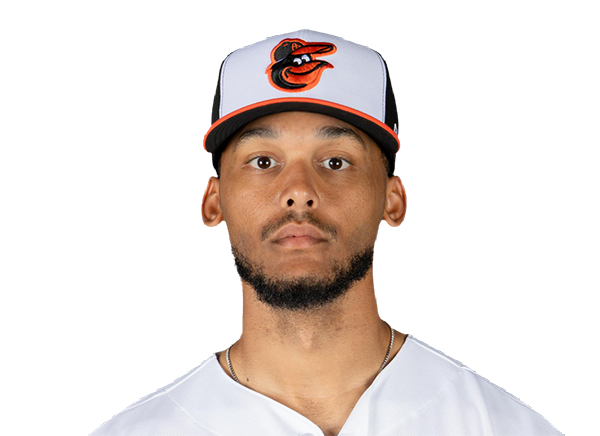 Jeremiah Jackson | 0-1 | 1 | 0 | 0 | 0 | 0 | 0 | 0 | 3 | .221 | .246 | .365 |
Toronto Blue Jays
| Player | IP | H | R | ER | BB | K | HR | PC-ST | ERA | PC |
|---|---|---|---|---|---|---|---|---|---|---|
 Trey Yesavage | 2.0 | 1 | 1 | 1 | 0 | 3 | 1 | 40-26 | 3.67 | 40 |
 Brendan Cellucci | 1.1 | 1 | 0 | 0 | 0 | 3 | 0 | 15-13 | 0.00 | 15 |
|
Chad Dallas | 2.2 | 1 | 1 | 1 | 1 | 4 | 1 | 34-21 | 5.54 | 34 |
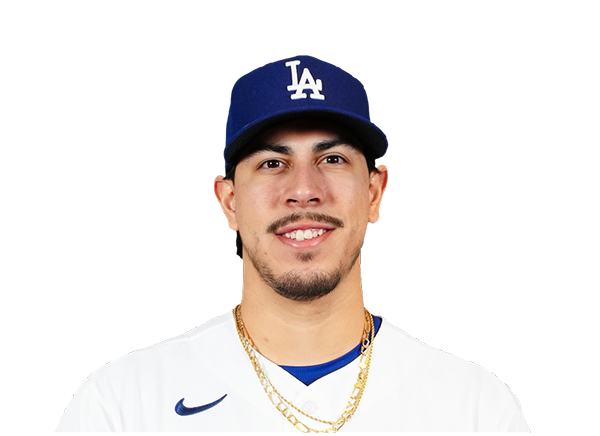 Jose Rodriguez | 1.0 | 1 | 0 | 0 | 0 | 0 | 0 | 9-5 | 0.00 | 9 |
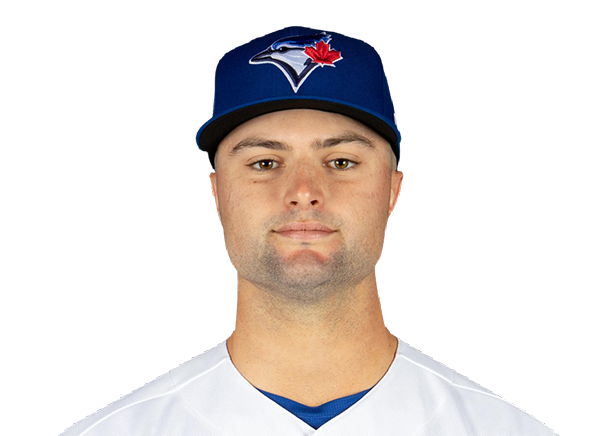 Mason Fluharty | 0.2 | 0 | 1 | 1 | 1 | 0 | 0 | 14-7 | 3.39 | 14 |
 Tyler Rogers | 0.1 | 2 | 1 | 1 | 0 | 0 | 1 | 11-9 | 1.80 | 11 |
Baltimore Orioles
| Player | IP | H | R | ER | BB | K | HR | PC-ST | ERA | PC |
|---|---|---|---|---|---|---|---|---|---|---|
 Shane Baz | 6.2 | 5 | 3 | 3 | 3 | 2 | 0 | 92-59 | 4.11 | 92 |
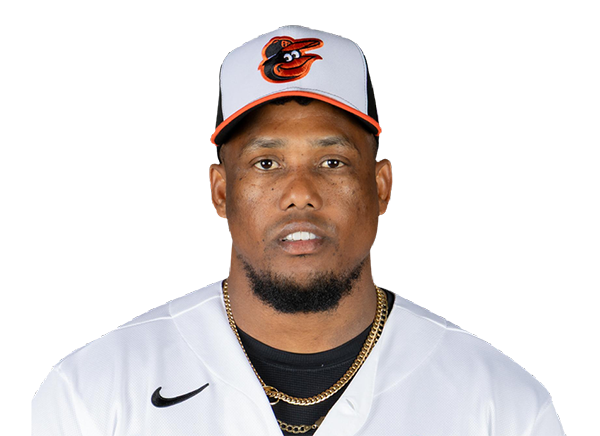 Yennier Cano | 1.1 | 1 | 0 | 0 | 0 | 1 | 0 | 18-13 | 2.92 | 18 |
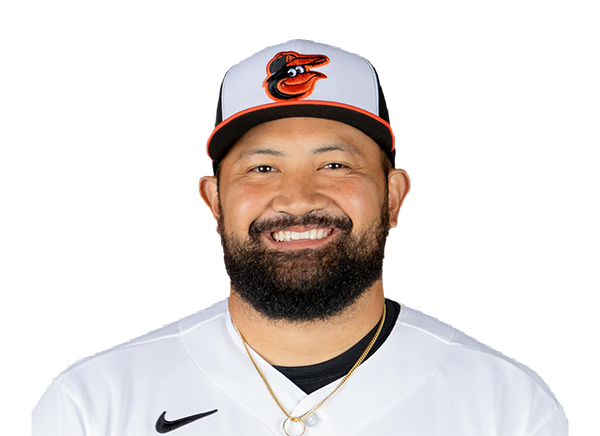 Rico Garcia | 1.0 | 0 | 0 | 0 | 0 | 2 | 0 | 17-12 | 3.14 | 17 |
H2H / Season Series
BAL4–3
TOR
TOR8–1
BAL
TOR7–3
BAL
TOR4–7
BAL
TOR6–4
BAL
TOR6–4
BAL
TOR3–13
BAL
BAL9–5
TOR
BAL6–5
TOR
BAL5–6
TOR
Last 5 Games
| Date | Opponent | Result |
|---|---|---|
| Sep 21 | @ BAL | L3–4 |
| Sep 20 |  @ TEX | W7–2 |
| Sep 19 | @ TEX | L2–6 |
| Sep 18 | @ TEX | L1–7 |
| Sep 16 |  vs DET | W5–1 |
| Date | Opponent | Result |
|---|---|---|
| Sep 21 | vs TOR | W4–3 |
| Sep 20 |  vs MIL | L0–3 |
| Sep 19 | vs MIL | L0–1 |
| Sep 18 | vs MIL | L5–6 |
| Sep 16 |  @ NYM | W7–1 |
Standings
American League
| Team | W | L | PCT | GB | DIFF | STRK |
|---|---|---|---|---|---|---|
1 Rays | 95 | 60 | .613 | - | +83 | W2 |
2 Guardians | 81 | 75 | .519 | 14.5 | +2 | W5 |
| 3Rangers | 78 | 78 | .500 | 17.5 | -34 | L1 |
4 Yankees | 89 | 66 | .574 | 6 | +137 | L2 |
5 Red Sox | 84 | 72 | .538 | 11.5 | +80 | L2 |
6 White Sox | 80 | 76 | .513 | 15.5 | +42 | W2 |
7 Astros | 77 | 79 | .494 | 18.5 | -59 | L3 |
| 8Blue Jays | 77 | 80 | .490 | 19 | -43 | L1 |
| 9Orioles | 76 | 81 | .484 | 20 | -30 | W1 |
| 10Tigers | 74 | 83 | .471 | 22 | +75 | W1 |
11 Mariners | 73 | 83 | .468 | 22.5 | -56 | W1 |
12 Twins | 73 | 84 | .465 | 23 | -67 | L1 |
13 Royals | 67 | 89 | .429 | 28.5 | -102 | L4 |
14 Athletics | 61 | 95 | .391 | 34.5 | -223 | L6 |
15 Angels | 60 | 96 | .385 | 35.5 | -87 | L1 |
National League
| Team | W | L | PCT | GB | DIFF | STRK |
|---|---|---|---|---|---|---|
| 1Brewers | 98 | 58 | .628 | - | +202 | W3 |
2 Dodgers | 96 | 60 | .615 | 2 | +193 | W4 |
3 Braves | 92 | 64 | .590 | 6 | +120 | W3 |
4 Cubs | 87 | 69 | .558 | 11 | +152 | W2 |
5 Padres | 87 | 69 | .558 | 11 | +41 | W5 |
6 Phillies | 86 | 70 | .551 | 12 | +29 | W1 |
7 Diamondbacks | 82 | 74 | .526 | 16 | -1 | W2 |
8 Pirates | 79 | 77 | .506 | 19 | +29 | W4 |
9 Marlins | 76 | 80 | .487 | 22 | -3 | L3 |
10 Cardinals | 76 | 80 | .487 | 22 | -23 | W1 |
11 Nationals | 73 | 84 | .465 | 25.5 | +5 | L2 |
12 Reds | 72 | 84 | .462 | 26 | -163 | L2 |
| 13Mets | 71 | 85 | .455 | 27 | -41 | L1 |
14 Giants | 65 | 92 | .414 | 33.5 | -81 | W1 |
15 Rockies | 57 | 99 | .365 | 41 | -177 | L1 |
TOR
VS
BAL
Pitchers
Trey Yesavage
Catchers
Alejandro Kirk
Infielders
Sean Keys
Kazuma Okamoto
Andres Gimenez
Ernie Clement
Outfielders
Brett Bateman
Nathan Lukes
Josh Smith
Designated Hitters
George Springer
Pitchers
Shane Baz
Catchers
Samuel Basallo
Infielders
Pete Alonso
Gunnar Henderson
Christian Encarnacion-Strand
Jose Barrero
Outfielders
Dylan Beavers
Rece Hinds
Colton Cowser
Designated Hitters
Coby Mayo
Blue Jays
VS
Orioles
Batting
157
Team Games Played
157
5289
At Bats
5239
1311
Hits
1224
601
Runs Batted In
672
149
Home Runs
192
75
Stolen Bases
76
.248
Batting Average
.234
632
Runs
697
247
Doubles
229
8
Triples
20
2021
Total Bases
2069
444
Walks
571
1116
Strikeouts
1474
.310
On Base Percentage
.314
.382
Slugging Percentage
.395
.692
OBP Pct + SLG Pct
.709
157
Games Played
157
157
Games Started
157
57
Hit By Pitch
61
0.0
Wins Above Replacement
0.0
0.0
Offensive Wins Above Replacement
0.0
17
Caught Stealing
32
1
Is Qualified
1
629.1
Runs Created
659.5
4.1
Runs Created Per 27 Outs
4.2
.076
Walks Per Plate Appearance
.096
0.40
Walk To Strikeout Ratio
0.39
.134
Isolated Power
.161
.229
Secondary Average
.279
3.81
Pitches Per Plate Appearance
3.98
404
Extra Base Hits
441
5866
Plate Appearances
5928
35.5
At Bats Per Home Run
27.3
24
Sacrifice Hit
18
49
Sacrifice Flies
37
Pitching
157
Team Games Played
157
45
Quality Starts
61
77
Wins
76
80
Losses
81
51
Saves
45
104
Holds
80
1231
Hits
1353
606
Earned runs
640
163
Home Runs
168
581
Walks
525
1365
Strikeouts
1269
8.8
Strikeouts Per 9 Innings
8.2
148.6
Pitches Per Start
146.3
1.30
Walks Plus Hits Per Inning Pitched
1.34
3.92
Earned Run Average
4.11
80
Losses
81
1393.0
Innings pitched
1401.1
.490
Win Percentage
.484
68
Save Opportunities
67
.236
Opponent Batting Average
.252
.315
Opponent's On-base pct.
.322
.372
Opponent's Slugging pct.
.405
.687
Opponent's OPB Pct + SLG Pct
.727
5224
At Bats
5360
205
Doubles
260
10
Triples
27
43
Batters Hit
49
142
Stolen Bases
90
157
Games Played
157
1
Complete Games
1
11
Shutouts
2
49
Wild Pitches
44
635
Runs Batted In
698
8
Balks
4
1393.0
Innings pitched
1401.1
8.8
Strikeouts Per 9 Innings
8.2
43
Caught Stealing
37
157
Games Started
157
0.0
Wins Above Replacement
0.0
1
Is Qualified
1
675
Runs
727
606
Earned Runs
640
1945
Total Bases
2171
Fielding
157
Team Games Played
157
1393
Full Innings
1401
5593
Total Chances
5637
4179
Putouts
4204
1318
Assists
1341
96
Errors
92
247
Double Plays
229
0.983
Fielding Percentage
0.984
35.5
Range Factor
35.6
0.0
Zone Rating
0.0
157
Games Played
157
0
Games Started
0
0.0
Defensive Wins Above Replacement
0.0
1
Qualified
1