

Blue Jays vs Orioles Live Score (23 Sep, 2026)
Game Information
Stage
STD
Season
2026
First Pitch
Wed, Sep 23, 6:35 pm
Venue
Oriole Park at Camden Yards
Location
Baltimore, Maryland
Venue Type
Outdoor
Broadcast
MLB.TV
Attendance
19,824
Live Situation
0Balls
2Strikes
0Outs
—Pitcher
—At Bat
Pitch Sequence
1
STRIKE LOOKING
Sinker
93 MPH
2
STRIKE SWINGING
Splitter
88 MPH
3
BALL IN PLAY
Splitter
89 MPH
Injury Report

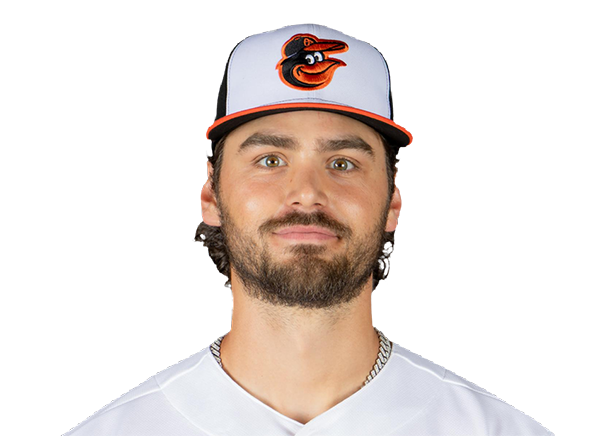

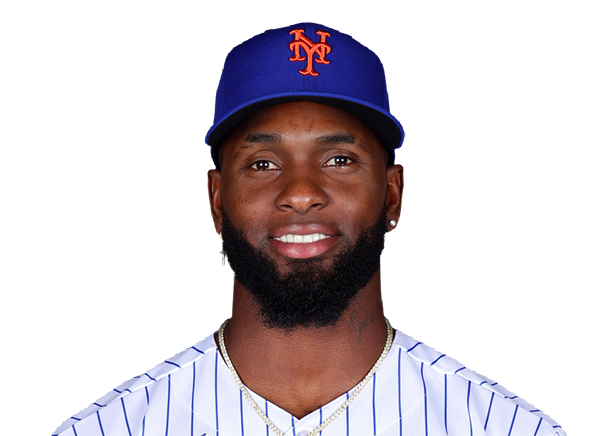
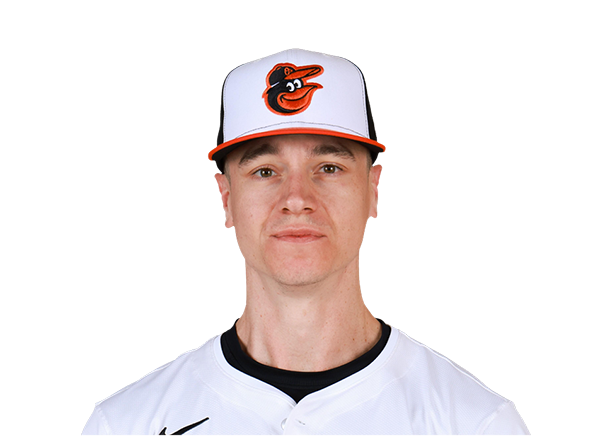
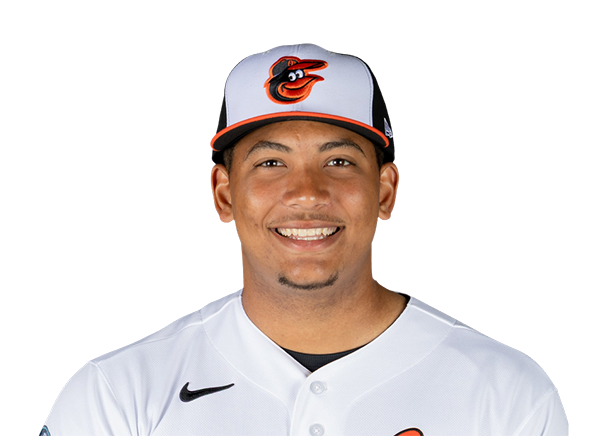
Team Stats
 TOR
BAL


2
Runs
4
6
Hits
4
0
Errors
1
1
Home Runs
1
3
Walks
1
9
Strikeouts
5
Player Box Score
Toronto Blue Jays
| Player | H-AB | AB | R | H | RBI | HR | BB | K | #P | AVG | OBP | SLG |
|---|---|---|---|---|---|---|---|---|---|---|---|---|
 Nathan Lukes | 2-4 | 4 | 0 | 2 | 0 | 0 | 0 | 0 | 17 | .276 | .324 | .386 |
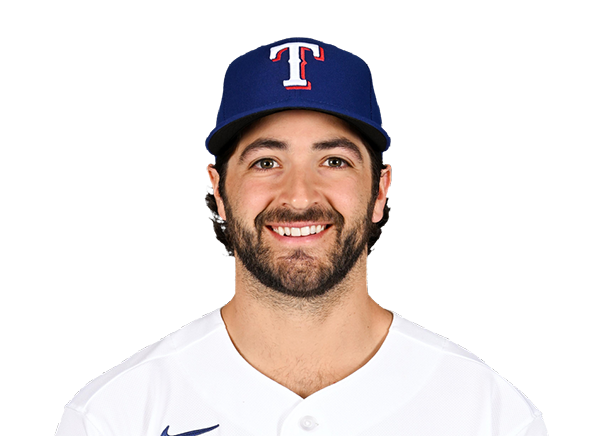 Josh Smith | 0-4 | 4 | 0 | 0 | 0 | 0 | 0 | 1 | 17 | .205 | .295 | .322 |
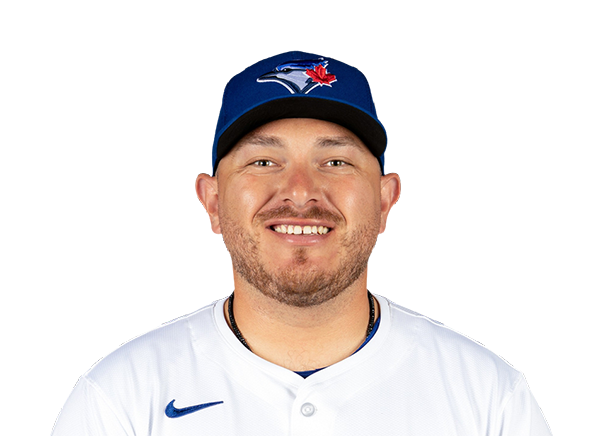 Alejandro Kirk | 1-4 | 4 | 0 | 1 | 0 | 0 | 0 | 2 | 22 | .281 | .352 | .419 |
 Kazuma Okamoto | 0-4 | 4 | 0 | 0 | 0 | 0 | 0 | 2 | 12 | .232 | .307 | .452 |
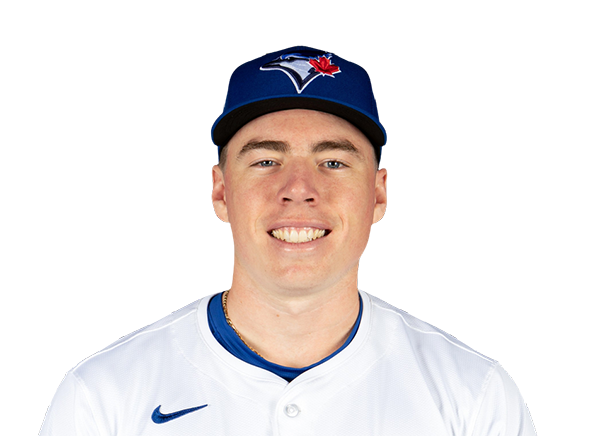 Sean Keys | 1-3 | 3 | 1 | 1 | 0 | 0 | 0 | 0 | 14 | .200 | .250 | .345 |
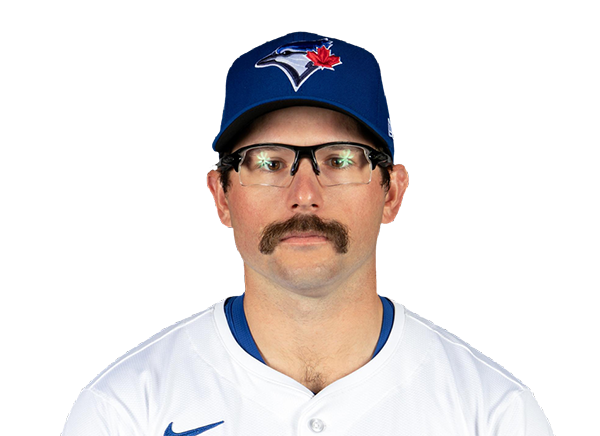 Davis Schneider | 1-2 | 2 | 1 | 1 | 2 | 1 | 2 | 0 | 15 | .150 | .304 | .325 |
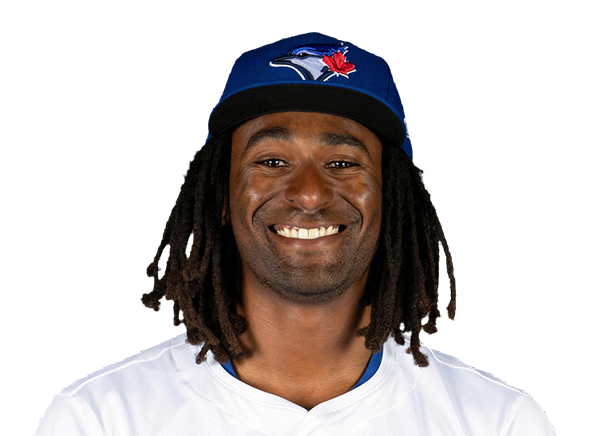 Charles McAdoo | 0-3 | 3 | 0 | 0 | 0 | 0 | 1 | 1 | 15 | .242 | .293 | .341 |
 Myles Straw | 1-4 | 4 | 0 | 1 | 0 | 0 | 0 | 2 | 14 | .238 | .302 | .341 |
 Ernie Clement | 0-3 | 3 | 0 | 0 | 0 | 0 | 0 | 1 | 11 | .264 | .290 | .371 |
Baltimore Orioles
| Player | H-AB | AB | R | H | RBI | HR | BB | K | #P | AVG | OBP | SLG |
|---|---|---|---|---|---|---|---|---|---|---|---|---|
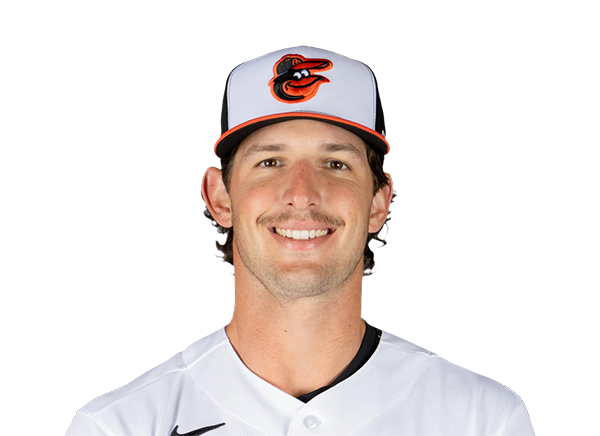 Dylan Beavers | 0-4 | 4 | 0 | 0 | 0 | 0 | 0 | 2 | 15 | .229 | .305 | .359 |
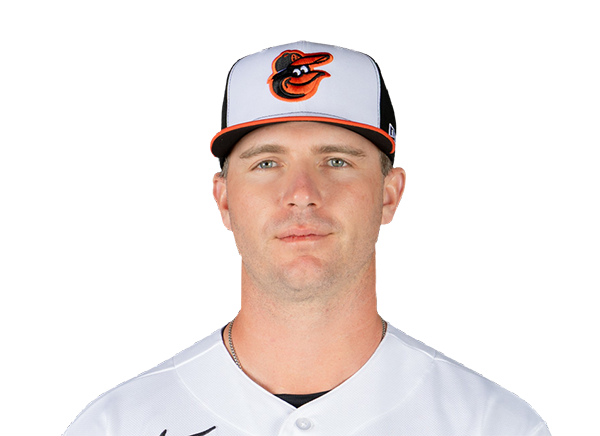 Pete Alonso | 0-3 | 3 | 1 | 0 | 0 | 0 | 0 | 1 | 16 | .264 | .359 | .512 |
 Gunnar Henderson | 0-2 | 2 | 0 | 0 | 0 | 0 | 1 | 1 | 11 | .225 | .310 | .405 |
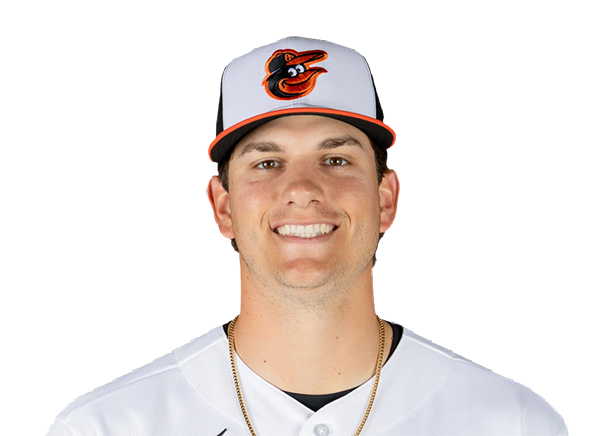 Coby Mayo | 1-3 | 3 | 1 | 1 | 0 | 0 | 0 | 0 | 16 | .225 | .293 | .463 |
 Christian Encarnacion-Strand | 2-3 | 3 | 2 | 2 | 3 | 1 | 0 | 0 | 12 | .274 | .324 | .511 |
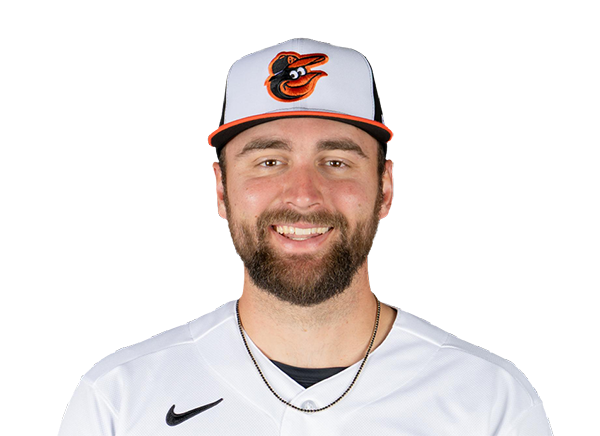 Colton Cowser | 1-3 | 3 | 0 | 1 | 1 | 0 | 0 | 0 | 13 | .223 | .313 | .365 |
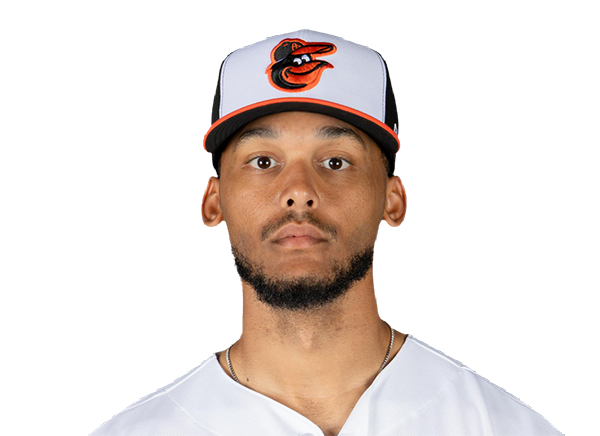 Jeremiah Jackson | 0-3 | 3 | 0 | 0 | 0 | 0 | 0 | 0 | 17 | .219 | .245 | .361 |
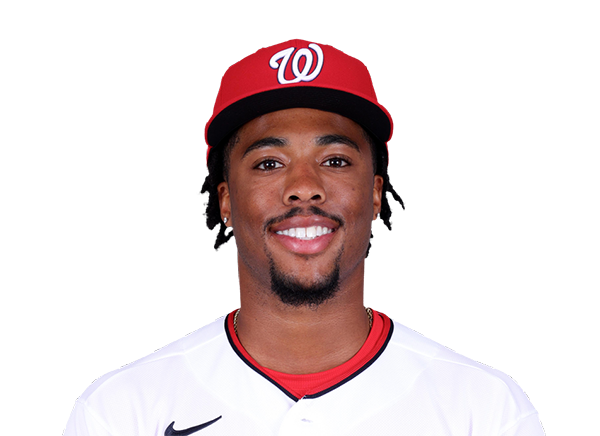 Christian Franklin | 0-3 | 3 | 0 | 0 | 0 | 0 | 0 | 0 | 12 | .125 | .286 | .175 |
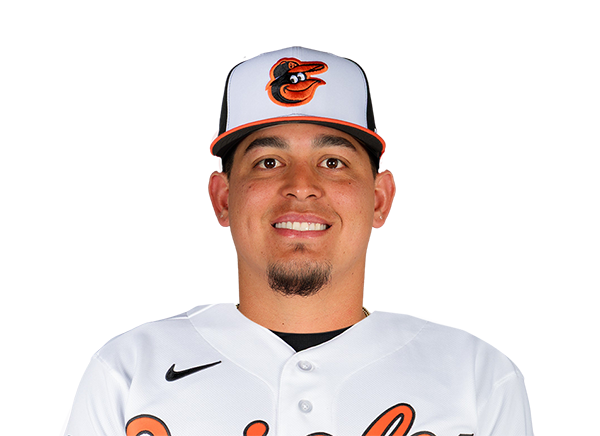 Yohel Pozo | 0-3 | 3 | 0 | 0 | 0 | 0 | 0 | 1 | 10 | .250 | .259 | .321 |
Toronto Blue Jays
| Player | IP | H | R | ER | BB | K | HR | PC-ST | ERA | PC |
|---|---|---|---|---|---|---|---|---|---|---|
 CJ Van Eyk | 5.0 | 4 | 4 | 4 | 0 | 2 | 1 | 84-57 | 5.40 | 84 |
 Brendan Cellucci | 1.1 | 0 | 0 | 0 | 1 | 0 | 0 | 19-9 | 0.00 | 19 |
 Chase Lee | 1.2 | 0 | 0 | 0 | 0 | 3 | 0 | 19-13 | 6.52 | 19 |
Baltimore Orioles
| Player | IP | H | R | ER | BB | K | HR | PC-ST | ERA | PC |
|---|---|---|---|---|---|---|---|---|---|---|
 Trey Gibson | 6.2 | 3 | 0 | 0 | 2 | 7 | 0 | 92-65 | 6.13 | 92 |
 Yennier Cano | 0.1 | 0 | 0 | 0 | 1 | 1 | 0 | 10-5 | 2.90 | 10 |
 Josh Walker | 1.0 | 1 | 0 | 0 | 0 | 0 | 0 | 17-10 | 1.52 | 17 |
 Felix Bautista | 1.0 | 2 | 2 | 2 | 0 | 1 | 1 | 18-14 | 16.20 | 18 |
H2H / Season Series
BAL4–2
TOR
BAL4–2
TOR
BAL4–3
TOR
TOR8–1
BAL
TOR7–3
BAL
TOR4–7
BAL
TOR6–4
BAL
TOR6–4
BAL
TOR3–13
BAL
BAL9–5
TOR
Last 5 Games
| Date | Opponent | Result |
|---|---|---|
| Sep 23 | @ BAL | L2–4 |
| Sep 23 | @ BAL | L2–4 |
| Sep 22 | @ BAL | T0–0 |
| Sep 21 | @ BAL | L3–4 |
| Sep 20 |  @ TEX | W7–2 |
| Date | Opponent | Result |
|---|---|---|
| Sep 23 | vs TOR | W4–2 |
| Sep 23 | vs TOR | W4–2 |
| Sep 22 | vs TOR | T0–0 |
| Sep 21 | vs TOR | W4–3 |
| Sep 20 |  vs MIL | L0–3 |
Standings
American League
| Team | W | L | PCT | GB | DIFF | STRK |
|---|---|---|---|---|---|---|
1 Rays | 96 | 62 | .608 | - | +79 | L1 |
2 Guardians | 82 | 76 | .519 | 14 | +2 | L1 |
3 Astros | 78 | 80 | .494 | 18 | -53 | L1 |
4 Yankees | 91 | 67 | .576 | 5 | +141 | W1 |
5 Red Sox | 85 | 73 | .538 | 11 | +80 | W1 |
6 White Sox | 81 | 77 | .513 | 15 | +44 | L1 |
| 7Rangers | 78 | 80 | .494 | 18 | -42 | L3 |
| 8Orioles | 78 | 81 | .491 | 18.5 | -26 | W3 |
| 9Blue Jays | 77 | 82 | .484 | 19.5 | -47 | L3 |
10 Twins | 75 | 84 | .472 | 21.5 | -64 | W2 |
11 Mariners | 74 | 84 | .468 | 22 | -62 | W1 |
12 Tigers | 74 | 85 | .465 | 22.5 | +71 | L2 |
13 Royals | 68 | 90 | .430 | 28 | -104 | W1 |
14 Athletics | 63 | 95 | .399 | 33 | -217 | W2 |
15 Angels | 60 | 98 | .380 | 36 | -93 | L3 |
National League
| Team | W | L | PCT | GB | DIFF | STRK |
|---|---|---|---|---|---|---|
| 1Brewers | 99 | 59 | .627 | - | +203 | W1 |
2 Dodgers | 97 | 61 | .614 | 2 | +196 | L1 |
3 Braves | 93 | 65 | .589 | 6 | +117 | W1 |
4 Padres | 88 | 70 | .557 | 11 | +38 | W1 |
5 Cubs | 87 | 71 | .551 | 12 | +145 | L2 |
6 Phillies | 87 | 71 | .551 | 12 | +28 | L1 |
7 Diamondbacks | 84 | 74 | .532 | 15 | +6 | W4 |
8 Pirates | 80 | 78 | .506 | 19 | +27 | L1 |
9 Marlins | 78 | 80 | .494 | 21 | +4 | W2 |
10 Cardinals | 77 | 81 | .487 | 22 | -21 | W1 |
11 Nationals | 75 | 84 | .472 | 24.5 | +9 | W2 |
12 Reds | 73 | 85 | .462 | 26 | -160 | L1 |
13 Mets | 73 | 85 | .462 | 26 | -33 | W2 |
14 Giants | 65 | 94 | .409 | 34.5 | -84 | L2 |
15 Rockies | 57 | 101 | .361 | 42 | -184 | L3 |
TOR
VS
BAL
Pitchers
CJ Van Eyk
Catchers
Alejandro Kirk
Infielders
Josh Smith
Sean Keys
Charles McAdoo
Ernie Clement
Outfielders
Nathan Lukes
Davis Schneider
Myles Straw
Designated Hitters
Kazuma Okamoto
Pitchers
Trey Gibson
Catchers
Yohel Pozo
Infielders
Pete Alonso
Gunnar Henderson
Coby Mayo
Jeremiah Jackson
Outfielders
Dylan Beavers
Colton Cowser
Christian Franklin
Designated Hitters
Christian Encarnacion-Strand
Blue Jays
VS
Orioles
Batting
159
Team Games Played
159
5356
At Bats
5295
1327
Hits
1233
604
Runs Batted In
679
150
Home Runs
194
75
Stolen Bases
76
.248
Batting Average
.233
636
Runs
705
251
Doubles
231
8
Triples
20
2044
Total Bases
2086
448
Walks
576
1129
Strikeouts
1489
.310
On Base Percentage
.313
.382
Slugging Percentage
.394
.692
OBP Pct + SLG Pct
.707
159
Games Played
159
159
Games Started
159
57
Hit By Pitch
62
0.0
Wins Above Replacement
0.0
0.0
Offensive Wins Above Replacement
0.0
17
Caught Stealing
33
1
Is Qualified
1
634.6
Runs Created
662.8
4.0
Runs Created Per 27 Outs
4.2
.075
Walks Per Plate Appearance
.096
0.40
Walk To Strikeout Ratio
0.39
.134
Isolated Power
.161
.228
Secondary Average
.278
3.81
Pitches Per Plate Appearance
3.98
409
Extra Base Hits
445
5937
Plate Appearances
5990
35.7
At Bats Per Home Run
27.3
24
Sacrifice Hit
18
49
Sacrifice Flies
37
Pitching
159
Team Games Played
159
45
Quality Starts
62
77
Wins
78
82
Losses
81
51
Saves
46
104
Holds
84
1240
Hits
1369
614
Earned runs
644
165
Home Runs
169
586
Walks
529
1380
Strikeouts
1282
8.8
Strikeouts Per 9 Innings
8.1
148.4
Pitches Per Start
146.2
1.30
Walks Plus Hits Per Inning Pitched
1.34
3.92
Earned Run Average
4.08
82
Losses
81
1409.0
Innings pitched
1419.1
.484
Win Percentage
.491
68
Save Opportunities
68
.235
Opponent Batting Average
.252
.314
Opponent's On-base pct.
.321
.372
Opponent's Slugging pct.
.404
.686
Opponent's OPB Pct + SLG Pct
.726
5280
At Bats
5428
207
Doubles
264
10
Triples
27
44
Batters Hit
49
142
Stolen Bases
90
159
Games Played
159
1
Complete Games
1
11
Shutouts
2
49
Wild Pitches
44
642
Runs Batted In
701
8
Balks
4
1409.0
Innings pitched
1419.1
8.8
Strikeouts Per 9 Innings
8.1
44
Caught Stealing
37
159
Games Started
159
0.0
Wins Above Replacement
0.0
1
Is Qualified
1
683
Runs
731
614
Earned Runs
644
1962
Total Bases
2194
Fielding
159
Team Games Played
159
1409
Full Innings
1419
5658
Total Chances
5715
4227
Putouts
4258
1334
Assists
1363
97
Errors
94
251
Double Plays
231
0.983
Fielding Percentage
0.984
35.5
Range Factor
35.6
0.0
Zone Rating
0.0
159
Games Played
159
0
Games Started
0
0.0
Defensive Wins Above Replacement
0.0
1
Qualified
1