

Blue Jays vs Twins Live Score (2 May, 2026)
Game Information
Stage
Standard
Season
2026
First Pitch
Fri, May 1, 8:10 pm
Venue
Target Field
Location
Minneapolis, Minnesota
Attendance
19,762
Live Situation
1Balls
3Strikes
0Outs
—Pitcher
—At Bat
Pitch Sequence
1
STRIKE LOOKING
Slider
91 MPH
2
BALL
Changeup
92 MPH
3
STRIKE LOOKING
Four-seam FB
98 MPH
4
STRIKE FOUL
Four-seam FB
99 MPH
5
STRIKE FOUL
Four-seam FB
98 MPH
6
STRIKE SWINGING
Knuckle Curve
87 MPH
Injury Report
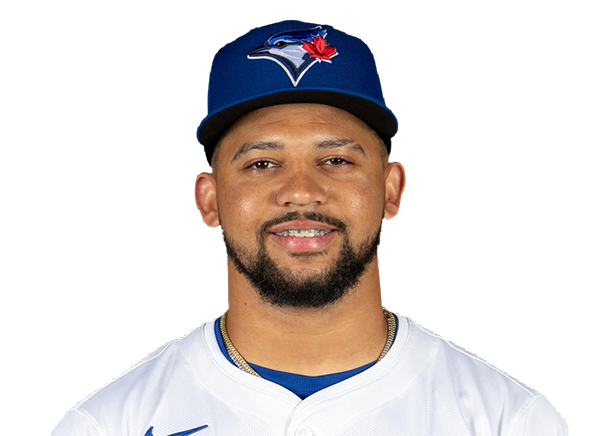
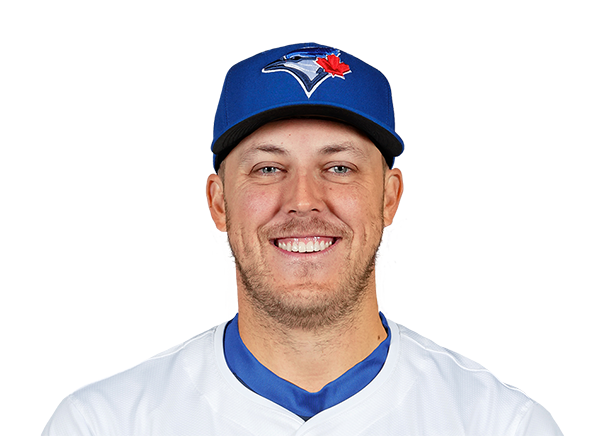

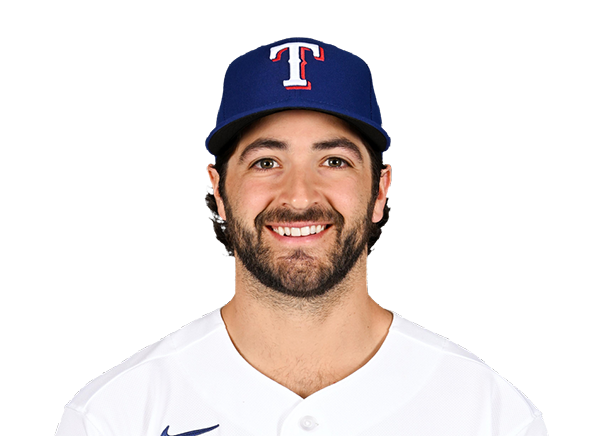
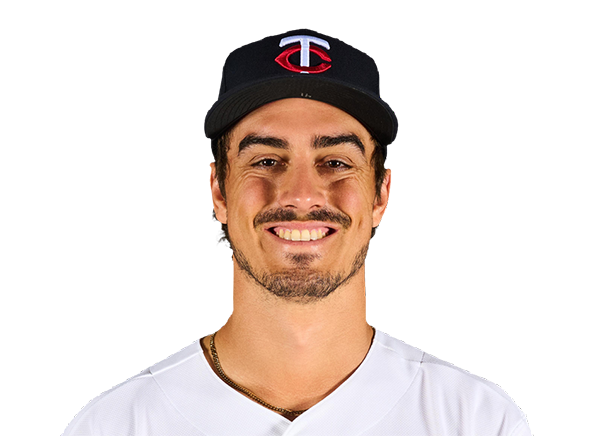

Team Stats
 TOR
MIN


7
Runs
3
11
Hits
10
0
Errors
1
2
Home Runs
1
2
Walks
2
3
Strikeouts
10
Player Box Score
Toronto Blue Jays
| Player | H-AB | AB | R | H | RBI | HR | BB | K | #P | AVG | OBP | SLG |
|---|---|---|---|---|---|---|---|---|---|---|---|---|
 George Springer | 1-5 | 5 | 0 | 1 | 0 | 0 | 0 | 0 | 11 | .215 | .301 | .369 |
 Jesus Sanchez | 0-5 | 5 | 0 | 0 | 0 | 0 | 0 | 1 | 19 | .240 | .283 | .406 |
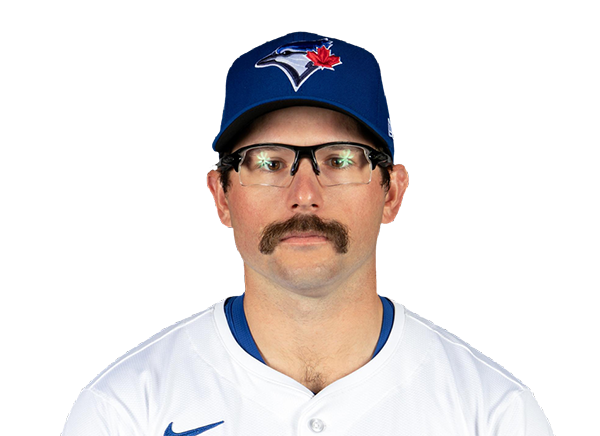 Davis Schneider | 0-0 | 0 | 0 | 0 | 0 | 0 | 0 | 0 | 0 | .125 | .311 | .229 |
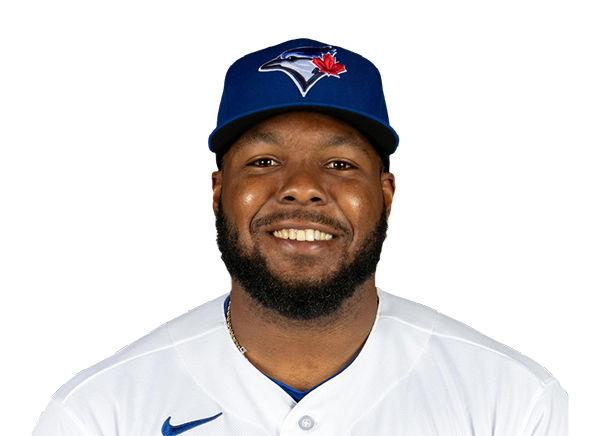 Vladimir Guerrero Jr. | 0-4 | 4 | 1 | 0 | 0 | 0 | 1 | 0 | 16 | .342 | .430 | .453 |
 Kazuma Okamoto | 2-4 | 4 | 3 | 2 | 3 | 2 | 1 | 0 | 25 | .228 | .313 | .430 |
 Daulton Varsho | 1-5 | 5 | 1 | 1 | 0 | 0 | 0 | 0 | 14 | .233 | .307 | .398 |
 Lenyn Sosa | 3-4 | 4 | 2 | 3 | 0 | 0 | 0 | 0 | 10 | .281 | .273 | .375 |
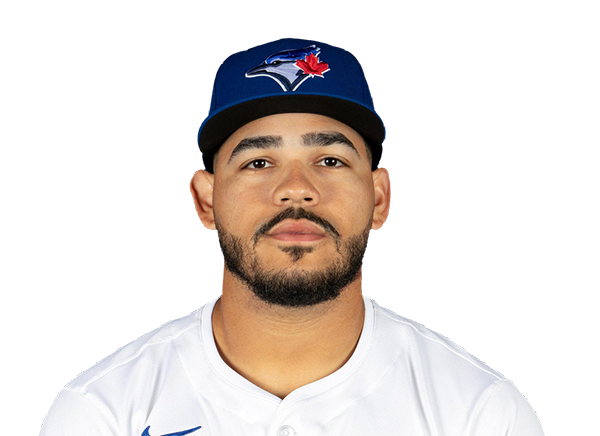 Yohendrick Pinango | 3-4 | 4 | 0 | 3 | 2 | 0 | 0 | 0 | 17 | .500 | .545 | .500 |
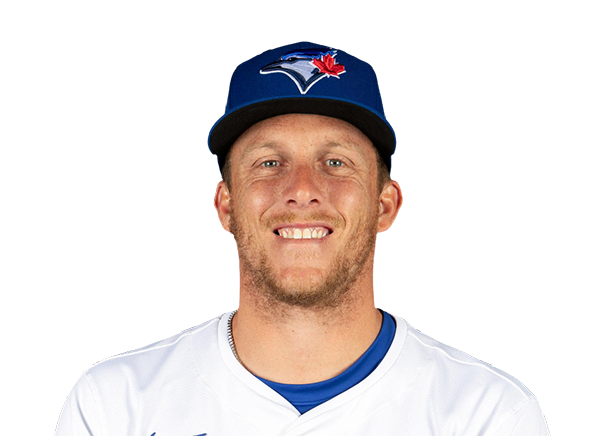 Myles Straw | 0-0 | 0 | 0 | 0 | 0 | 0 | 0 | 0 | 0 | .277 | .327 | .383 |
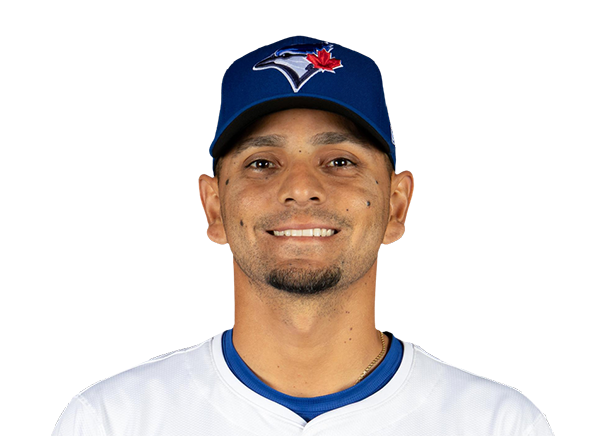 Andres Gimenez | 0-4 | 4 | 0 | 0 | 0 | 0 | 0 | 1 | 12 | .257 | .281 | .413 |
 Tyler Heineman | 1-3 | 3 | 0 | 1 | 0 | 0 | 0 | 1 | 14 | .188 | .235 | .188 |
Minnesota Twins
| Player | H-AB | AB | R | H | RBI | HR | BB | K | #P | AVG | OBP | SLG |
|---|---|---|---|---|---|---|---|---|---|---|---|---|
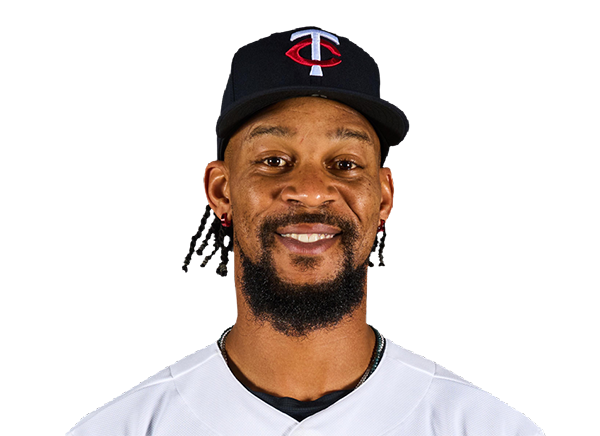 Byron Buxton | 2-4 | 4 | 1 | 2 | 2 | 1 | 1 | 0 | 19 | .260 | .317 | .528 |
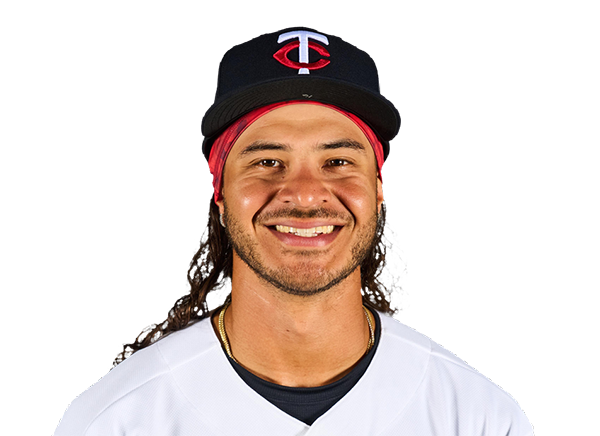 Austin Martin | 3-5 | 5 | 0 | 3 | 0 | 0 | 0 | 0 | 18 | .333 | .484 | .435 |
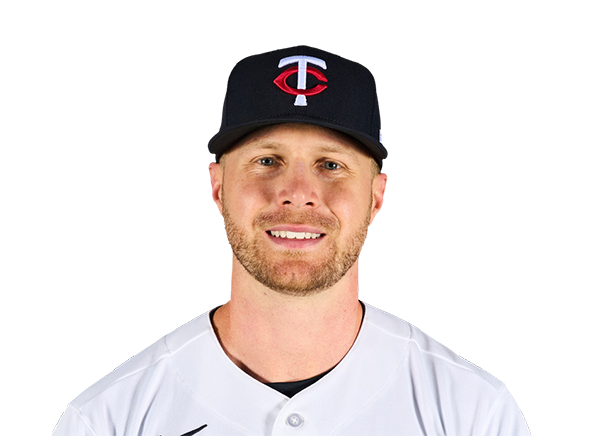 Ryan Jeffers | 1-4 | 4 | 0 | 1 | 1 | 0 | 0 | 2 | 23 | .301 | .410 | .494 |
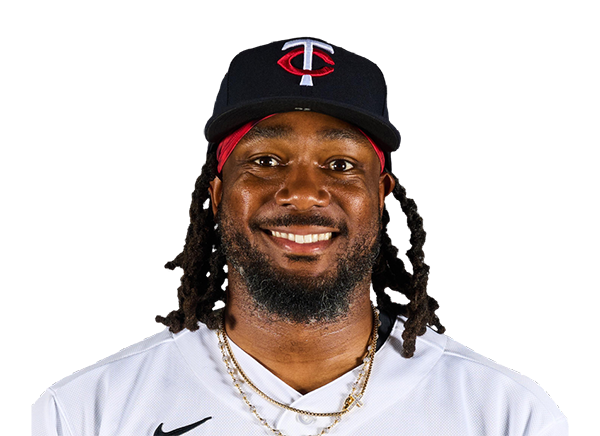 Josh Bell | 1-4 | 4 | 0 | 1 | 0 | 0 | 0 | 1 | 12 | .226 | .313 | .348 |
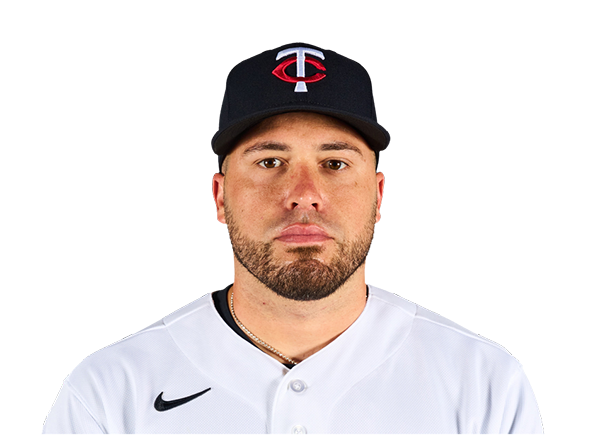 Victor Caratini | 0-3 | 3 | 0 | 0 | 0 | 0 | 0 | 1 | 8 | .213 | .309 | .263 |
 Luke Keaschall | 0-3 | 3 | 0 | 0 | 0 | 0 | 1 | 2 | 15 | .211 | .267 | .268 |
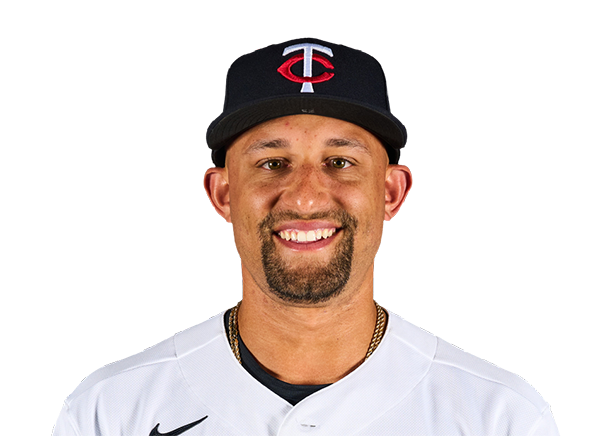 Royce Lewis | 0-4 | 4 | 0 | 0 | 0 | 0 | 0 | 2 | 14 | .186 | .288 | .343 |
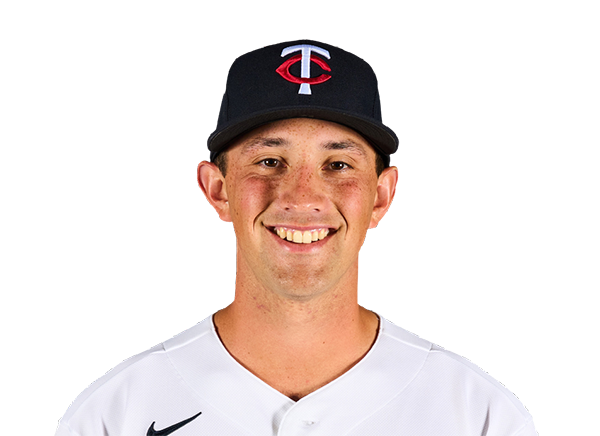 Brooks Lee | 2-4 | 4 | 2 | 2 | 0 | 0 | 0 | 1 | 15 | .252 | .313 | .417 |
 James Outman | 1-4 | 4 | 0 | 1 | 0 | 0 | 0 | 1 | 16 | .129 | .182 | .194 |
Toronto Blue Jays
| Player | IP | H | R | ER | BB | K | HR | PC-ST | ERA | PC |
|---|---|---|---|---|---|---|---|---|---|---|
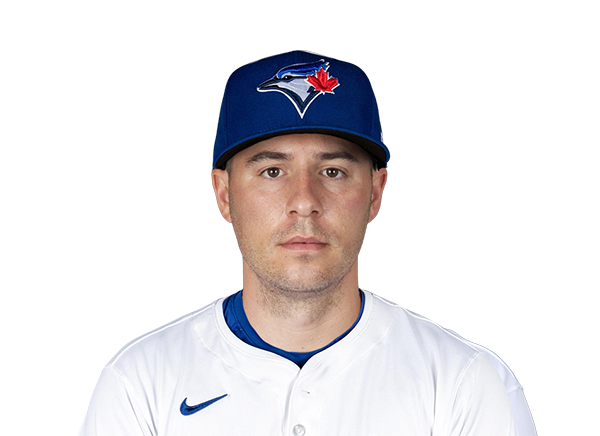 Patrick Corbin | 5.1 | 6 | 2 | 2 | 1 | 4 | 1 | 79-53 | 3.65 | 79 |
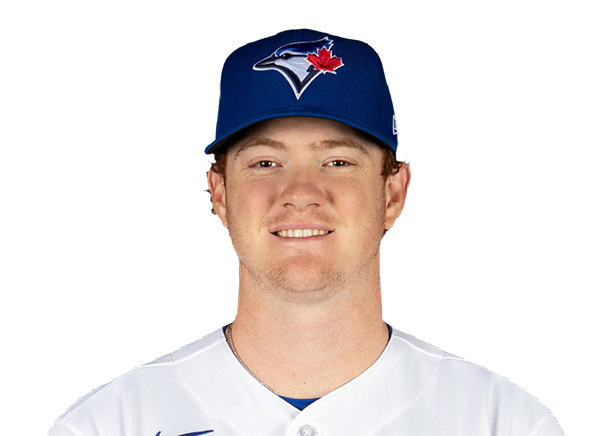 Braydon Fisher | 0.2 | 0 | 0 | 0 | 0 | 1 | 0 | 9-6 | 1.53 | 9 |
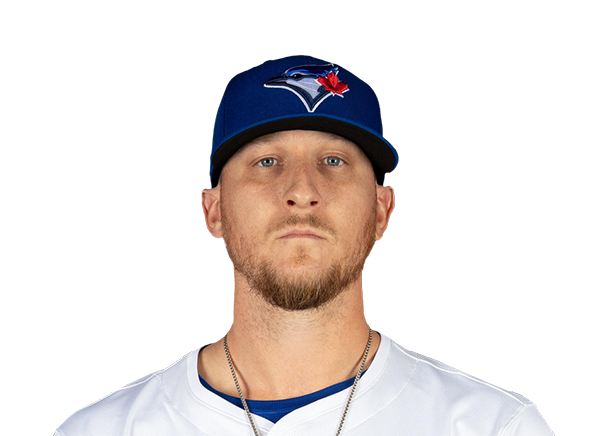 Jeff Hoffman | 1.0 | 3 | 1 | 1 | 0 | 1 | 0 | 16-14 | 6.59 | 16 |
 Tyler Rogers | 1.0 | 0 | 0 | 0 | 0 | 2 | 0 | 9-7 | 0.55 | 9 |
 Louis Varland | 1.0 | 1 | 0 | 0 | 1 | 2 | 0 | 27-16 | 0.53 | 27 |
Minnesota Twins
| Player | IP | H | R | ER | BB | K | HR | PC-ST | ERA | PC |
|---|---|---|---|---|---|---|---|---|---|---|
 Simeon Woods Richardson | 4.2 | 9 | 6 | 4 | 1 | 2 | 2 | 88-60 | 6.49 | 88 |
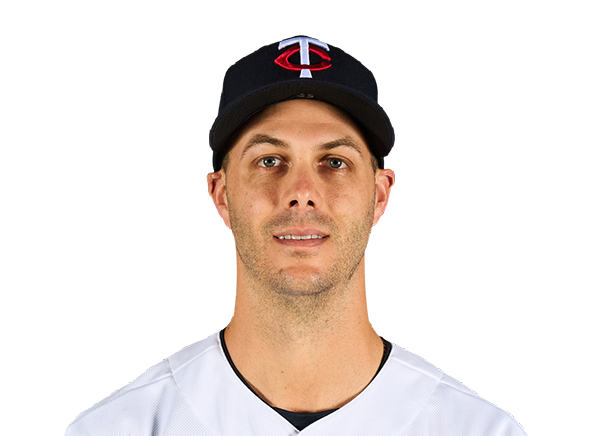 Taylor Rogers | 1.0 | 1 | 0 | 0 | 0 | 0 | 0 | 8-8 | 5.56 | 8 |
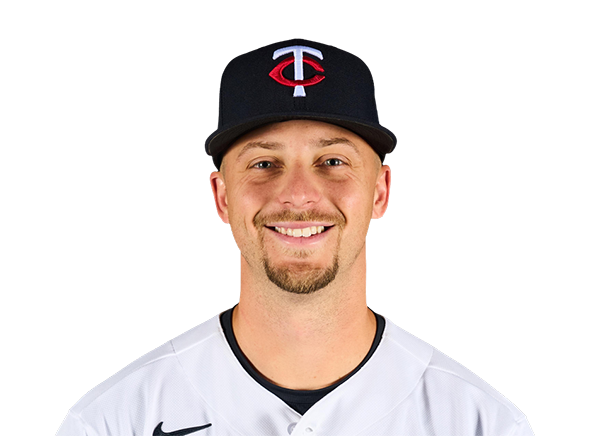 Eric Orze | 2.1 | 1 | 1 | 1 | 1 | 1 | 0 | 33-22 | 5.02 | 33 |
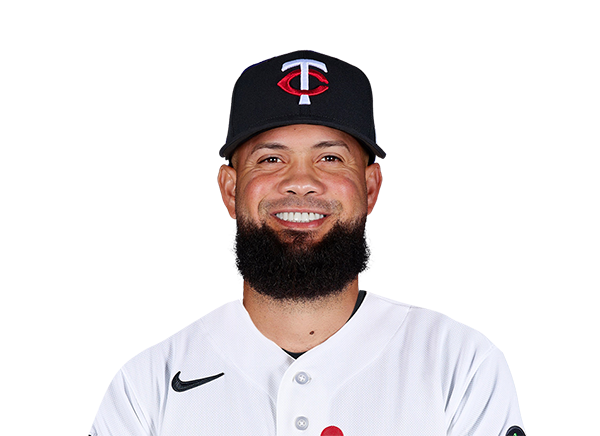 Luis Garcia | 1.0 | 0 | 0 | 0 | 0 | 0 | 0 | 9-6 | 7.56 | 9 |
H2H / Season Series
MIN4–3
TOR
MIN4–11
TOR
MIN3–7
TOR
MIN7–1
TOR
TOR2–8
MIN
TOR4–7
MIN
TOR10–4
MIN
MIN1–2
TOR
TOR6–1
MIN
Last 5 Games
| Date | Opponent | Result |
|---|---|---|
| Aug 22 |  @ NYY | W4–3 |
| Aug 21 | @ NYY | L1–3 |
| Aug 20 |  @ TB | W5–1 |
| Aug 19 | @ TB | L6–7 |
| Aug 18 | @ TB | W10–5 |
| Date | Opponent | Result |
|---|---|---|
| Aug 22 |  @ SD | L5–7 |
| Aug 21 | @ SD | L2–6 |
| Aug 19 |  vs ATL | W6–4 |
| Aug 18 | vs ATL | W4–1 |
| Aug 17 | vs ATL | W4–2 |
Standings
American League
| Team | W | L | PCT | GB | DIFF | STRK |
|---|---|---|---|---|---|---|
| 1Rays | 76 | 53 | .589 | - | +42 | L3 |
2 White Sox | 67 | 62 | .519 | 9 | +42 | L1 |
3 Astros | 65 | 65 | .500 | 11.5 | -43 | L1 |
| 4Yankees | 73 | 56 | .566 | 3 | +95 | L1 |
5 Red Sox | 70 | 59 | .543 | 6 | +98 | W2 |
6 Rangers | 64 | 66 | .492 | 12.5 | -48 | L1 |
7 Guardians | 64 | 66 | .492 | 12.5 | -14 | W3 |
| 8Blue Jays | 64 | 67 | .489 | 13 | -50 | W1 |
| 9Twins | 63 | 67 | .485 | 13.5 | -47 | L2 |
10 Orioles | 63 | 67 | .485 | 13.5 | -33 | W2 |
11 Mariners | 62 | 68 | .477 | 14.5 | -44 | W2 |
12 Tigers | 61 | 68 | .473 | 15 | +77 | L4 |
13 Royals | 57 | 74 | .435 | 20 | -95 | W7 |
14 Angels | 52 | 78 | .400 | 24.5 | -68 | W1 |
15 Athletics | 50 | 80 | .385 | 26.5 | -188 | W1 |
National League
| Team | W | L | PCT | GB | DIFF | STRK |
|---|---|---|---|---|---|---|
1 Brewers | 81 | 49 | .623 | - | +163 | W3 |
2 Dodgers | 79 | 51 | .608 | 2 | +147 | W5 |
| 3Braves | 75 | 55 | .577 | 6 | +108 | L2 |
4 Cubs | 74 | 56 | .569 | 7 | +98 | L3 |
5 Phillies | 72 | 58 | .554 | 9 | +25 | W8 |
| 6Padres | 70 | 60 | .538 | 11 | +9 | W2 |
7 Diamondbacks | 68 | 62 | .523 | 13 | +7 | L1 |
8 Marlins | 66 | 64 | .508 | 15 | +17 | W2 |
9 Cardinals | 66 | 65 | .504 | 15.5 | 0 | L2 |
10 Pirates | 63 | 68 | .481 | 18.5 | +29 | L2 |
11 Reds | 62 | 68 | .477 | 19 | -92 | W1 |
12 Nationals | 61 | 70 | .466 | 20.5 | +14 | L3 |
13 Mets | 59 | 71 | .454 | 22 | -39 | W1 |
14 Giants | 52 | 77 | .403 | 28.5 | -79 | L3 |
15 Rockies | 50 | 79 | .388 | 30.5 | -131 | L5 |
TOR
VS
MIN
Pitchers
Patrick Corbin
Braydon Fisher
Jeff Hoffman
Tyler Rogers
Louis Varland
Catchers
Tyler Heineman
Infielders
Vladimir Guerrero Jr.
Kazuma Okamoto
Lenyn Sosa
Andres Gimenez
Outfielders
Jesus Sanchez
Davis Schneider
Daulton Varsho
Yohendrick Pinango
Myles Straw
Designated Hitters
George Springer
Pitchers
Simeon Woods Richardson
Taylor Rogers
Eric Orze
Luis Garcia
Catchers
Victor Caratini
Infielders
Josh Bell
Luke Keaschall
Royce Lewis
Brooks Lee
Outfielders
Byron Buxton
Austin Martin
James Outman
Designated Hitters
Ryan Jeffers
Blue Jays
VS
Twins
Batting
130
Team Games Played
129
4383
At Bats
4342
1072
Hits
1064
491
Runs Batted In
566
123
Home Runs
147
65
Stolen Bases
74
.245
Batting Average
.245
514
Runs
594
204
Doubles
210
8
Triples
19
1661
Total Bases
1753
358
Walks
420
950
Strikeouts
1042
.306
On Base Percentage
.319
.379
Slugging Percentage
.404
.685
OBP Pct + SLG Pct
.723
130
Games Played
129
130
Games Started
129
46
Hit By Pitch
70
0.0
Wins Above Replacement
0.0
0.0
Offensive Wins Above Replacement
0.0
14
Caught Stealing
31
1
Is Qualified
1
511.0
Runs Created
569.2
4.0
Runs Created Per 27 Outs
4.5
.074
Walks Per Plate Appearance
.086
0.38
Walk To Strikeout Ratio
0.40
.134
Isolated Power
.159
.228
Secondary Average
.265
3.80
Pitches Per Plate Appearance
3.86
335
Extra Base Hits
376
4849
Plate Appearances
4876
35.6
At Bats Per Home Run
29.5
20
Sacrifice Hit
7
39
Sacrifice Flies
36
Pitching
130
Team Games Played
129
39
Quality Starts
43
63
Wins
63
67
Losses
66
43
Saves
37
83
Holds
88
1036
Hits
1100
509
Earned runs
586
133
Home Runs
148
474
Walks
470
1127
Strikeouts
1067
8.8
Strikeouts Per 9 Innings
8.4
148.9
Pitches Per Start
149.9
1.30
Walks Plus Hits Per Inning Pitched
1.38
3.96
Earned Run Average
4.63
67
Losses
66
1157.1
Innings pitched
1138.2
.485
Win Percentage
.488
58
Save Opportunities
51
.239
Opponent Batting Average
.252
.316
Opponent's On-base pct.
.329
.375
Opponent's Slugging pct.
.412
.690
Opponent's OPB Pct + SLG Pct
.742
4337
At Bats
4366
173
Doubles
224
9
Triples
16
31
Batters Hit
55
123
Stolen Bases
109
130
Games Played
129
1
Complete Games
1
8
Shutouts
3
41
Wild Pitches
34
537
Runs Batted In
611
5
Balks
6
1157.1
Innings pitched
1138.2
8.8
Strikeouts Per 9 Innings
8.4
39
Caught Stealing
19
130
Games Started
129
0.0
Wins Above Replacement
0.0
1
Is Qualified
1
565
Runs
639
509
Earned Runs
586
1626
Total Bases
1800
Fielding
130
Team Games Played
129
1157
Full Innings
1139
4662
Total Chances
4457
3472
Putouts
3416
1111
Assists
982
79
Errors
59
204
Double Plays
210
0.983
Fielding Percentage
0.987
35.6
Range Factor
34.8
0.0
Zone Rating
0.0
130
Games Played
129
0
Games Started
0
0.0
Defensive Wins Above Replacement
0.0
1
Qualified
1