

Blue Jays vs White Sox Live Score (5 Apr, 2026)
Game Information
Stage
Standard
Season
2026
First Pitch
Sun, Apr 5, 2:10 pm
Venue
Rate Field
Location
Chicago, Illinois
Attendance
22,326
Live Situation
0Balls
3Strikes
0Outs
—Pitcher
—At Bat
Pitch Sequence
1
STRIKE LOOKING
Slider
88 MPH
2
STRIKE SWINGING
Four-seam FB
96 MPH
3
STRIKE SWINGING
Four-seam FB
96 MPH
Injury Report

Team Stats
 TOR
CHW


0
Runs
3
6
Hits
8
0
Errors
0
0
Home Runs
0
3
Walks
4
9
Strikeouts
6
Player Box Score
Toronto Blue Jays
| Player | H-AB | AB | R | H | RBI | HR | BB | K | #P | AVG | OBP | SLG |
|---|---|---|---|---|---|---|---|---|---|---|---|---|
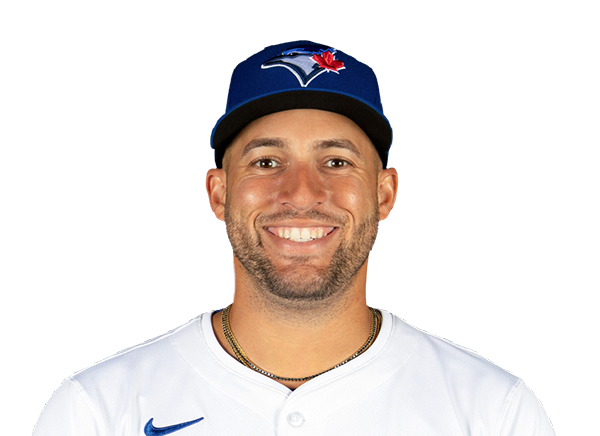 George Springer | 1-4 | 4 | 0 | 1 | 0 | 0 | 0 | 1 | 15 | .158 | .256 | .342 |
 Nathan Lukes | 0-4 | 4 | 0 | 0 | 0 | 0 | 0 | 1 | 16 | .133 | .176 | .133 |
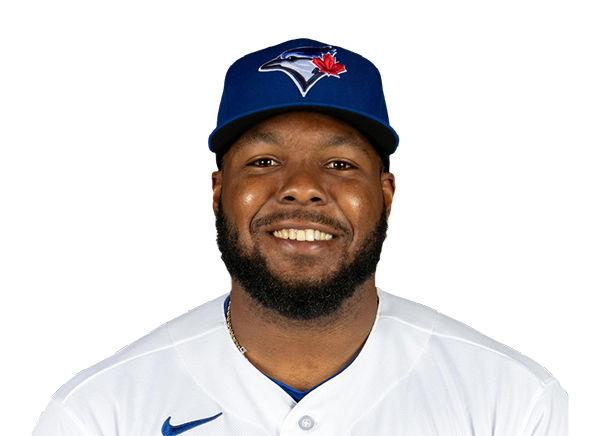 Vladimir Guerrero Jr. | 1-3 | 3 | 0 | 1 | 0 | 0 | 1 | 0 | 17 | .290 | .436 | .387 |
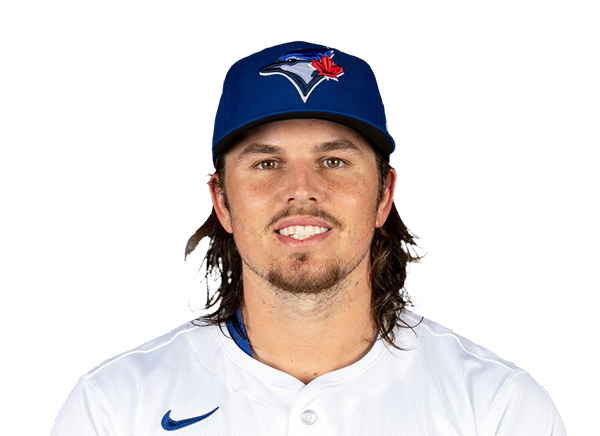 Addison Barger | 0-3 | 3 | 0 | 0 | 0 | 0 | 0 | 0 | 14 | .053 | .174 | .105 |
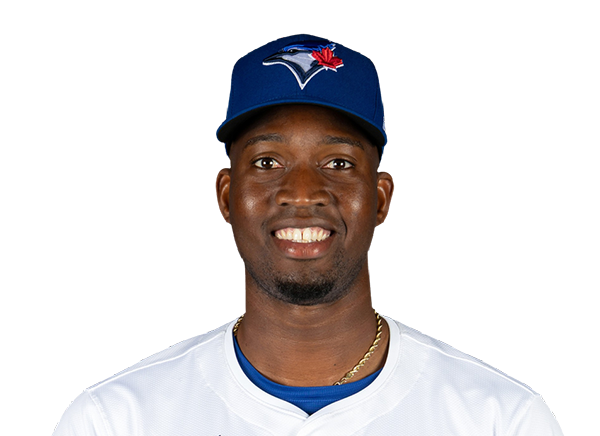 Jesus Sanchez | 0-1 | 1 | 0 | 0 | 0 | 0 | 0 | 0 | 3 | .304 | .407 | .435 |
 Kazuma Okamoto | 0-3 | 3 | 0 | 0 | 0 | 0 | 1 | 2 | 16 | .235 | .333 | .412 |
 Daulton Varsho | 1-4 | 4 | 0 | 1 | 0 | 0 | 0 | 1 | 19 | .172 | .250 | .207 |
 Ernie Clement | 2-4 | 4 | 0 | 2 | 0 | 0 | 0 | 1 | 10 | .297 | .297 | .378 |
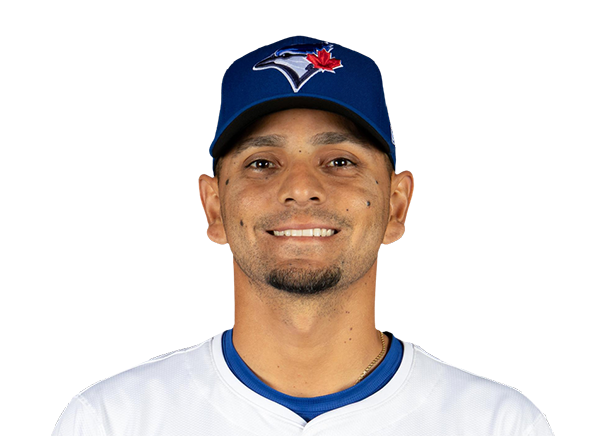 Andres Gimenez | 0-3 | 3 | 0 | 0 | 0 | 0 | 1 | 1 | 13 | .273 | .333 | .515 |
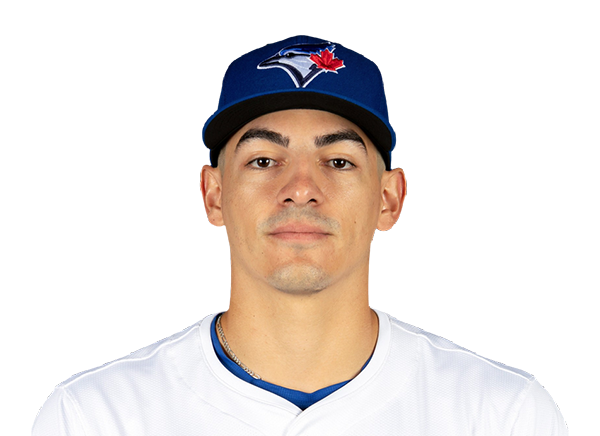 Brandon Valenzuela | 1-3 | 3 | 0 | 1 | 0 | 0 | 0 | 2 | 15 | .333 | .333 | .333 |
Chicago White Sox
| Player | H-AB | AB | R | H | RBI | HR | BB | K | #P | AVG | OBP | SLG |
|---|---|---|---|---|---|---|---|---|---|---|---|---|
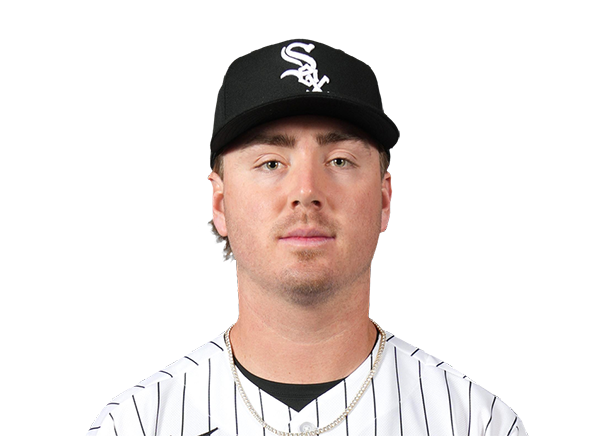 Chase Meidroth | 1-4 | 4 | 1 | 1 | 0 | 0 | 0 | 1 | 18 | .200 | .294 | .367 |
 Austin Hays | 1-4 | 4 | 0 | 1 | 1 | 0 | 0 | 0 | 9 | .194 | .219 | .323 |
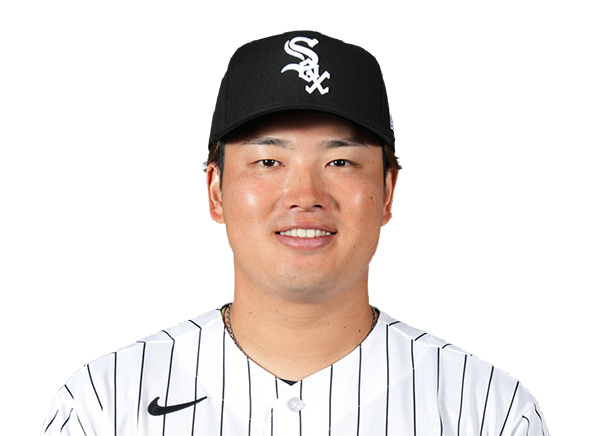 Munetaka Murakami | 0-3 | 3 | 1 | 0 | 0 | 0 | 1 | 1 | 22 | .226 | .342 | .613 |
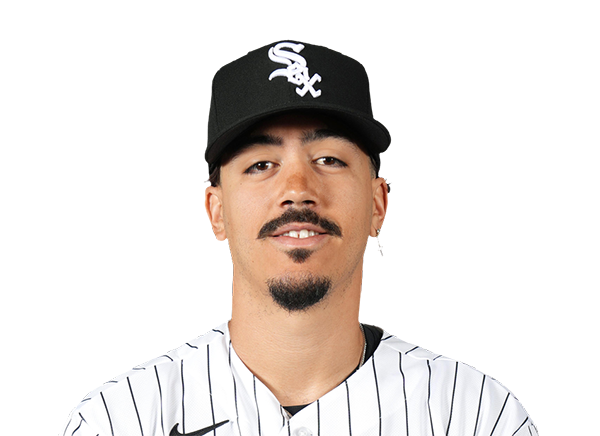 Miguel Vargas | 1-4 | 4 | 0 | 1 | 1 | 0 | 0 | 0 | 12 | .276 | .389 | .552 |
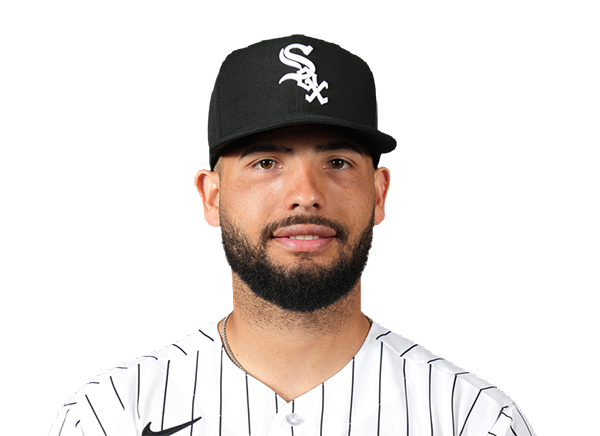 Edgar Quero | 1-2 | 2 | 0 | 1 | 0 | 0 | 2 | 0 | 17 | .211 | .318 | .211 |
 Lenyn Sosa | 1-3 | 3 | 0 | 1 | 1 | 0 | 0 | 0 | 9 | .118 | .118 | .176 |
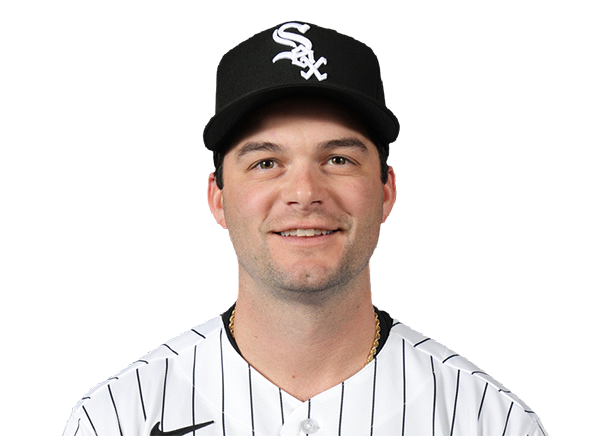 Andrew Benintendi | 0-1 | 1 | 0 | 0 | 0 | 0 | 0 | 0 | 2 | .190 | .227 | .190 |
 Tanner Murray | 0-2 | 2 | 0 | 0 | 0 | 0 | 0 | 0 | 6 | .000 | .000 | .000 |
 Colson Montgomery | 1-2 | 2 | 0 | 1 | 0 | 0 | 0 | 1 | 9 | .226 | .314 | .419 |
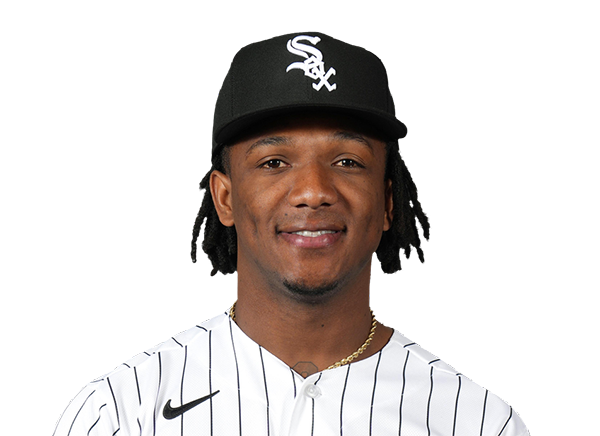 Luisangel Acuna | 2-4 | 4 | 1 | 2 | 0 | 0 | 0 | 0 | 16 | .269 | .321 | .269 |
 Derek Hill | 0-3 | 3 | 0 | 0 | 0 | 0 | 1 | 3 | 22 | .167 | .375 | .167 |
Toronto Blue Jays
| Player | IP | H | R | ER | BB | K | HR | PC-ST | ERA | PC |
|---|---|---|---|---|---|---|---|---|---|---|
 Eric Lauer | 2.0 | 3 | 2 | 2 | 3 | 0 | 0 | 49-26 | 4.91 | 49 |
 Austin Voth | 2.2 | 3 | 1 | 1 | 1 | 1 | 0 | 49-26 | 3.38 | 49 |
 Joe Mantiply | 1.1 | 0 | 0 | 0 | 0 | 3 | 0 | 17-11 | 0.00 | 17 |
 Spencer Miles | 2.0 | 2 | 0 | 0 | 0 | 2 | 0 | 27-18 | 5.79 | 27 |
Chicago White Sox
| Player | IP | H | R | ER | BB | K | HR | PC-ST | ERA | PC |
|---|---|---|---|---|---|---|---|---|---|---|
 Davis Martin | 6.0 | 4 | 0 | 0 | 2 | 6 | 0 | 85-57 | 2.45 | 85 |
 Bryan Hudson | 0.2 | 2 | 0 | 0 | 0 | 1 | 0 | 19-13 | 6.00 | 19 |
 Jordan Leasure | 1.1 | 0 | 0 | 0 | 0 | 1 | 0 | 19-15 | 6.35 | 19 |
 Chris Murphy | 1.0 | 0 | 0 | 0 | 1 | 1 | 0 | 15-9 | 10.13 | 15 |
H2H / Season Series
TOR0–3
CHW
TOR1–0
CHW
TOR4–12
CHW
CHW3–0
TOR
CHW6–3
TOR
CHW5–4
TOR
Last 5 Games
| Date | Opponent | Result |
|---|---|---|
| Aug 22 |  @ NYY | W4–3 |
| Aug 21 | @ NYY | L1–3 |
| Aug 20 |  @ TB | W5–1 |
| Aug 19 | @ TB | L6–7 |
| Aug 18 | @ TB | W10–5 |
| Date | Opponent | Result |
|---|---|---|
| Aug 22 |  vs NYM | L5–10 |
| Aug 21 | vs NYM | W6–4 |
| Aug 20 |  vs ATL | L0–2 |
| Aug 19 |  @ CHC | W3–0 |
| Aug 18 | @ CHC | L3–4 |
Standings
American League
| Team | W | L | PCT | GB | DIFF | STRK |
|---|---|---|---|---|---|---|
| 1Rays | 76 | 53 | .589 | - | +42 | L3 |
| 2White Sox | 67 | 61 | .523 | 8.5 | +47 | W1 |
3 Astros | 65 | 65 | .500 | 11.5 | -43 | L1 |
| 4Yankees | 73 | 56 | .566 | 3 | +95 | L1 |
5 Red Sox | 69 | 59 | .539 | 6.5 | +97 | W1 |
6 Rangers | 64 | 66 | .492 | 12.5 | -48 | L1 |
| 7Blue Jays | 64 | 67 | .489 | 13 | -50 | W1 |
8 Twins | 63 | 66 | .488 | 13 | -45 | L1 |
9 Guardians | 63 | 66 | .488 | 13 | -15 | W2 |
10 Orioles | 63 | 67 | .485 | 13.5 | -33 | W2 |
11 Mariners | 62 | 68 | .477 | 14.5 | -44 | W2 |
12 Tigers | 61 | 68 | .473 | 15 | +77 | L4 |
13 Royals | 57 | 74 | .435 | 20 | -95 | W7 |
14 Angels | 52 | 78 | .400 | 24.5 | -68 | W1 |
15 Athletics | 50 | 80 | .385 | 26.5 | -188 | W1 |
National League
| Team | W | L | PCT | GB | DIFF | STRK |
|---|---|---|---|---|---|---|
1 Brewers | 81 | 49 | .623 | - | +163 | W3 |
2 Dodgers | 79 | 51 | .608 | 2 | +147 | W5 |
| 3Braves | 75 | 55 | .577 | 6 | +108 | L2 |
| 4Cubs | 74 | 56 | .569 | 7 | +98 | L3 |
5 Phillies | 72 | 58 | .554 | 9 | +25 | W8 |
6 Padres | 69 | 60 | .535 | 11.5 | +7 | W1 |
7 Diamondbacks | 68 | 61 | .527 | 12.5 | +13 | W2 |
8 Marlins | 66 | 64 | .508 | 15 | +17 | W2 |
9 Cardinals | 66 | 65 | .504 | 15.5 | 0 | L2 |
10 Pirates | 63 | 68 | .481 | 18.5 | +29 | L2 |
11 Reds | 61 | 68 | .473 | 19.5 | -98 | L2 |
12 Nationals | 61 | 70 | .466 | 20.5 | +14 | L3 |
| 13Mets | 58 | 71 | .450 | 22.5 | -44 | L1 |
14 Giants | 52 | 76 | .406 | 28 | -78 | L2 |
15 Rockies | 50 | 78 | .391 | 30 | -130 | L4 |
TOR
VS
CHW
Pitchers
Eric Lauer
Austin Voth
Joe Mantiply
Spencer Miles
Catchers
Brandon Valenzuela
Infielders
Vladimir Guerrero Jr.
Kazuma Okamoto
Ernie Clement
Andres Gimenez
Outfielders
Nathan Lukes
Addison Barger
Jesus Sanchez
Daulton Varsho
Designated Hitters
George Springer
Pitchers
Davis Martin
Bryan Hudson
Jordan Leasure
Chris Murphy
Catchers
Edgar Quero
Infielders
Chase Meidroth
Munetaka Murakami
Miguel Vargas
Tanner Murray
Colson Montgomery
Outfielders
Austin Hays
Luisangel Acuna
Derek Hill
Designated Hitters
Lenyn Sosa
Andrew Benintendi
Blue Jays
VS
White Sox
Batting
130
Team Games Played
128
4383
At Bats
4306
1072
Hits
1022
491
Runs Batted In
584
123
Home Runs
171
65
Stolen Bases
70
.245
Batting Average
.237
514
Runs
611
204
Doubles
204
8
Triples
12
1661
Total Bases
1763
358
Walks
443
950
Strikeouts
1164
.306
On Base Percentage
.317
.379
Slugging Percentage
.409
.685
OBP Pct + SLG Pct
.727
130
Games Played
128
130
Games Started
128
46
Hit By Pitch
74
0.0
Wins Above Replacement
0.0
0.0
Offensive Wins Above Replacement
0.0
14
Caught Stealing
32
1
Is Qualified
1
511.0
Runs Created
575.1
4.0
Runs Created Per 27 Outs
4.5
.074
Walks Per Plate Appearance
.091
0.38
Walk To Strikeout Ratio
0.38
.134
Isolated Power
.172
.228
Secondary Average
.284
3.80
Pitches Per Plate Appearance
3.86
335
Extra Base Hits
387
4849
Plate Appearances
4879
35.6
At Bats Per Home Run
25.2
20
Sacrifice Hit
25
39
Sacrifice Flies
29
Pitching
130
Team Games Played
128
39
Quality Starts
32
63
Wins
67
67
Losses
61
43
Saves
33
83
Holds
54
1036
Hits
1018
509
Earned runs
516
133
Home Runs
141
474
Walks
459
1127
Strikeouts
1083
8.8
Strikeouts Per 9 Innings
8.5
148.9
Pitches Per Start
150.2
1.30
Walks Plus Hits Per Inning Pitched
1.29
3.96
Earned Run Average
4.06
67
Losses
61
1157.1
Innings pitched
1143.0
.485
Win Percentage
.523
58
Save Opportunities
58
.239
Opponent Batting Average
.238
.316
Opponent's On-base pct.
.320
.375
Opponent's Slugging pct.
.390
.690
Opponent's OPB Pct + SLG Pct
.710
4337
At Bats
4280
173
Doubles
191
9
Triples
19
31
Batters Hit
75
123
Stolen Bases
100
130
Games Played
128
1
Complete Games
0
8
Shutouts
9
41
Wild Pitches
55
537
Runs Batted In
542
5
Balks
8
1157.1
Innings pitched
1143.0
8.8
Strikeouts Per 9 Innings
8.5
39
Caught Stealing
33
130
Games Started
128
0.0
Wins Above Replacement
0.0
1
Is Qualified
1
565
Runs
564
509
Earned Runs
516
1626
Total Bases
1670
Fielding
130
Team Games Played
128
1157
Full Innings
1143
4662
Total Chances
4552
3472
Putouts
3429
1111
Assists
1054
79
Errors
69
204
Double Plays
204
0.983
Fielding Percentage
0.985
35.6
Range Factor
35.3
0.0
Zone Rating
0.0
130
Games Played
128
0
Games Started
0
0.0
Defensive Wins Above Replacement
0.0
1
Qualified
1