

Brewers vs Diamondbacks Live Score (5 Jul, 2026)
Game Information
Stage
Standard
Season
2026
First Pitch
Sun, Jul 5, 4:00 pm
Venue
Chase Field
Location
Phoenix, Arizona
Attendance
24,728
Live Situation
0Balls
2Strikes
0Outs
—Pitcher
—At Bat
Pitch Sequence
1
STRIKE SWINGING
Four-seam FB
99 MPH
2
STRIKE LOOKING
Four-seam FB
99 MPH
3
STRIKE FOUL
Four-seam FB
99 MPH
4
STRIKE FOUL
Four-seam FB
100 MPH
5
BALL IN PLAY
Knuckle Curve
89 MPH
Injury Report


Team Stats
 MIL
ARI


3
Runs
2
7
Hits
7
1
Errors
0
1
Home Runs
0
0
Walks
6
5
Strikeouts
6
Player Box Score
Milwaukee Brewers
| Player | H-AB | AB | R | H | RBI | HR | BB | K | #P | AVG | OBP | SLG |
|---|---|---|---|---|---|---|---|---|---|---|---|---|
 Brice Turang | 1-4 | 4 | 0 | 1 | 0 | 0 | 0 | 0 | 23 | .268 | .363 | .457 |
 Jackson Chourio | 2-4 | 4 | 0 | 2 | 0 | 0 | 0 | 1 | 19 | .297 | .352 | .533 |
 Christian Yelich | 0-3 | 3 | 0 | 0 | 0 | 0 | 0 | 0 | 12 | .243 | .326 | .383 |
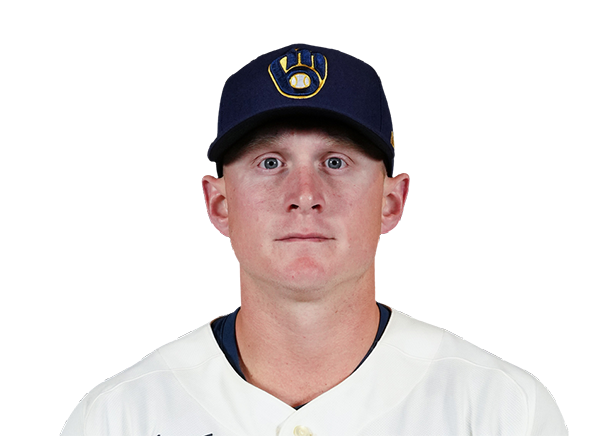 Andrew Vaughn | 1-3 | 3 | 0 | 1 | 0 | 0 | 0 | 1 | 12 | .328 | .417 | .507 |
 Sal Frelick | 0-1 | 1 | 1 | 0 | 0 | 0 | 0 | 0 | 3 | .242 | .312 | .329 |
 Jake Bauers | 1-4 | 4 | 1 | 1 | 2 | 1 | 0 | 0 | 16 | .266 | .363 | .498 |
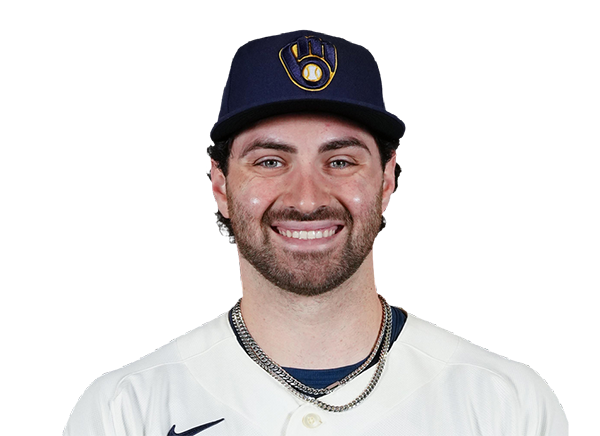 Garrett Mitchell | 0-4 | 4 | 0 | 0 | 0 | 0 | 0 | 3 | 15 | .264 | .358 | .459 |
 Gary Sanchez | 1-3 | 3 | 1 | 1 | 0 | 0 | 0 | 0 | 12 | .218 | .364 | .451 |
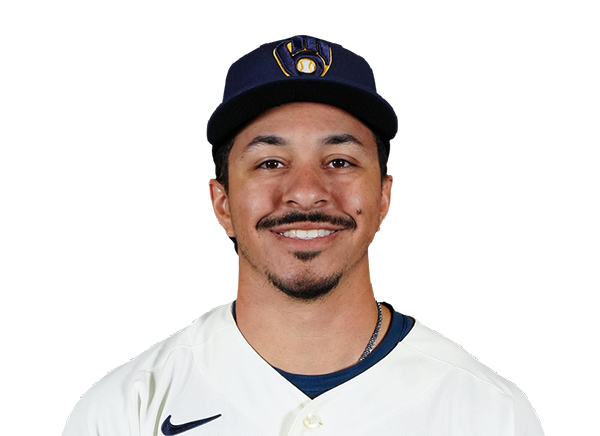 David Hamilton | 0-3 | 3 | 0 | 0 | 0 | 0 | 0 | 0 | 13 | .234 | .313 | .323 |
 Joey Ortiz | 1-3 | 3 | 0 | 1 | 1 | 0 | 0 | 0 | 11 | .210 | .282 | .269 |
Arizona Diamondbacks
| Player | H-AB | AB | R | H | RBI | HR | BB | K | #P | AVG | OBP | SLG |
|---|---|---|---|---|---|---|---|---|---|---|---|---|
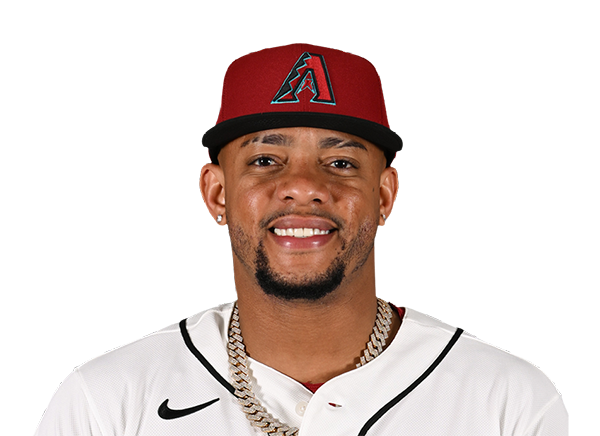 Ketel Marte | 1-4 | 4 | 0 | 1 | 0 | 0 | 1 | 0 | 23 | .267 | .324 | .481 |
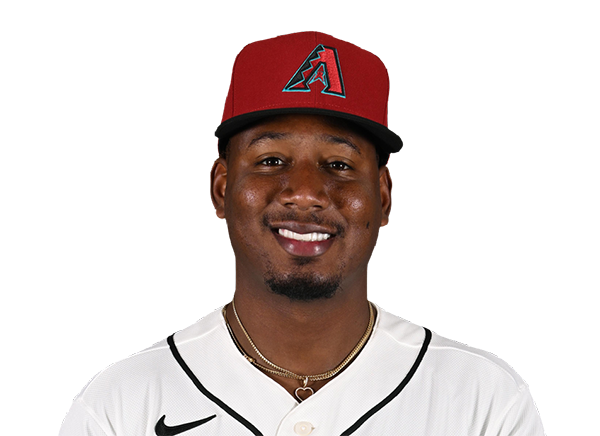 Geraldo Perdomo | 3-5 | 5 | 1 | 3 | 0 | 0 | 0 | 0 | 22 | .243 | .353 | .355 |
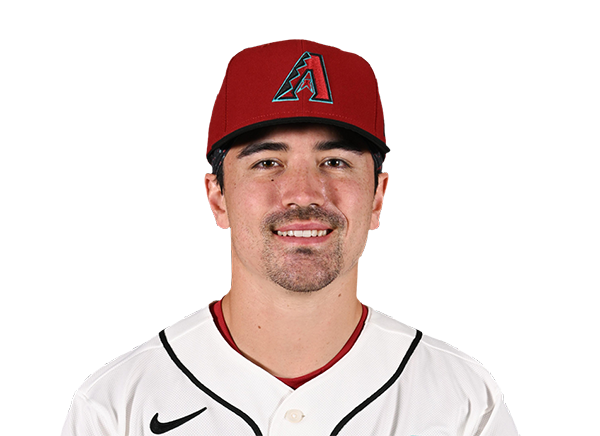 Corbin Carroll | 1-4 | 4 | 0 | 1 | 1 | 0 | 1 | 1 | 24 | .266 | .356 | .506 |
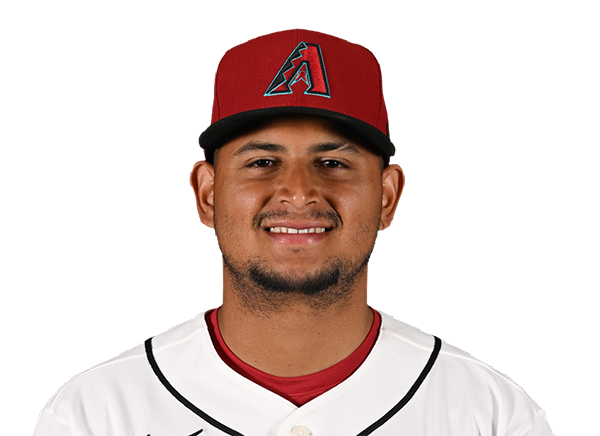 Gabriel Moreno | 0-3 | 3 | 0 | 0 | 1 | 0 | 1 | 1 | 20 | .282 | .369 | .426 |
 Lourdes Gurriel Jr. | 0-2 | 2 | 0 | 0 | 0 | 0 | 1 | 0 | 12 | .216 | .272 | .311 |
 Max Kepler | 0-1 | 1 | 0 | 0 | 0 | 0 | 0 | 1 | 5 | .105 | .105 | .158 |
 Ildemaro Vargas | 0-3 | 3 | 0 | 0 | 0 | 0 | 1 | 0 | 10 | .261 | .305 | .402 |
 Tim Tawa | 0-2 | 2 | 0 | 0 | 0 | 0 | 1 | 0 | 20 | .167 | .273 | .258 |
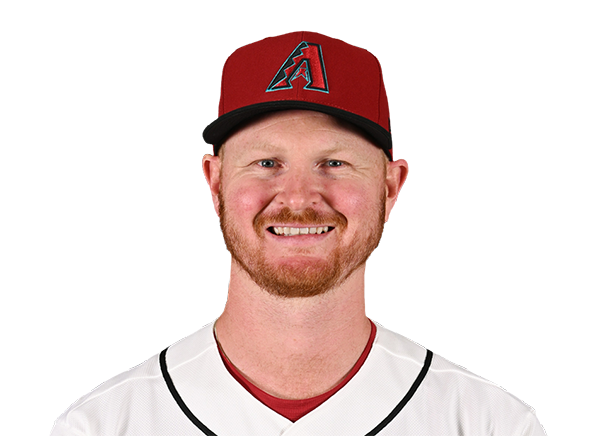 Pavin Smith | 1-4 | 4 | 0 | 1 | 0 | 0 | 0 | 2 | 21 | .157 | .259 | .214 |
 Tommy Troy | 1-4 | 4 | 1 | 1 | 0 | 0 | 0 | 1 | 13 | .220 | .292 | .349 |
Milwaukee Brewers
| Player | IP | H | R | ER | BB | K | HR | PC-ST | ERA | PC |
|---|---|---|---|---|---|---|---|---|---|---|
 Brandon Sproat | 4.0 | 5 | 1 | 1 | 3 | 4 | 0 | 92-55 | 5.13 | 92 |
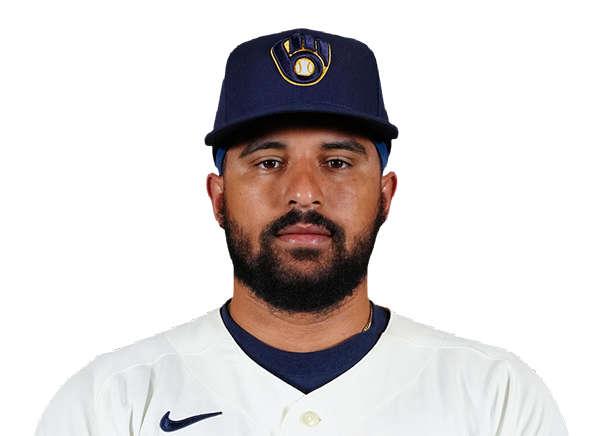 Grant Anderson | 1.2 | 0 | 0 | 0 | 0 | 0 | 0 | 16-9 | 3.20 | 16 |
 Drew Rom | 0.1 | 0 | 0 | 0 | 0 | 1 | 0 | 7-5 | 3.18 | 7 |
 Aaron Ashby | 0.1 | 2 | 1 | 1 | 1 | 0 | 0 | 16-8 | 3.25 | 16 |
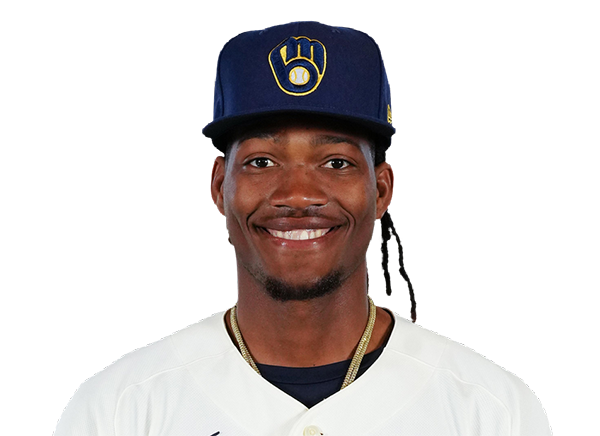 Abner Uribe | 1.2 | 0 | 0 | 0 | 1 | 1 | 0 | 23-13 | 2.78 | 23 |
 Trevor Megill | 1.0 | 0 | 0 | 0 | 1 | 0 | 0 | 16-11 | 3.09 | 16 |
Arizona Diamondbacks
| Player | IP | H | R | ER | BB | K | HR | PC-ST | ERA | PC |
|---|---|---|---|---|---|---|---|---|---|---|
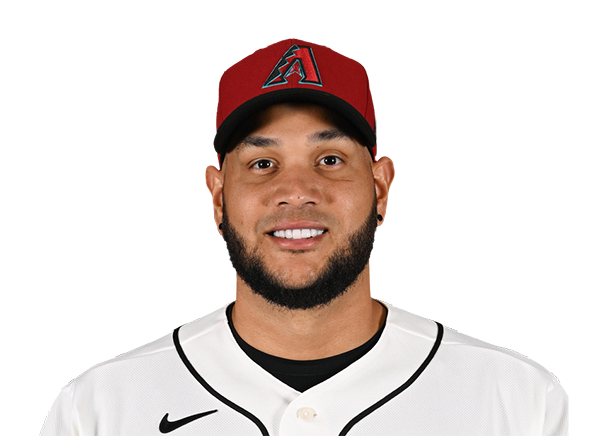 Eduardo Rodriguez | 6.0 | 5 | 2 | 2 | 0 | 3 | 1 | 102-59 | 2.25 | 102 |
 Kevin Ginkel | 1.0 | 2 | 1 | 1 | 0 | 1 | 0 | 12-9 | 3.15 | 12 |
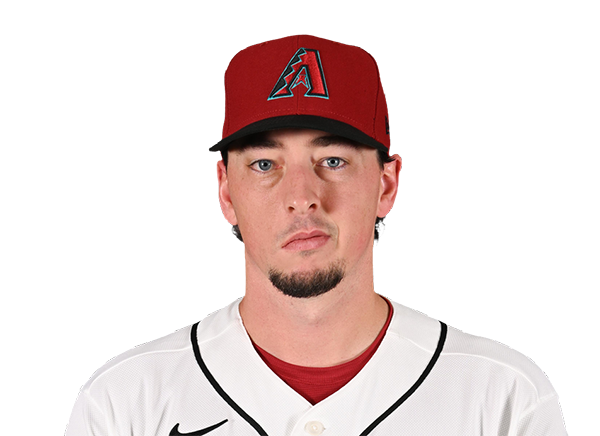 Taylor Clarke | 1.0 | 0 | 0 | 0 | 0 | 0 | 0 | 11-6 | 2.06 | 11 |
 Drey Jameson | 1.0 | 0 | 0 | 0 | 0 | 1 | 0 | 11-8 | 4.38 | 11 |
H2H / Season Series
ARI2–3
MIL
ARI4–3
MIL
ARI4–7
MIL
MIL13–1
ARI
MIL2–6
ARI
MIL13–2
ARI
ARI8–7
MIL
MIL6–2
ARI
Last 5 Games
| Date | Opponent | Result |
|---|---|---|
| Aug 22 |  vs ATL | W4–1 |
| Aug 21 | vs ATL | W2–1 |
| Aug 20 |  vs SEA | W7–4 |
| Aug 19 | vs SEA | L5–7 |
| Aug 18 | vs SEA | W22–0 |
| Date | Opponent | Result |
|---|---|---|
| Aug 22 |  vs CIN | L5–11 |
| Aug 21 | vs CIN | W9–0 |
| Aug 19 |  @ BOS | W7–6 |
| Aug 18 | @ BOS | L4–9 |
| Aug 17 | @ BOS | L1–11 |
Standings
American League
| Team | W | L | PCT | GB | DIFF | STRK |
|---|---|---|---|---|---|---|
1 Rays | 76 | 53 | .589 | - | +42 | L3 |
2 White Sox | 67 | 62 | .519 | 9 | +42 | L1 |
3 Astros | 65 | 65 | .500 | 11.5 | -43 | L1 |
4 Yankees | 73 | 56 | .566 | 3 | +95 | L1 |
| 5Red Sox | 70 | 59 | .543 | 6 | +98 | W2 |
6 Rangers | 64 | 66 | .492 | 12.5 | -48 | L1 |
7 Guardians | 64 | 66 | .492 | 12.5 | -14 | W3 |
8 Blue Jays | 64 | 67 | .489 | 13 | -50 | W1 |
9 Twins | 63 | 67 | .485 | 13.5 | -47 | L2 |
10 Orioles | 63 | 67 | .485 | 13.5 | -33 | W2 |
| 11Mariners | 62 | 68 | .477 | 14.5 | -44 | W2 |
12 Tigers | 61 | 68 | .473 | 15 | +77 | L4 |
13 Royals | 57 | 74 | .435 | 20 | -95 | W7 |
14 Angels | 52 | 78 | .400 | 24.5 | -68 | W1 |
15 Athletics | 50 | 80 | .385 | 26.5 | -188 | W1 |
National League
| Team | W | L | PCT | GB | DIFF | STRK |
|---|---|---|---|---|---|---|
| 1Brewers | 81 | 49 | .623 | - | +163 | W3 |
2 Dodgers | 79 | 51 | .608 | 2 | +147 | W5 |
| 3Braves | 75 | 55 | .577 | 6 | +108 | L2 |
4 Cubs | 74 | 56 | .569 | 7 | +98 | L3 |
5 Phillies | 72 | 58 | .554 | 9 | +25 | W8 |
6 Padres | 70 | 60 | .538 | 11 | +9 | W2 |
| 7Diamondbacks | 68 | 62 | .523 | 13 | +7 | L1 |
8 Marlins | 66 | 64 | .508 | 15 | +17 | W2 |
9 Cardinals | 66 | 65 | .504 | 15.5 | 0 | L2 |
10 Pirates | 63 | 68 | .481 | 18.5 | +29 | L2 |
| 11Reds | 62 | 68 | .477 | 19 | -92 | W1 |
12 Nationals | 61 | 70 | .466 | 20.5 | +14 | L3 |
13 Mets | 59 | 71 | .454 | 22 | -39 | W1 |
14 Giants | 52 | 77 | .403 | 28.5 | -79 | L3 |
15 Rockies | 50 | 79 | .388 | 30.5 | -131 | L5 |
MIL
VS
ARI
Pitchers
Brandon Sproat
Grant Anderson
Drew Rom
Aaron Ashby
Abner Uribe
Trevor Megill
Catchers
Gary Sanchez
Infielders
Brice Turang
Andrew Vaughn
Jake Bauers
David Hamilton
Joey Ortiz
Outfielders
Jackson Chourio
Sal Frelick
Garrett Mitchell
Designated Hitters
Christian Yelich
Pitchers
Eduardo Rodriguez
Kevin Ginkel
Taylor Clarke
Drey Jameson
Catchers
Gabriel Moreno
Infielders
Geraldo Perdomo
Ildemaro Vargas
Tim Tawa
Pavin Smith
Outfielders
Corbin Carroll
Lourdes Gurriel Jr.
Max Kepler
Tommy Troy
Designated Hitters
Ketel Marte
Brewers
VS
Diamondbacks
Batting
129
Team Games Played
129
4361
At Bats
4332
1104
Hits
1059
605
Runs Batted In
560
119
Home Runs
127
129
Stolen Bases
89
.253
Batting Average
.244
644
Runs
588
226
Doubles
224
20
Triples
33
1727
Total Bases
1730
537
Walks
436
1084
Strikeouts
940
.337
On Base Percentage
.318
.396
Slugging Percentage
.399
.733
OBP Pct + SLG Pct
.717
129
Games Played
129
129
Games Started
129
32
Hit By Pitch
47
0.0
Wins Above Replacement
0.0
0.0
Offensive Wins Above Replacement
0.0
41
Caught Stealing
20
1
Is Qualified
1
608.3
Runs Created
567.7
4.8
Runs Created Per 27 Outs
4.4
.107
Walks Per Plate Appearance
.089
0.50
Walk To Strikeout Ratio
0.46
.143
Isolated Power
.155
.286
Secondary Average
.271
4.00
Pitches Per Plate Appearance
3.94
365
Extra Base Hits
384
5000
Plate Appearances
4889
36.6
At Bats Per Home Run
34.1
29
Sacrifice Hit
32
34
Sacrifice Flies
40
Pitching
129
Team Games Played
129
45
Quality Starts
47
80
Wins
68
49
Losses
61
42
Saves
31
66
Holds
71
933
Hits
1095
441
Earned runs
527
129
Home Runs
149
408
Walks
376
1253
Strikeouts
873
9.8
Strikeouts Per 9 Innings
6.9
145.2
Pitches Per Start
140.6
1.16
Walks Plus Hits Per Inning Pitched
1.28
3.44
Earned Run Average
4.14
49
Losses
61
1153.1
Innings pitched
1145.0
.620
Win Percentage
.527
60
Save Opportunities
46
.219
Opponent Batting Average
.251
.294
Opponent's On-base pct.
.315
.357
Opponent's Slugging pct.
.415
.651
Opponent's OPB Pct + SLG Pct
.731
4257
At Bats
4358
172
Doubles
217
13
Triples
25
52
Batters Hit
49
55
Stolen Bases
76
129
Games Played
129
1
Complete Games
1
9
Shutouts
8
44
Wild Pitches
26
465
Runs Batted In
560
6
Balks
5
1153.1
Innings pitched
1145.0
9.8
Strikeouts Per 9 Innings
6.9
29
Caught Stealing
17
129
Games Started
129
0.0
Wins Above Replacement
0.0
1
Is Qualified
1
484
Runs
575
441
Earned Runs
527
1518
Total Bases
1809
Fielding
129
Team Games Played
129
1153
Full Innings
1145
4522
Total Chances
4608
3460
Putouts
3435
1005
Assists
1125
57
Errors
48
226
Double Plays
224
0.987
Fielding Percentage
0.990
34.8
Range Factor
35.8
0.0
Zone Rating
0.0
129
Games Played
129
0
Games Started
0
0.0
Defensive Wins Above Replacement
0.0
1
Qualified
1