

Cardinals vs Blue Jays Live Score (31 Jul, 2026)
Game Information
Stage
Standard
Season
2026
First Pitch
Fri, Jul 31, 7:07 pm
Venue
Rogers Centre
Location
Toronto, Ontario
Attendance
41,506
Live Situation
0Balls
0Strikes
0Outs
—Pitcher
—At Bat
Pitch Sequence
1
BALL IN PLAY
Four-seam FB
98 MPH
Injury Report





Team Stats
 STL
TOR


1
Runs
3
5
Hits
9
0
Errors
0
0
Home Runs
0
3
Walks
4
11
Strikeouts
4
Player Box Score
St. Louis Cardinals
| Player | H-AB | AB | R | H | RBI | HR | BB | K | #P | AVG | OBP | SLG |
|---|---|---|---|---|---|---|---|---|---|---|---|---|
 JJ Wetherholt | 0-3 | 3 | 0 | 0 | 0 | 0 | 1 | 1 | 18 | .251 | .348 | .393 |
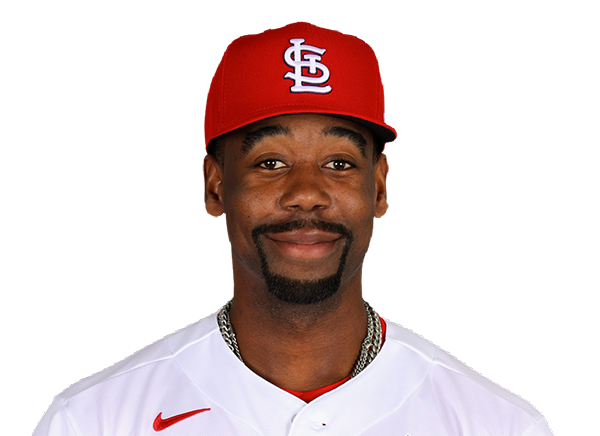 Jordan Walker | 1-4 | 4 | 0 | 1 | 1 | 0 | 0 | 2 | 14 | .281 | .341 | .494 |
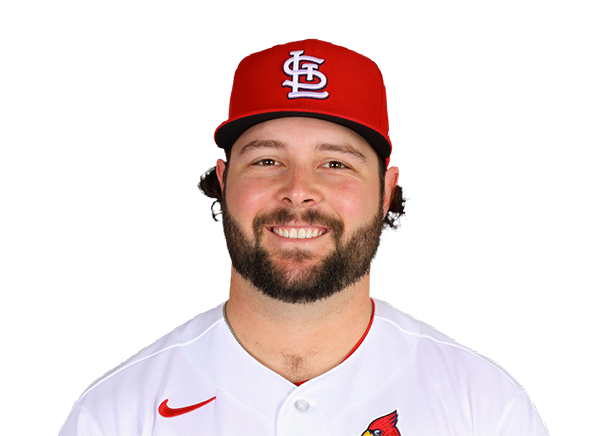 Alec Burleson | 1-3 | 3 | 0 | 1 | 0 | 0 | 1 | 2 | 14 | .282 | .344 | .459 |
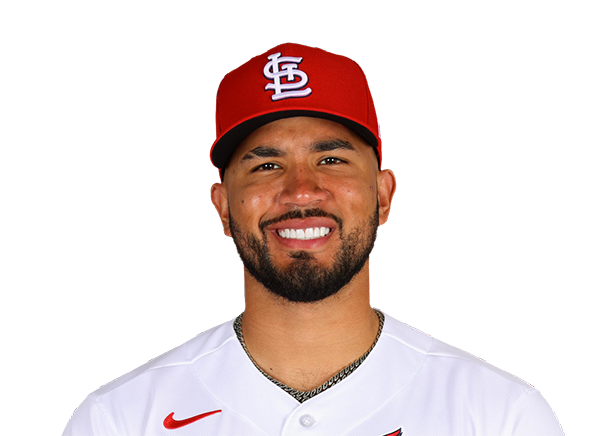 Ivan Herrera | 0-4 | 4 | 0 | 0 | 0 | 0 | 0 | 1 | 18 | .244 | .361 | .379 |
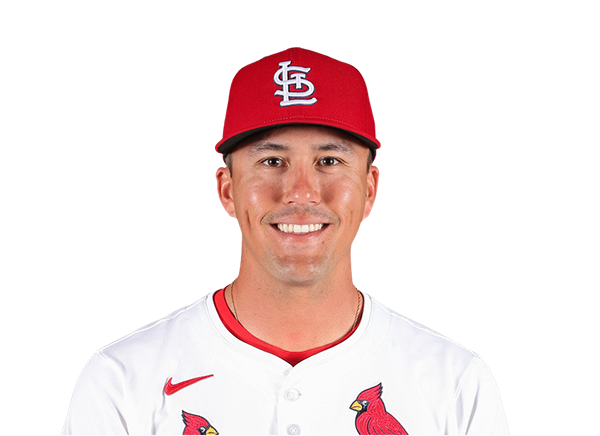 Lars Nootbaar | 0-4 | 4 | 0 | 0 | 0 | 0 | 0 | 1 | 14 | .235 | .339 | .356 |
 Masyn Winn | 1-3 | 3 | 0 | 1 | 0 | 0 | 1 | 1 | 14 | .243 | .319 | .322 |
 Nathan Church | 2-4 | 4 | 1 | 2 | 0 | 0 | 0 | 1 | 22 | .226 | .269 | .354 |
 Jose Fermin | 0-4 | 4 | 0 | 0 | 0 | 0 | 0 | 0 | 14 | .241 | .306 | .364 |
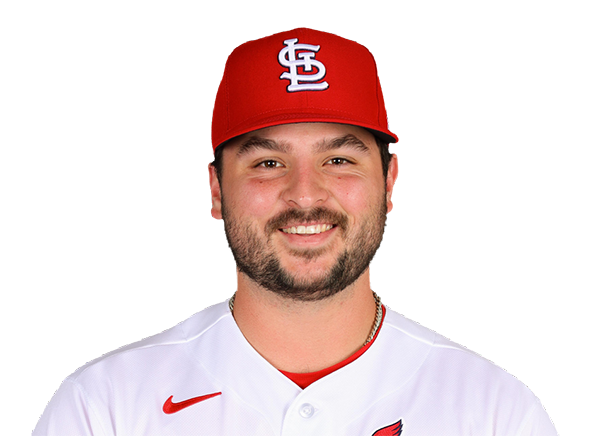 Jimmy Crooks | 0-3 | 3 | 0 | 0 | 0 | 0 | 0 | 2 | 10 | .165 | .253 | .306 |
Toronto Blue Jays
| Player | H-AB | AB | R | H | RBI | HR | BB | K | #P | AVG | OBP | SLG |
|---|---|---|---|---|---|---|---|---|---|---|---|---|
 Nathan Lukes | 0-2 | 2 | 0 | 0 | 0 | 0 | 1 | 0 | 13 | .279 | .338 | .388 |
 Myles Straw | 0-0 | 0 | 0 | 0 | 0 | 0 | 0 | 0 | 1 | .218 | .277 | .312 |
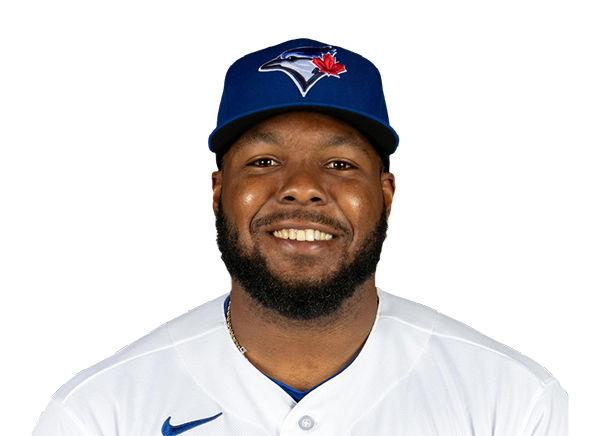 Vladimir Guerrero Jr. | 1-4 | 4 | 1 | 1 | 0 | 0 | 0 | 0 | 16 | .265 | .344 | .358 |
 Kazuma Okamoto | 1-4 | 4 | 0 | 1 | 1 | 0 | 0 | 1 | 21 | .231 | .307 | .454 |
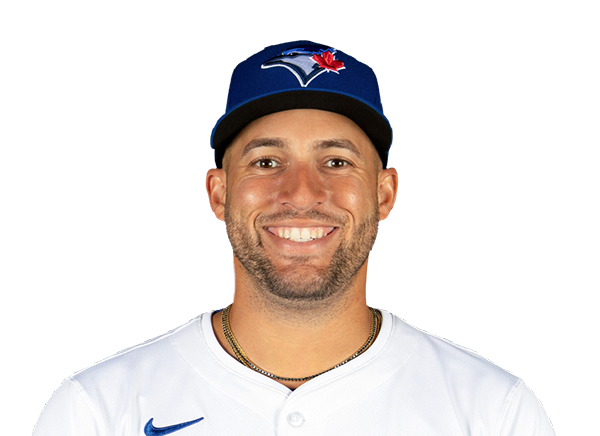 George Springer | 1-3 | 3 | 1 | 1 | 0 | 0 | 1 | 0 | 19 | .235 | .319 | .402 |
 Daulton Varsho | 0-3 | 3 | 1 | 0 | 0 | 0 | 1 | 1 | 18 | .245 | .307 | .379 |
 Ernie Clement | 0-3 | 3 | 0 | 0 | 0 | 0 | 1 | 1 | 15 | .292 | .318 | .420 |
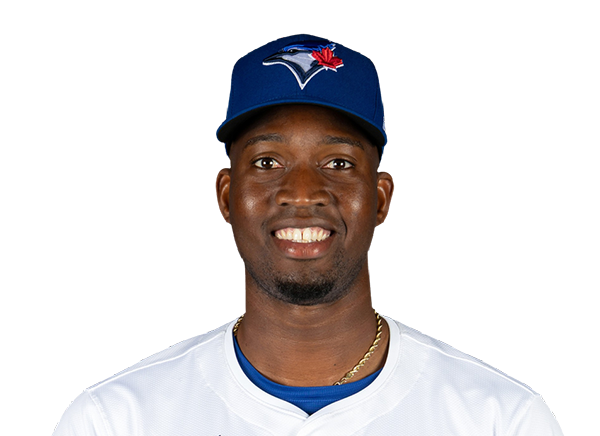 Jesus Sanchez | 0-2 | 2 | 0 | 0 | 0 | 0 | 0 | 0 | 5 | .272 | .314 | .433 |
 Davis Schneider | 0-1 | 1 | 0 | 0 | 0 | 0 | 0 | 1 | 6 | .148 | .279 | .287 |
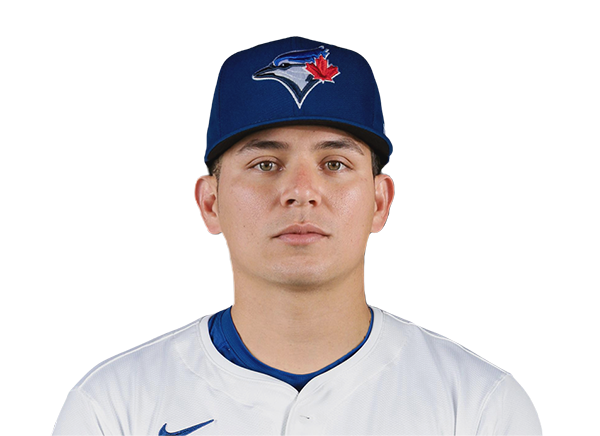 Luis Urias | 1-1 | 1 | 0 | 1 | 2 | 0 | 0 | 0 | 2 | .233 | .313 | .465 |
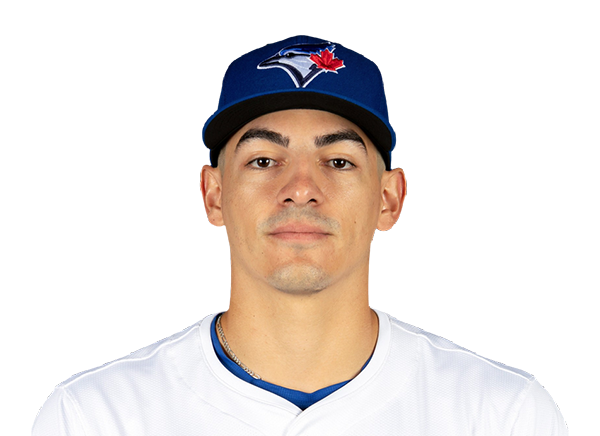 Brandon Valenzuela | 3-4 | 4 | 0 | 3 | 0 | 0 | 0 | 0 | 13 | .239 | .316 | .402 |
 Andres Gimenez | 2-3 | 3 | 0 | 2 | 0 | 0 | 0 | 0 | 15 | .232 | .274 | .353 |
St. Louis Cardinals
| Player | IP | H | R | ER | BB | K | HR | PC-ST | ERA | PC |
|---|---|---|---|---|---|---|---|---|---|---|
 Kyle Leahy | 6.0 | 6 | 1 | 1 | 1 | 3 | 0 | 98-61 | 3.44 | 98 |
 Justin Bruihl | 0.1 | 2 | 0 | 0 | 0 | 1 | 0 | 16-10 | 3.59 | 16 |
 Peter Strzelecki | 1.0 | 0 | 2 | 2 | 2 | 0 | 0 | 17-6 | 9.00 | 17 |
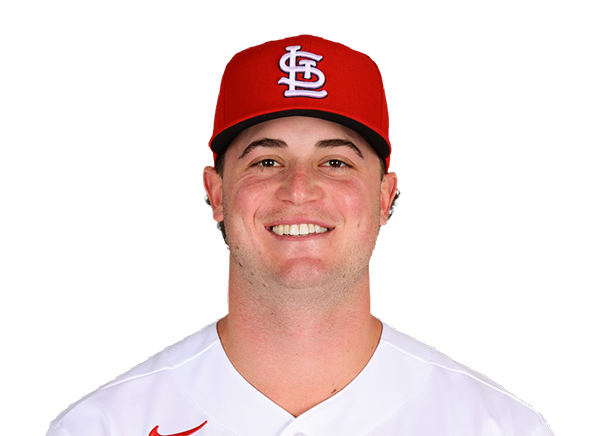 Gordon Graceffo | 0.2 | 1 | 0 | 0 | 1 | 0 | 0 | 13-9 | 3.15 | 13 |
Toronto Blue Jays
| Player | IP | H | R | ER | BB | K | HR | PC-ST | ERA | PC |
|---|---|---|---|---|---|---|---|---|---|---|
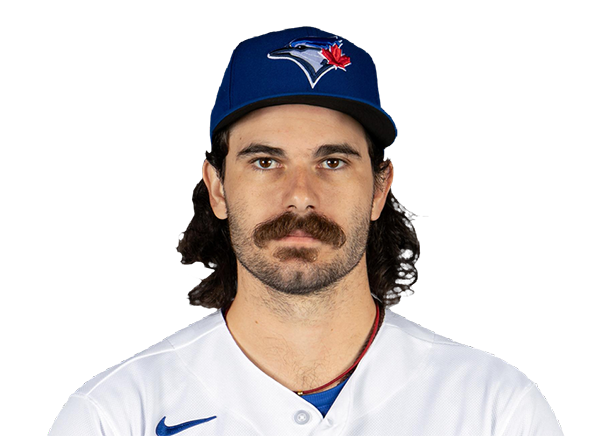 Dylan Cease | 6.0 | 3 | 1 | 1 | 3 | 7 | 0 | 96-57 | 2.41 | 96 |
 Spencer Miles | 1.0 | 1 | 0 | 0 | 0 | 2 | 0 | 16-12 | 3.21 | 16 |
 Jeff Hoffman | 1.0 | 0 | 0 | 0 | 0 | 2 | 0 | 11-9 | 4.02 | 11 |
 Louis Varland | 1.0 | 1 | 0 | 0 | 0 | 0 | 0 | 15-11 | 0.96 | 15 |
H2H / Season Series
TOR1–5
STL
TOR5–1
STL
TOR3–1
STL
Last 5 Games
| Date | Opponent | Result |
|---|---|---|
| Aug 22 |  @ PHI | L3–12 |
| Aug 21 | @ PHI | L6–7 |
| Aug 20 |  @ CIN | W10–9 |
| Aug 19 | @ CIN | L4–5 |
| Aug 18 | @ CIN | W3–0 |
| Date | Opponent | Result |
|---|---|---|
| Aug 22 |  @ NYY | W4–3 |
| Aug 21 | @ NYY | L1–3 |
| Aug 20 |  @ TB | W5–1 |
| Aug 19 | @ TB | L6–7 |
| Aug 18 | @ TB | W10–5 |
Standings
American League
| Team | W | L | PCT | GB | DIFF | STRK |
|---|---|---|---|---|---|---|
| 1Rays | 76 | 53 | .589 | - | +42 | L3 |
2 White Sox | 67 | 62 | .519 | 9 | +42 | L1 |
3 Astros | 65 | 65 | .500 | 11.5 | -43 | L1 |
| 4Yankees | 73 | 56 | .566 | 3 | +95 | L1 |
5 Red Sox | 70 | 59 | .543 | 6 | +98 | W2 |
6 Rangers | 64 | 66 | .492 | 12.5 | -48 | L1 |
| 7Blue Jays | 64 | 67 | .489 | 13 | -50 | W1 |
8 Twins | 63 | 66 | .488 | 13 | -45 | L1 |
9 Guardians | 63 | 66 | .488 | 13 | -15 | W2 |
10 Orioles | 63 | 67 | .485 | 13.5 | -33 | W2 |
11 Mariners | 62 | 68 | .477 | 14.5 | -44 | W2 |
12 Tigers | 61 | 68 | .473 | 15 | +77 | L4 |
13 Royals | 57 | 74 | .435 | 20 | -95 | W7 |
14 Angels | 52 | 78 | .400 | 24.5 | -68 | W1 |
15 Athletics | 50 | 80 | .385 | 26.5 | -188 | W1 |
National League
| Team | W | L | PCT | GB | DIFF | STRK |
|---|---|---|---|---|---|---|
1 Brewers | 81 | 49 | .623 | - | +163 | W3 |
2 Dodgers | 79 | 51 | .608 | 2 | +147 | W5 |
3 Braves | 75 | 55 | .577 | 6 | +108 | L2 |
4 Cubs | 74 | 56 | .569 | 7 | +98 | L3 |
| 5Phillies | 72 | 58 | .554 | 9 | +25 | W8 |
6 Padres | 69 | 60 | .535 | 11.5 | +7 | W1 |
7 Diamondbacks | 68 | 61 | .527 | 12.5 | +13 | W2 |
8 Marlins | 66 | 64 | .508 | 15 | +17 | W2 |
| 9Cardinals | 66 | 65 | .504 | 15.5 | 0 | L2 |
10 Pirates | 63 | 68 | .481 | 18.5 | +29 | L2 |
| 11Reds | 61 | 68 | .473 | 19.5 | -98 | L2 |
12 Nationals | 61 | 70 | .466 | 20.5 | +14 | L3 |
13 Mets | 59 | 71 | .454 | 22 | -39 | W1 |
14 Giants | 52 | 77 | .403 | 28.5 | -79 | L3 |
15 Rockies | 50 | 78 | .391 | 30 | -130 | L4 |
STL
VS
TOR
Pitchers
Kyle Leahy
Justin Bruihl
Peter Strzelecki
Gordon Graceffo
Catchers
Jimmy Crooks
Infielders
JJ Wetherholt
Alec Burleson
Masyn Winn
Jose Fermin
Outfielders
Jordan Walker
Lars Nootbaar
Nathan Church
Designated Hitters
Ivan Herrera
Pitchers
Dylan Cease
Spencer Miles
Jeff Hoffman
Louis Varland
Catchers
Brandon Valenzuela
Infielders
Vladimir Guerrero Jr.
Kazuma Okamoto
Luis Urias
Andres Gimenez
Outfielders
Nathan Lukes
Myles Straw
Daulton Varsho
Ernie Clement
Jesus Sanchez
Davis Schneider
Designated Hitters
George Springer
Cardinals
VS
Blue Jays
Batting
130
Team Games Played
130
4364
At Bats
4383
1052
Hits
1072
563
Runs Batted In
491
135
Home Runs
123
80
Stolen Bases
65
.241
Batting Average
.245
578
Runs
514
186
Doubles
204
13
Triples
8
1669
Total Bases
1661
426
Walks
358
1012
Strikeouts
950
.318
On Base Percentage
.306
.382
Slugging Percentage
.379
.700
OBP Pct + SLG Pct
.685
130
Games Played
130
130
Games Started
130
83
Hit By Pitch
46
0.0
Wins Above Replacement
0.0
0.0
Offensive Wins Above Replacement
0.0
22
Caught Stealing
14
1
Is Qualified
1
541.6
Runs Created
511.0
4.2
Runs Created Per 27 Outs
4.0
.086
Walks Per Plate Appearance
.074
0.42
Walk To Strikeout Ratio
0.38
.141
Isolated Power
.134
.252
Secondary Average
.228
3.86
Pitches Per Plate Appearance
3.80
334
Extra Base Hits
335
4936
Plate Appearances
4849
32.3
At Bats Per Home Run
35.6
19
Sacrifice Hit
20
42
Sacrifice Flies
39
Pitching
130
Team Games Played
130
47
Quality Starts
39
66
Wins
63
64
Losses
67
38
Saves
43
84
Holds
83
1100
Hits
1036
523
Earned runs
509
126
Home Runs
133
442
Walks
474
1006
Strikeouts
1127
7.8
Strikeouts Per 9 Innings
8.8
148.8
Pitches Per Start
148.9
1.33
Walks Plus Hits Per Inning Pitched
1.30
4.06
Earned Run Average
3.96
64
Losses
67
1159.1
Innings pitched
1157.1
.508
Win Percentage
.485
62
Save Opportunities
58
.251
Opponent Batting Average
.239
.325
Opponent's On-base pct.
.316
.392
Opponent's Slugging pct.
.375
.717
Opponent's OPB Pct + SLG Pct
.690
4389
At Bats
4337
222
Doubles
173
11
Triples
9
58
Batters Hit
31
89
Stolen Bases
123
130
Games Played
130
1
Complete Games
1
9
Shutouts
8
52
Wild Pitches
41
541
Runs Batted In
537
3
Balks
5
1159.1
Innings pitched
1157.1
7.8
Strikeouts Per 9 Innings
8.8
21
Caught Stealing
39
130
Games Started
130
0.0
Wins Above Replacement
0.0
1
Is Qualified
1
569
Runs
565
523
Earned Runs
509
1722
Total Bases
1626
Fielding
130
Team Games Played
130
1159
Full Innings
1157
4752
Total Chances
4662
3478
Putouts
3472
1219
Assists
1111
55
Errors
79
186
Double Plays
204
0.988
Fielding Percentage
0.983
36.5
Range Factor
35.6
0.0
Zone Rating
0.0
130
Games Played
130
0
Games Started
0
0.0
Defensive Wins Above Replacement
0.0
1
Qualified
1