

Cardinals vs Yankees Live Score (5 Aug, 2026)
Game Information
Stage
Standard
Season
2026
First Pitch
Wed, Aug 5, 7:05 pm
Venue
Yankee Stadium
Location
Bronx, New York
Attendance
37,425
Live Situation
3Balls
3Strikes
0Outs
—Pitcher
—At Bat
Pitch Sequence
1
STRIKE LOOKING
Sinker
97 MPH
2
BALL
Sinker
96 MPH
3
BALL
Sinker
96 MPH
4
BALL
Sinker
97 MPH
5
STRIKE LOOKING
Sinker
96 MPH
6
STRIKE FOUL
Sinker
97 MPH
7
STRIKE LOOKING
Sinker
97 MPH
Injury Report




Team Stats
 STL
NYY


3
Runs
1
9
Hits
4
2
Errors
0
0
Home Runs
0
3
Walks
8
8
Strikeouts
10
Player Box Score
St. Louis Cardinals
| Player | H-AB | AB | R | H | RBI | HR | BB | K | #P | AVG | OBP | SLG |
|---|---|---|---|---|---|---|---|---|---|---|---|---|
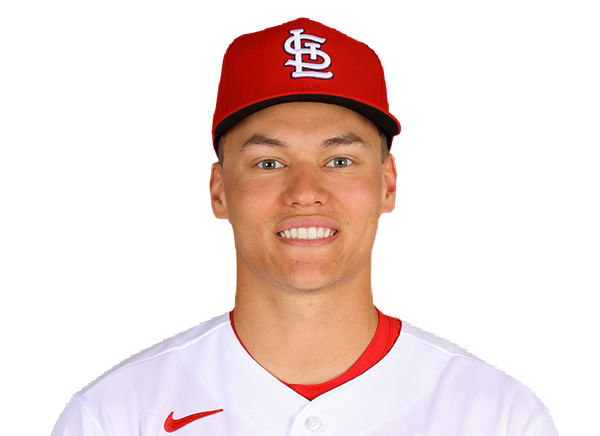 JJ Wetherholt | 1-3 | 3 | 1 | 1 | 2 | 0 | 2 | 0 | 25 | .248 | .351 | .388 |
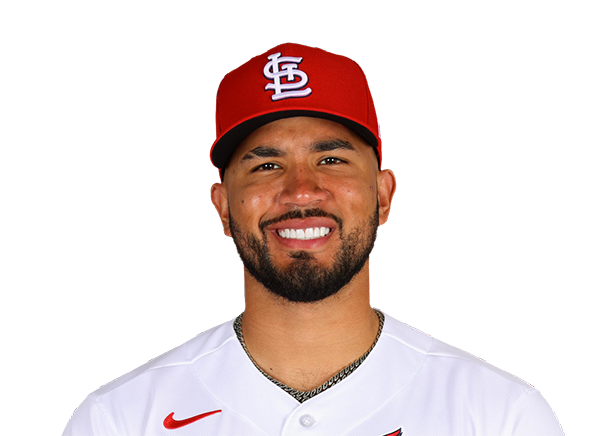 Ivan Herrera | 1-5 | 5 | 0 | 1 | 1 | 0 | 0 | 2 | 24 | .239 | .355 | .373 |
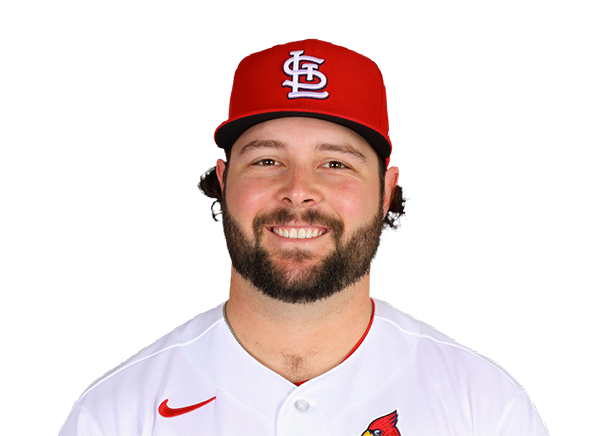 Alec Burleson | 1-4 | 4 | 0 | 1 | 0 | 0 | 0 | 1 | 11 | .287 | .351 | .480 |
 Jose Fermin | 0-4 | 4 | 0 | 0 | 0 | 0 | 0 | 0 | 17 | .237 | .297 | .355 |
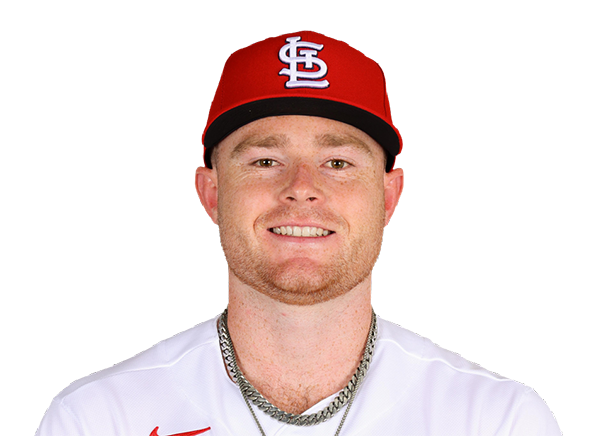 Nathan Church | 2-4 | 4 | 0 | 2 | 0 | 0 | 0 | 0 | 18 | .236 | .283 | .366 |
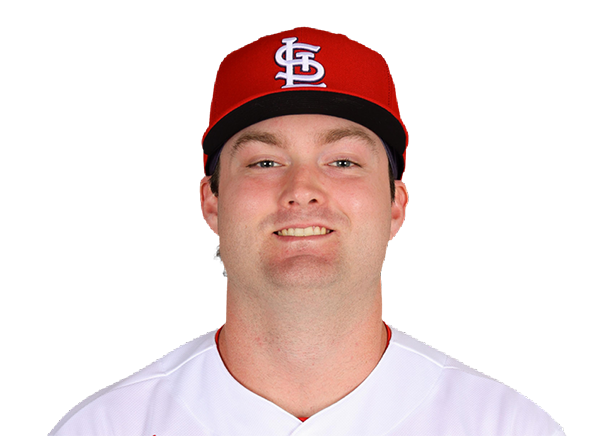 Blaze Jordan | 2-4 | 4 | 0 | 2 | 0 | 0 | 0 | 1 | 19 | .252 | .271 | .370 |
 Bryan Torres | 0-3 | 3 | 1 | 0 | 0 | 0 | 1 | 2 | 17 | .232 | .291 | .411 |
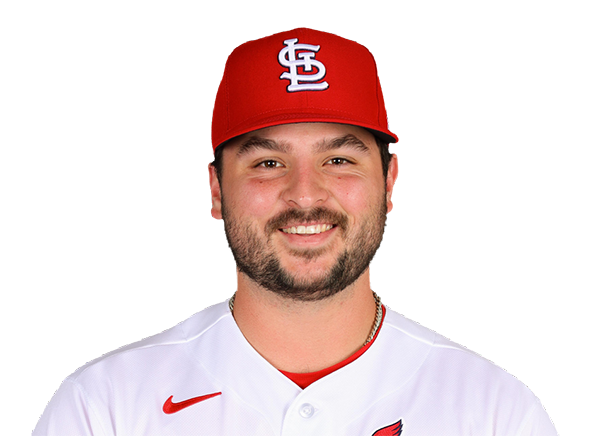 Jimmy Crooks | 2-4 | 4 | 1 | 2 | 0 | 0 | 0 | 1 | 10 | .188 | .264 | .354 |
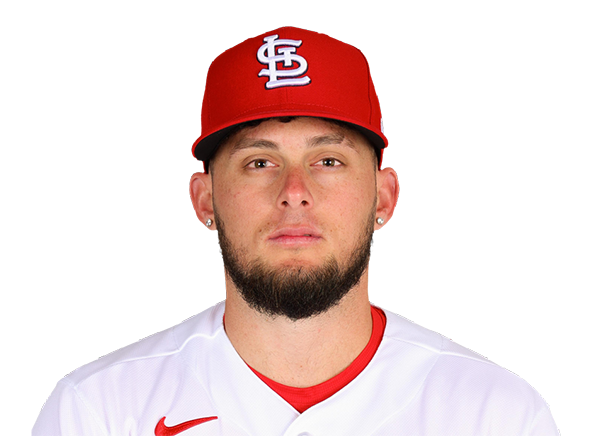 Cesar Prieto | 0-3 | 3 | 0 | 0 | 0 | 0 | 0 | 1 | 15 | .000 | .000 | .000 |
 Masyn Winn | 0-1 | 1 | 0 | 0 | 0 | 0 | 0 | 0 | 1 | .238 | .317 | .317 |
New York Yankees
| Player | H-AB | AB | R | H | RBI | HR | BB | K | #P | AVG | OBP | SLG |
|---|---|---|---|---|---|---|---|---|---|---|---|---|
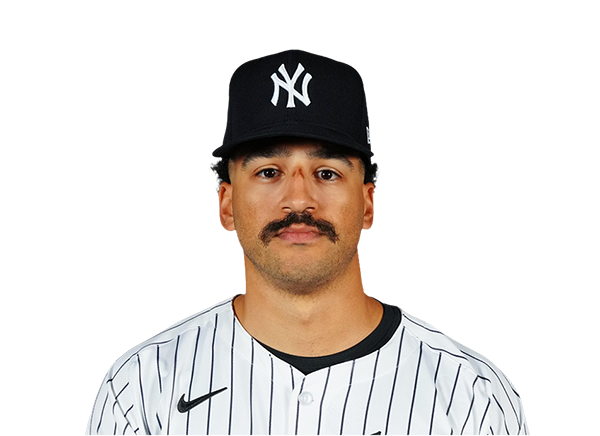 Trent Grisham | 0-5 | 5 | 0 | 0 | 0 | 0 | 0 | 1 | 20 | .211 | .310 | .379 |
 Ben Rice | 0-2 | 2 | 1 | 0 | 0 | 0 | 3 | 1 | 32 | .260 | .355 | .550 |
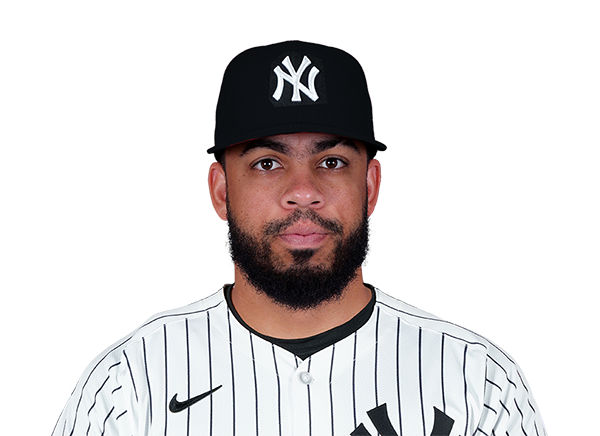 Luis Garcia Jr. | 0-3 | 3 | 0 | 0 | 0 | 0 | 1 | 0 | 18 | .273 | .333 | .545 |
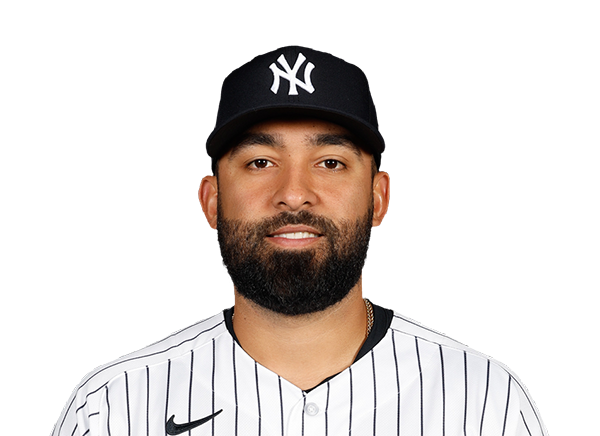 Ali Sanchez | 0-1 | 1 | 0 | 0 | 0 | 0 | 0 | 1 | 7 | .268 | .300 | .357 |
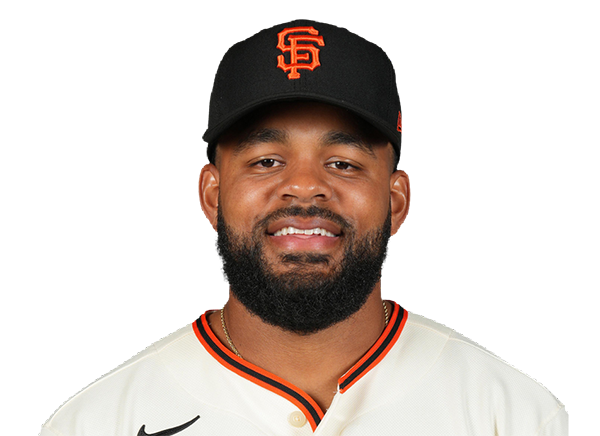 Heliot Ramos | 1-3 | 3 | 0 | 1 | 0 | 0 | 0 | 1 | 21 | .143 | .250 | .286 |
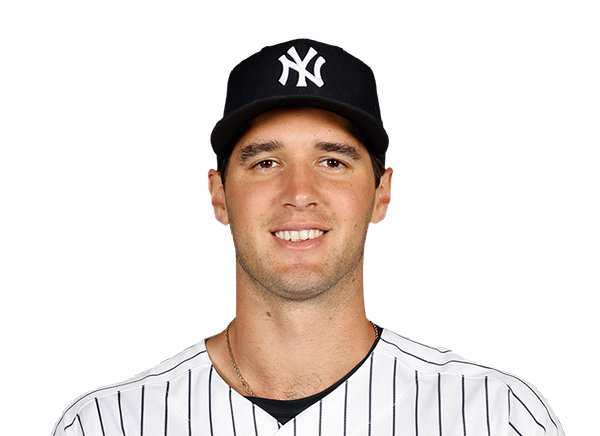 Spencer Jones | 0-4 | 4 | 0 | 0 | 0 | 0 | 0 | 2 | 19 | .213 | .292 | .389 |
 Jazz Chisholm Jr. | 0-2 | 2 | 0 | 0 | 1 | 0 | 2 | 1 | 25 | .217 | .295 | .399 |
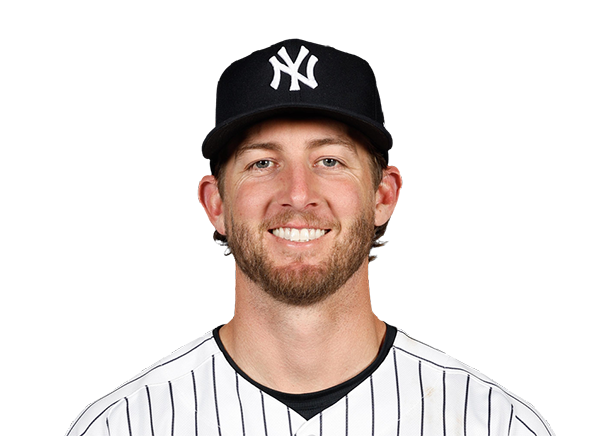 Ryan McMahon | 0-2 | 2 | 0 | 0 | 0 | 0 | 2 | 1 | 17 | .212 | .276 | .372 |
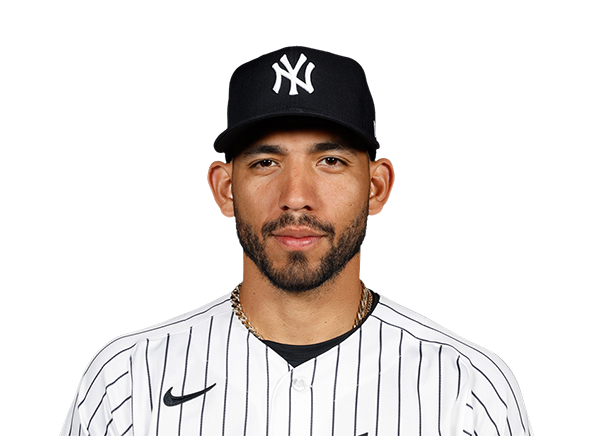 Jose Caballero | 0-0 | 0 | 0 | 0 | 0 | 0 | 0 | 0 | 0 | .245 | .298 | .396 |
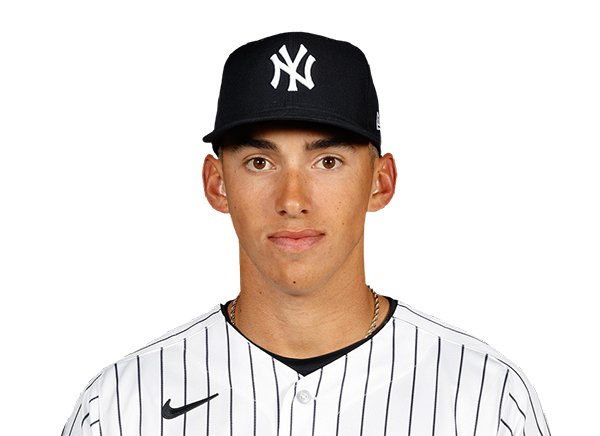 George Lombard Jr. | 1-4 | 4 | 0 | 1 | 0 | 0 | 0 | 2 | 18 | .333 | .429 | .833 |
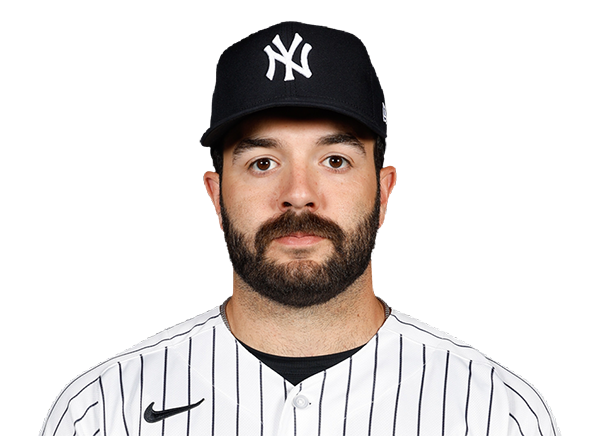 Austin Wells | 1-2 | 2 | 0 | 1 | 0 | 0 | 0 | 0 | 4 | .169 | .268 | .289 |
 Paul Goldschmidt | 1-2 | 2 | 0 | 1 | 0 | 0 | 0 | 0 | 7 | .247 | .307 | .453 |
St. Louis Cardinals
| Player | IP | H | R | ER | BB | K | HR | PC-ST | ERA | PC |
|---|---|---|---|---|---|---|---|---|---|---|
 Andre Pallante | 5.1 | 3 | 1 | 1 | 3 | 4 | 0 | 103-57 | 3.63 | 103 |
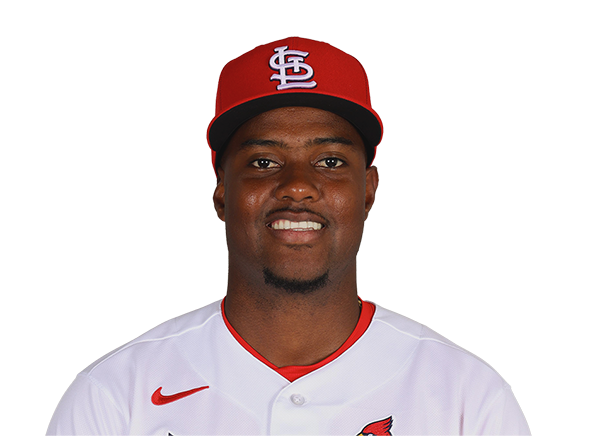 George Soriano | 1.0 | 0 | 0 | 0 | 1 | 3 | 0 | 24-13 | 3.55 | 24 |
 Justin Bruihl | 0.2 | 1 | 0 | 0 | 1 | 0 | 0 | 15-9 | 3.60 | 15 |
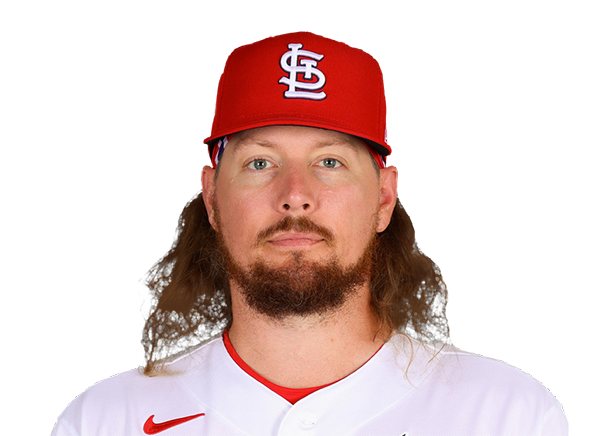 Ryne Stanek | 1.0 | 0 | 0 | 0 | 2 | 2 | 0 | 24-11 | 4.63 | 24 |
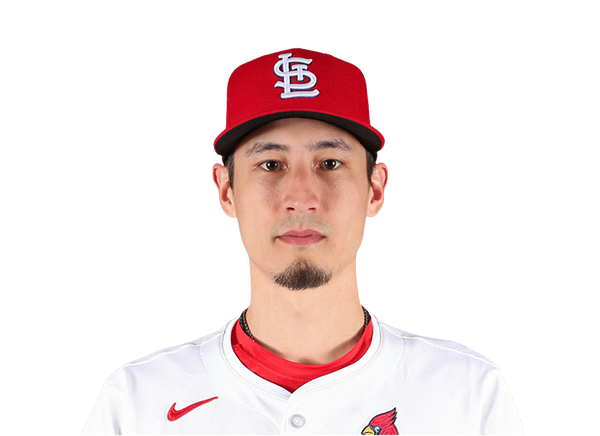 Riley O'Brien | 1.0 | 0 | 0 | 0 | 1 | 1 | 0 | 22-14 | 3.35 | 22 |
New York Yankees
| Player | IP | H | R | ER | BB | K | HR | PC-ST | ERA | PC |
|---|---|---|---|---|---|---|---|---|---|---|
 Will Warren | 5.1 | 7 | 3 | 3 | 1 | 5 | 0 | 91-56 | 4.18 | 91 |
 Kervin Castro | 1.0 | 0 | 0 | 0 | 1 | 1 | 0 | 22-14 | 1.69 | 22 |
 Tim Hill | 1.0 | 0 | 0 | 0 | 0 | 0 | 0 | 14-9 | 4.40 | 14 |
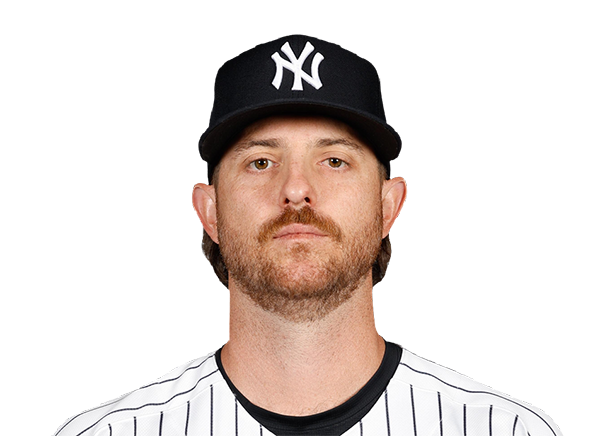 Paul Blackburn | 1.2 | 2 | 0 | 0 | 1 | 2 | 0 | 30-18 | 2.02 | 30 |
H2H / Season Series
NYY1–3
STL
NYY2–0
STL
NYY7–13
STL
Last 5 Games
| Date | Opponent | Result |
|---|---|---|
| Aug 22 |  @ PHI | L3–12 |
| Aug 21 | @ PHI | L6–7 |
| Aug 20 |  @ CIN | W10–9 |
| Aug 19 | @ CIN | L4–5 |
| Aug 18 | @ CIN | W3–0 |
| Date | Opponent | Result |
|---|---|---|
| Aug 22 |  vs TOR | L3–4 |
| Aug 21 | vs TOR | W3–1 |
| Aug 20 |  @ BAL | W6–1 |
| Aug 19 | @ BAL | W5–3 |
| Aug 18 | @ BAL | W3–1 |
Standings
American League
| Team | W | L | PCT | GB | DIFF | STRK |
|---|---|---|---|---|---|---|
1 Rays | 76 | 52 | .594 | - | +43 | L2 |
2 White Sox | 67 | 61 | .523 | 9 | +47 | W1 |
3 Astros | 65 | 64 | .504 | 11.5 | -42 | W1 |
| 4Yankees | 73 | 56 | .566 | 3.5 | +95 | L1 |
5 Red Sox | 69 | 59 | .539 | 7 | +97 | W1 |
6 Rangers | 64 | 65 | .496 | 12.5 | -45 | W2 |
| 7Blue Jays | 64 | 67 | .489 | 13.5 | -50 | W1 |
8 Twins | 63 | 66 | .488 | 13.5 | -45 | L1 |
9 Guardians | 63 | 66 | .488 | 13.5 | -15 | W2 |
| 10Orioles | 62 | 67 | .481 | 14.5 | -34 | W1 |
11 Tigers | 61 | 67 | .477 | 15 | +79 | L3 |
12 Mariners | 61 | 68 | .473 | 15.5 | -45 | W1 |
13 Royals | 56 | 74 | .431 | 21 | -97 | W6 |
14 Angels | 51 | 78 | .395 | 25.5 | -71 | L1 |
15 Athletics | 49 | 80 | .380 | 27.5 | -189 | L5 |
National League
| Team | W | L | PCT | GB | DIFF | STRK |
|---|---|---|---|---|---|---|
1 Brewers | 81 | 49 | .623 | - | +163 | W3 |
2 Dodgers | 78 | 51 | .605 | 2.5 | +146 | W4 |
3 Braves | 75 | 55 | .577 | 6 | +108 | L2 |
4 Cubs | 74 | 55 | .574 | 6.5 | +99 | L2 |
| 5Phillies | 71 | 58 | .550 | 9.5 | +16 | W7 |
6 Padres | 69 | 60 | .535 | 11.5 | +7 | W1 |
7 Diamondbacks | 68 | 61 | .527 | 12.5 | +13 | W2 |
8 Marlins | 66 | 64 | .508 | 15 | +17 | W2 |
| 9Cardinals | 66 | 64 | .508 | 15 | +9 | L1 |
10 Pirates | 63 | 67 | .485 | 18 | +30 | L1 |
| 11Reds | 61 | 68 | .473 | 19.5 | -98 | L2 |
12 Nationals | 61 | 70 | .466 | 20.5 | +14 | L3 |
13 Mets | 58 | 71 | .450 | 22.5 | -44 | L1 |
14 Giants | 52 | 76 | .406 | 28 | -78 | L2 |
15 Rockies | 50 | 78 | .391 | 30 | -130 | L4 |
STL
VS
NYY
Pitchers
Andre Pallante
Catchers
Ivan Herrera
Infielders
JJ Wetherholt
Alec Burleson
Blaze Jordan
Cesar Prieto
Outfielders
Jose Fermin
Nathan Church
Bryan Torres
Designated Hitters
Jimmy Crooks
Pitchers
Will Warren
Catchers
Austin Wells
Infielders
Luis Garcia Jr.
Jazz Chisholm Jr.
Ryan McMahon
George Lombard Jr.
Outfielders
Trent Grisham
Heliot Ramos
Spencer Jones
Designated Hitters
Ben Rice
Cardinals
VS
Yankees
Batting
115
Team Games Played
115
3856
At Bats
3813
924
Hits
881
486
Runs Batted In
497
118
Home Runs
164
67
Stolen Bases
108
.240
Batting Average
.231
499
Runs
522
158
Doubles
169
12
Triples
14
1460
Total Bases
1570
371
Walks
420
890
Strikeouts
1046
.315
On Base Percentage
.310
.379
Slugging Percentage
.412
.694
OBP Pct + SLG Pct
.721
115
Games Played
115
115
Games Started
115
69
Hit By Pitch
25
0.0
Wins Above Replacement
0.0
0.0
Offensive Wins Above Replacement
0.0
21
Caught Stealing
34
1
Is Qualified
1
467.3
Runs Created
499.0
4.1
Runs Created Per 27 Outs
4.4
.085
Walks Per Plate Appearance
.098
0.42
Walk To Strikeout Ratio
0.40
.139
Isolated Power
.181
.247
Secondary Average
.310
3.85
Pitches Per Plate Appearance
3.98
288
Extra Base Hits
347
4350
Plate Appearances
4294
32.7
At Bats Per Home Run
23.3
17
Sacrifice Hit
6
35
Sacrifice Flies
26
Pitching
115
Team Games Played
115
44
Quality Starts
45
57
Wins
64
58
Losses
51
32
Saves
32
73
Holds
61
986
Hits
863
470
Earned runs
380
114
Home Runs
112
389
Walks
355
880
Strikeouts
1030
7.7
Strikeouts Per 9 Innings
9.0
148.5
Pitches Per Start
144.6
1.34
Walks Plus Hits Per Inning Pitched
1.19
4.12
Earned Run Average
3.33
58
Losses
51
1026.1
Innings pitched
1025.2
.496
Win Percentage
.557
53
Save Opportunities
53
.252
Opponent Batting Average
.226
.326
Opponent's On-base pct.
.297
.396
Opponent's Slugging pct.
.364
.722
Opponent's OPB Pct + SLG Pct
.662
3905
At Bats
3820
197
Doubles
163
10
Triples
15
56
Batters Hit
45
77
Stolen Bases
58
115
Games Played
115
1
Complete Games
0
7
Shutouts
12
49
Wild Pitches
27
485
Runs Batted In
422
2
Balks
3
1026.1
Innings pitched
1025.2
7.7
Strikeouts Per 9 Innings
9.0
20
Caught Stealing
16
115
Games Started
115
0.0
Wins Above Replacement
0.0
1
Is Qualified
1
509
Runs
441
470
Earned Runs
380
1545
Total Bases
1392
Fielding
115
Team Games Played
115
1026
Full Innings
1026
4210
Total Chances
4149
3079
Putouts
3077
1080
Assists
1011
51
Errors
61
158
Double Plays
169
0.988
Fielding Percentage
0.985
36.5
Range Factor
35.9
0.0
Zone Rating
0.0
115
Games Played
115
0
Games Started
0
0.0
Defensive Wins Above Replacement
0.0
1
Qualified
1