

Diamondbacks vs Cubs Live Score (3 May, 2026)
Game Information
Stage
Standard
Season
2026
First Pitch
Sun, May 3, 2:20 pm
Venue
Wrigley Field
Location
Chicago, Illinois
Attendance
35,597
Live Situation
2Balls
3Strikes
0Outs
—Pitcher
—At Bat
Pitch Sequence
1
STRIKE LOOKING
Sweeper
86 MPH
2
BALL
Changeup
90 MPH
3
STRIKE FOUL
Curve
85 MPH
4
BALL
Curve
86 MPH
5
STRIKE SWINGING
Sweeper
86 MPH
Injury Report


Team Stats
 ARI
CHC


4
Runs
8
7
Hits
12
0
Errors
0
2
Home Runs
1
3
Walks
6
8
Strikeouts
8
Player Box Score
Arizona Diamondbacks
| Player | H-AB | AB | R | H | RBI | HR | BB | K | #P | AVG | OBP | SLG |
|---|---|---|---|---|---|---|---|---|---|---|---|---|
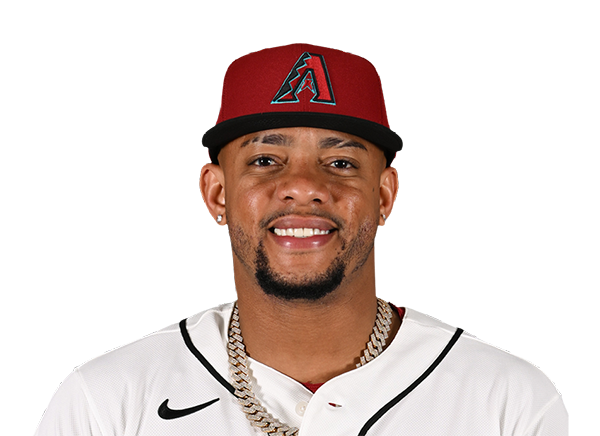 Ketel Marte | 0-5 | 5 | 0 | 0 | 0 | 0 | 0 | 3 | 22 | .214 | .272 | .357 |
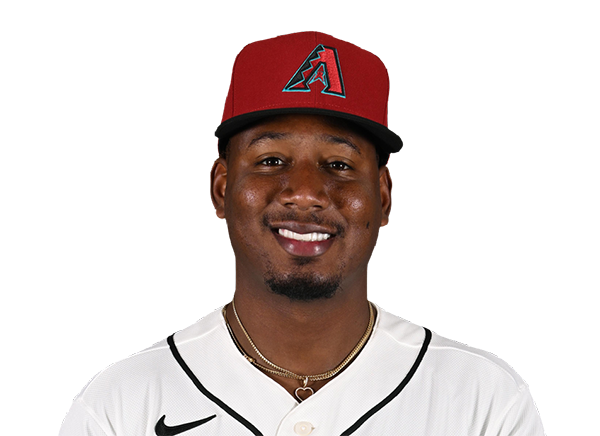 Geraldo Perdomo | 1-4 | 4 | 0 | 1 | 0 | 0 | 0 | 0 | 21 | .245 | .352 | .402 |
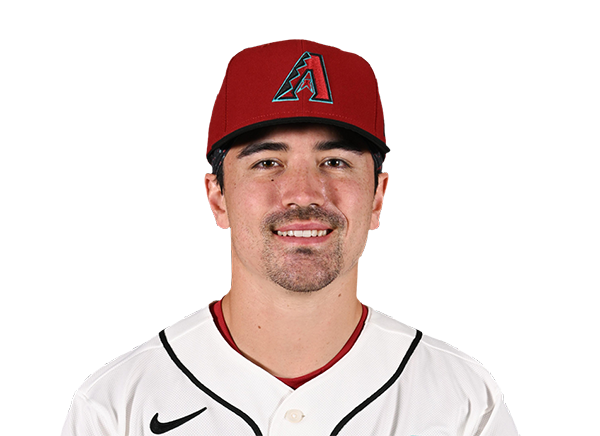 Corbin Carroll | 0-3 | 3 | 0 | 0 | 0 | 0 | 1 | 1 | 13 | .273 | .372 | .518 |
 Ildemaro Vargas | 1-4 | 4 | 0 | 1 | 0 | 0 | 0 | 0 | 11 | .382 | .406 | .657 |
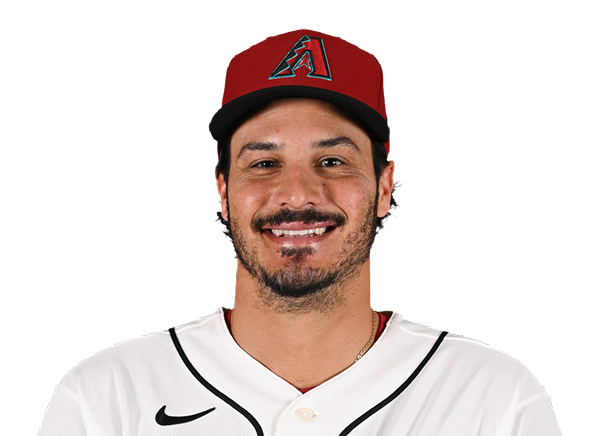 Nolan Arenado | 1-4 | 4 | 1 | 1 | 0 | 0 | 0 | 1 | 17 | .275 | .310 | .440 |
 Lourdes Gurriel Jr. | 2-3 | 3 | 1 | 2 | 0 | 0 | 1 | 1 | 17 | .233 | .283 | .279 |
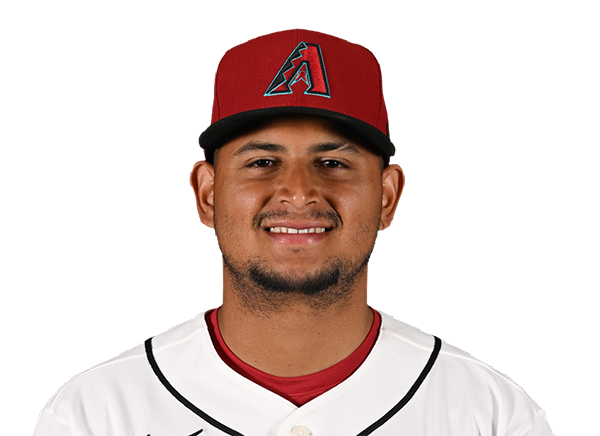 Gabriel Moreno | 1-4 | 4 | 1 | 1 | 2 | 1 | 0 | 1 | 19 | .245 | .296 | .408 |
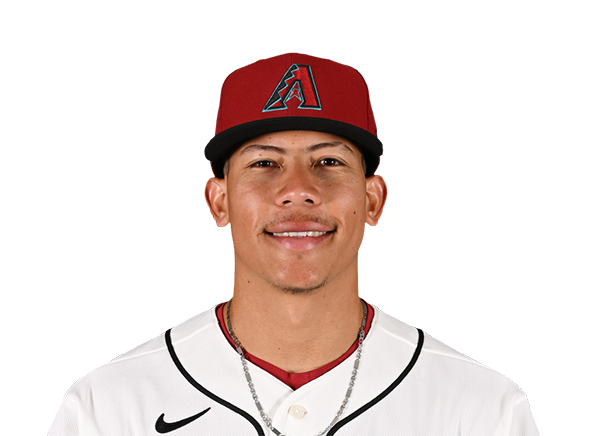 Jose Fernandez | 0-3 | 3 | 0 | 0 | 0 | 0 | 0 | 1 | 16 | .304 | .340 | .435 |
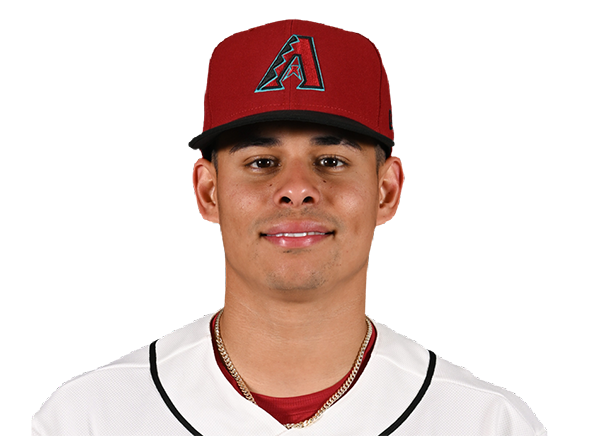 Jorge Barrosa | 0-2 | 2 | 0 | 0 | 0 | 0 | 1 | 0 | 17 | .203 | .257 | .406 |
 Adrian Del Castillo | 1-1 | 1 | 1 | 1 | 2 | 1 | 0 | 0 | 7 | .222 | .258 | .413 |
Chicago Cubs
| Player | H-AB | AB | R | H | RBI | HR | BB | K | #P | AVG | OBP | SLG |
|---|---|---|---|---|---|---|---|---|---|---|---|---|
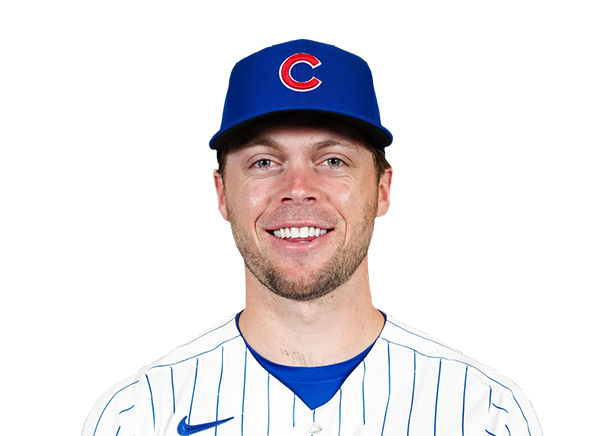 Nico Hoerner | 2-5 | 5 | 1 | 2 | 0 | 0 | 0 | 0 | 15 | .301 | .375 | .466 |
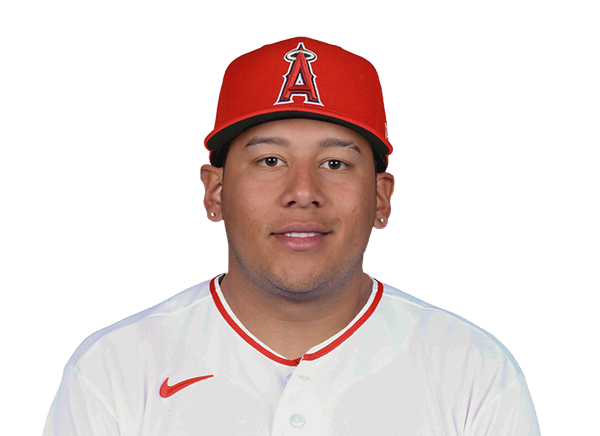 Moises Ballesteros | 2-4 | 4 | 2 | 2 | 2 | 1 | 1 | 1 | 21 | .317 | .380 | .598 |
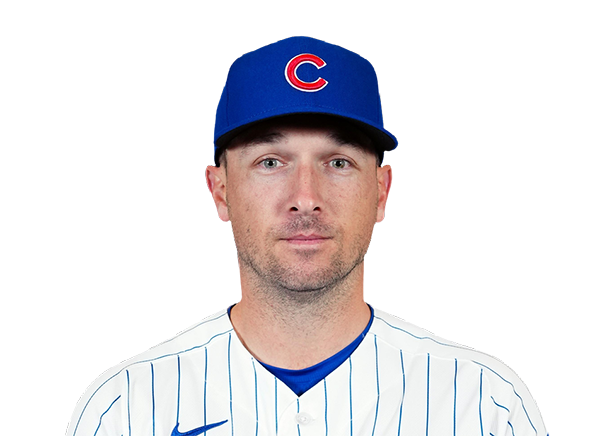 Alex Bregman | 0-4 | 4 | 1 | 0 | 0 | 0 | 1 | 1 | 20 | .243 | .333 | .353 |
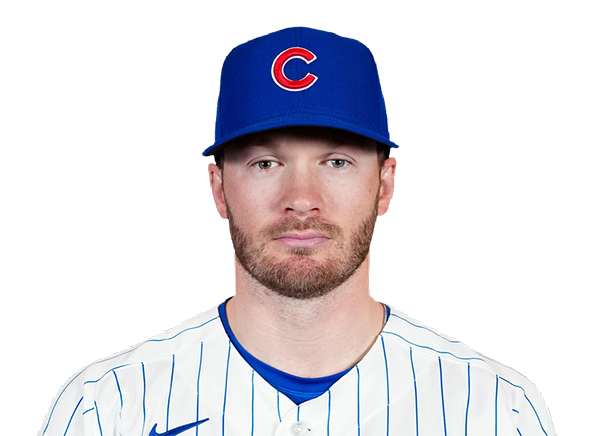 Ian Happ | 1-3 | 3 | 2 | 1 | 0 | 0 | 2 | 1 | 29 | .248 | .381 | .512 |
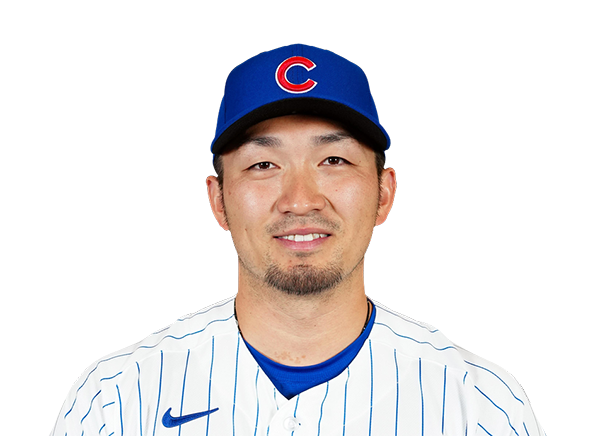 Seiya Suzuki | 2-5 | 5 | 1 | 2 | 0 | 0 | 0 | 3 | 15 | .308 | .402 | .526 |
 Michael Busch | 2-3 | 3 | 1 | 2 | 4 | 0 | 1 | 1 | 15 | .218 | .317 | .339 |
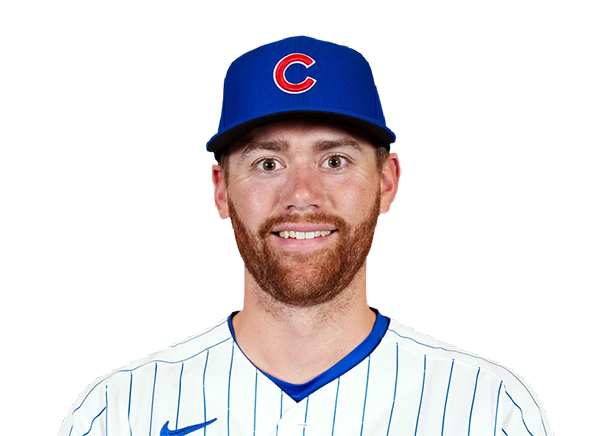 Carson Kelly | 2-4 | 4 | 0 | 2 | 2 | 0 | 0 | 0 | 17 | .325 | .417 | .446 |
 Pete Crow-Armstrong | 1-4 | 4 | 0 | 1 | 0 | 0 | 0 | 0 | 7 | .236 | .302 | .354 |
 Dansby Swanson | 0-3 | 3 | 0 | 0 | 0 | 0 | 1 | 1 | 17 | .213 | .338 | .417 |
Arizona Diamondbacks
| Player | IP | H | R | ER | BB | K | HR | PC-ST | ERA | PC |
|---|---|---|---|---|---|---|---|---|---|---|
 Merrill Kelly | 4.1 | 8 | 6 | 6 | 3 | 5 | 1 | 92-58 | 9.95 | 92 |
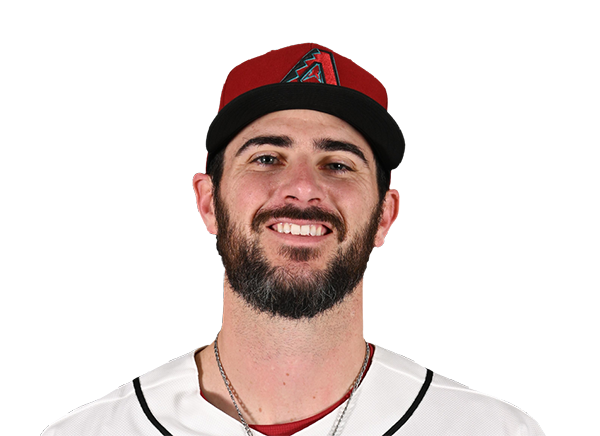 Ryan Thompson | 0.2 | 0 | 0 | 0 | 0 | 0 | 0 | 4-4 | 3.38 | 4 |
 Brandon Pfaadt | 2.1 | 4 | 2 | 2 | 3 | 1 | 0 | 52-28 | 5.83 | 52 |
 Paul Sewald | 0.2 | 0 | 0 | 0 | 0 | 2 | 0 | 8-6 | 3.86 | 8 |
Chicago Cubs
| Player | IP | H | R | ER | BB | K | HR | PC-ST | ERA | PC |
|---|---|---|---|---|---|---|---|---|---|---|
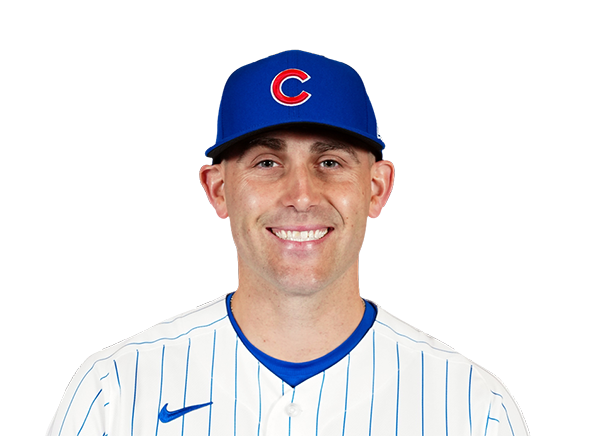 Matthew Boyd | 6.0 | 4 | 2 | 2 | 1 | 5 | 1 | 94-65 | 6.00 | 94 |
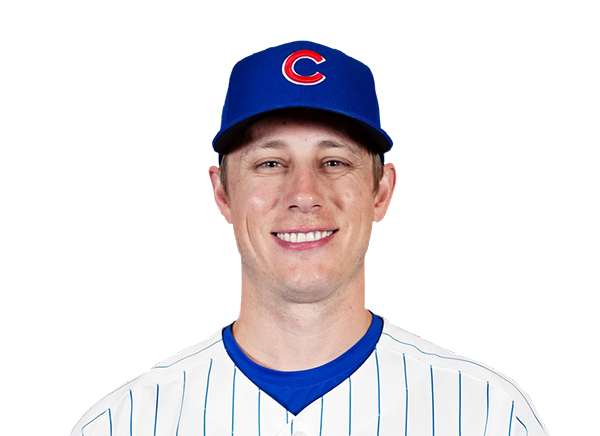 Phil Maton | 1.0 | 1 | 0 | 0 | 1 | 1 | 0 | 25-15 | 10.29 | 25 |
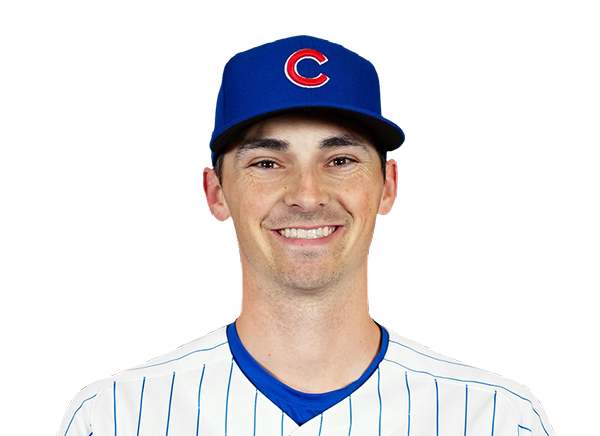 Hoby Milner | 1.0 | 1 | 0 | 0 | 0 | 0 | 0 | 15-9 | 2.25 | 15 |
 Corbin Martin | 1.0 | 1 | 2 | 2 | 1 | 2 | 1 | 26-14 | 5.40 | 26 |
H2H / Season Series
CHC8–4
ARI
CHC2–0
ARI
CHC6–5
ARI
ARI16–8
CHC
CHC8–1
ARI
Last 5 Games
| Date | Opponent | Result |
|---|---|---|
| Aug 22 |  vs CIN | L5–11 |
| Aug 21 | vs CIN | W9–0 |
| Aug 19 |  @ BOS | W7–6 |
| Aug 18 | @ BOS | L4–9 |
| Aug 17 | @ BOS | L1–11 |
| Date | Opponent | Result |
|---|---|---|
| Aug 22 |  @ SEA | L4–5 |
| Aug 21 | @ SEA | L5–6 |
| Aug 19 |  vs CHW | L0–3 |
| Aug 18 | vs CHW | W4–3 |
| Aug 17 | vs CHW | W7–5 |
Standings
American League
| Team | W | L | PCT | GB | DIFF | STRK |
|---|---|---|---|---|---|---|
1 Rays | 76 | 53 | .589 | - | +42 | L3 |
| 2White Sox | 67 | 62 | .519 | 9 | +42 | L1 |
3 Astros | 65 | 65 | .500 | 11.5 | -43 | L1 |
4 Yankees | 73 | 56 | .566 | 3 | +95 | L1 |
| 5Red Sox | 70 | 59 | .543 | 6 | +98 | W2 |
6 Rangers | 64 | 66 | .492 | 12.5 | -48 | L1 |
7 Guardians | 64 | 66 | .492 | 12.5 | -14 | W3 |
8 Blue Jays | 64 | 67 | .489 | 13 | -50 | W1 |
9 Twins | 63 | 67 | .485 | 13.5 | -47 | L2 |
10 Orioles | 63 | 67 | .485 | 13.5 | -33 | W2 |
| 11Mariners | 62 | 68 | .477 | 14.5 | -44 | W2 |
12 Tigers | 61 | 68 | .473 | 15 | +77 | L4 |
13 Royals | 57 | 74 | .435 | 20 | -95 | W7 |
14 Angels | 52 | 78 | .400 | 24.5 | -68 | W1 |
15 Athletics | 50 | 80 | .385 | 26.5 | -188 | W1 |
National League
| Team | W | L | PCT | GB | DIFF | STRK |
|---|---|---|---|---|---|---|
1 Brewers | 81 | 49 | .623 | - | +163 | W3 |
2 Dodgers | 79 | 51 | .608 | 2 | +147 | W5 |
3 Braves | 75 | 55 | .577 | 6 | +108 | L2 |
| 4Cubs | 74 | 56 | .569 | 7 | +98 | L3 |
5 Phillies | 72 | 58 | .554 | 9 | +25 | W8 |
6 Padres | 70 | 60 | .538 | 11 | +9 | W2 |
| 7Diamondbacks | 68 | 62 | .523 | 13 | +7 | L1 |
8 Marlins | 66 | 64 | .508 | 15 | +17 | W2 |
9 Cardinals | 66 | 65 | .504 | 15.5 | 0 | L2 |
10 Pirates | 63 | 68 | .481 | 18.5 | +29 | L2 |
| 11Reds | 62 | 68 | .477 | 19 | -92 | W1 |
12 Nationals | 61 | 70 | .466 | 20.5 | +14 | L3 |
13 Mets | 59 | 71 | .454 | 22 | -39 | W1 |
14 Giants | 52 | 77 | .403 | 28.5 | -79 | L3 |
15 Rockies | 50 | 79 | .388 | 30.5 | -131 | L5 |
ARI
VS
CHC
Pitchers
Merrill Kelly
Ryan Thompson
Brandon Pfaadt
Paul Sewald
Catchers
Gabriel Moreno
Infielders
Ketel Marte
Geraldo Perdomo
Ildemaro Vargas
Nolan Arenado
Outfielders
Corbin Carroll
Lourdes Gurriel Jr.
Jorge Barrosa
Designated Hitters
Jose Fernandez
Other Players
Adrian Del Castillo
Pitchers
Matthew Boyd
Phil Maton
Hoby Milner
Corbin Martin
Catchers
Carson Kelly
Infielders
Nico Hoerner
Alex Bregman
Michael Busch
Dansby Swanson
Outfielders
Ian Happ
Seiya Suzuki
Pete Crow-Armstrong
Designated Hitters
Moises Ballesteros
Diamondbacks
VS
Cubs
Batting
130
Team Games Played
130
4369
At Bats
4465
1069
Hits
1108
565
Runs Batted In
626
129
Home Runs
170
89
Stolen Bases
97
.245
Batting Average
.248
593
Runs
665
226
Doubles
219
33
Triples
20
1748
Total Bases
1877
439
Walks
549
944
Strikeouts
1122
.318
On Base Percentage
.337
.400
Slugging Percentage
.420
.718
OBP Pct + SLG Pct
.757
130
Games Played
130
130
Games Started
130
47
Hit By Pitch
66
0.0
Wins Above Replacement
0.0
0.0
Offensive Wins Above Replacement
0.0
20
Caught Stealing
17
1
Is Qualified
1
573.6
Runs Created
657.8
4.5
Runs Created Per 27 Outs
5.1
.089
Walks Per Plate Appearance
.107
0.47
Walk To Strikeout Ratio
0.49
.155
Isolated Power
.172
.272
Secondary Average
.313
3.94
Pitches Per Plate Appearance
3.97
388
Extra Base Hits
409
4930
Plate Appearances
5122
33.9
At Bats Per Home Run
26.3
32
Sacrifice Hit
6
40
Sacrifice Flies
35
Pitching
130
Team Games Played
130
47
Quality Starts
40
68
Wins
74
62
Losses
56
31
Saves
29
71
Holds
49
1111
Hits
1073
538
Earned runs
536
153
Home Runs
195
381
Walks
391
881
Strikeouts
999
6.9
Strikeouts Per 9 Innings
7.7
140.9
Pitches Per Start
144.7
1.29
Walks Plus Hits Per Inning Pitched
1.26
4.20
Earned Run Average
4.15
62
Losses
56
1154.0
Innings pitched
1163.0
.523
Win Percentage
.569
46
Save Opportunities
50
.253
Opponent Batting Average
.244
.317
Opponent's On-base pct.
.312
.419
Opponent's Slugging pct.
.417
.736
Opponent's OPB Pct + SLG Pct
.729
4399
At Bats
4391
220
Doubles
154
26
Triples
10
50
Batters Hit
51
76
Stolen Bases
69
130
Games Played
130
1
Complete Games
0
8
Shutouts
5
26
Wild Pitches
28
571
Runs Batted In
548
5
Balks
2
1154.0
Innings pitched
1163.0
6.9
Strikeouts Per 9 Innings
7.7
17
Caught Stealing
25
130
Games Started
130
0.0
Wins Above Replacement
0.0
1
Is Qualified
1
586
Runs
567
538
Earned Runs
536
1842
Total Bases
1832
Fielding
130
Team Games Played
130
1154
Full Innings
1163
4641
Total Chances
4762
3462
Putouts
3489
1131
Assists
1225
48
Errors
48
226
Double Plays
219
0.990
Fielding Percentage
0.990
35.8
Range Factor
36.5
0.0
Zone Rating
0.0
130
Games Played
130
0
Games Started
0
0.0
Defensive Wins Above Replacement
0.0
1
Qualified
1