

Diamondbacks vs Guardians Live Score (2 Aug, 2026)
Game Information
Stage
Standard
Season
2026
First Pitch
Sun, Aug 2, 1:40 pm
Venue
Progressive Field
Location
Cleveland, Ohio
Attendance
24,869
Live Situation
1Balls
1Strikes
0Outs
—Pitcher
—At Bat
Pitch Sequence
1
BALL
Splitter
89 MPH
2
STRIKE FOUL
Four-seam FB
99 MPH
3
BALL IN PLAY
Splitter
89 MPH
Injury Report


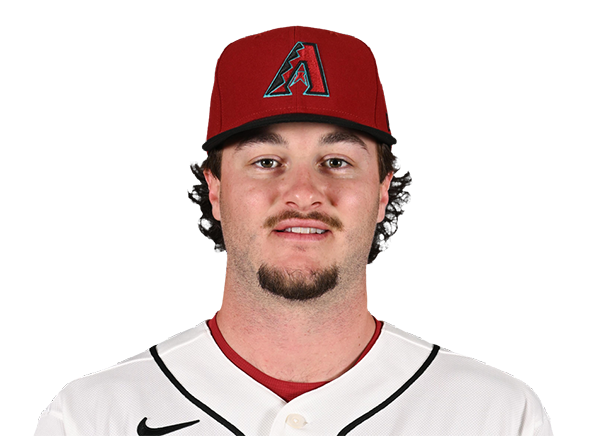
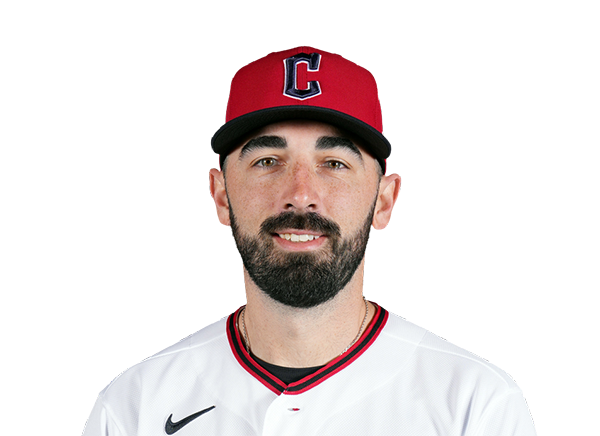



Team Stats
 ARI
CLE


0
Runs
5
2
Hits
8
0
Errors
2
0
Home Runs
1
5
Walks
4
13
Strikeouts
8
Player Box Score
Arizona Diamondbacks
| Player | H-AB | AB | R | H | RBI | HR | BB | K | #P | AVG | OBP | SLG |
|---|---|---|---|---|---|---|---|---|---|---|---|---|
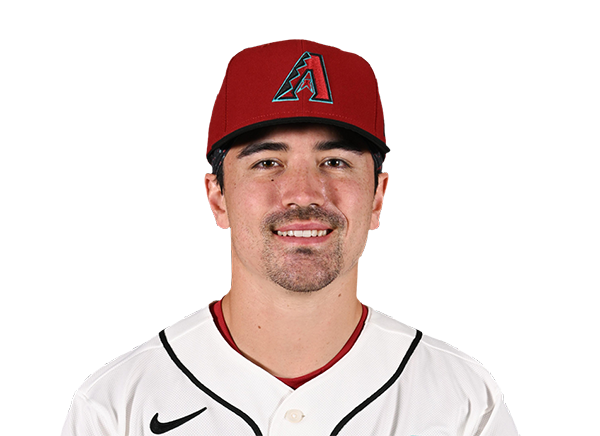 Corbin Carroll | 0-3 | 3 | 0 | 0 | 0 | 0 | 1 | 3 | 22 | .247 | .343 | .479 |
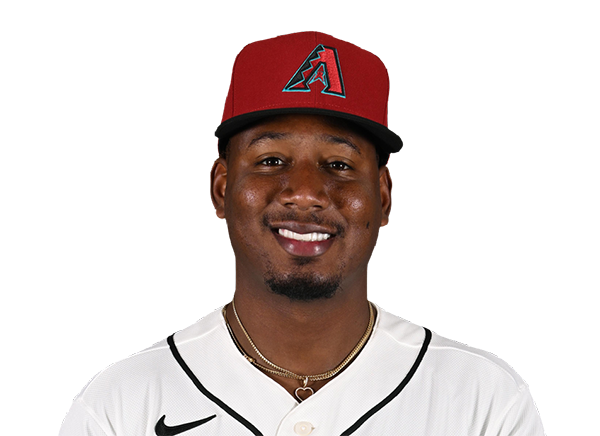 Geraldo Perdomo | 1-3 | 3 | 0 | 1 | 0 | 0 | 1 | 0 | 13 | .239 | .356 | .366 |
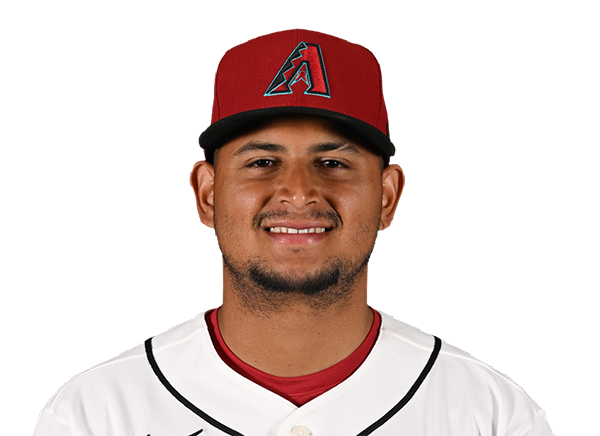 Gabriel Moreno | 0-4 | 4 | 0 | 0 | 0 | 0 | 0 | 1 | 26 | .298 | .380 | .438 |
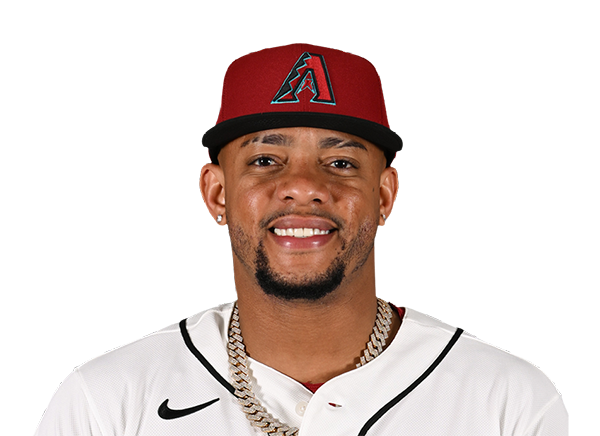 Ketel Marte | 0-4 | 4 | 0 | 0 | 0 | 0 | 0 | 1 | 11 | .251 | .305 | .446 |
 Max Kepler | 0-3 | 3 | 0 | 0 | 0 | 0 | 1 | 2 | 22 | .229 | .290 | .373 |
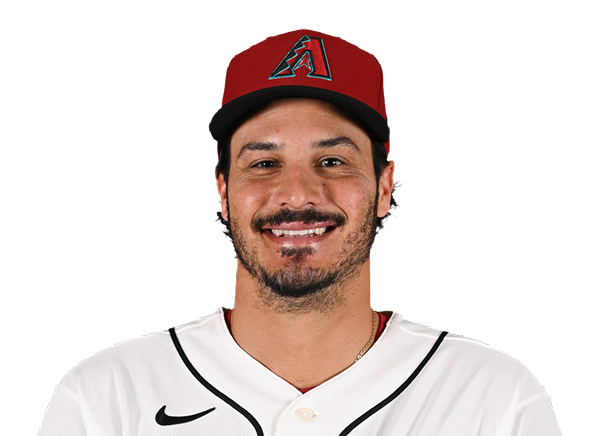 Nolan Arenado | 0-2 | 2 | 0 | 0 | 0 | 0 | 1 | 1 | 20 | .243 | .324 | .423 |
 Tim Tawa | 1-4 | 4 | 0 | 1 | 0 | 0 | 0 | 2 | 13 | .209 | .268 | .353 |
 Ildemaro Vargas | 0-4 | 4 | 0 | 0 | 0 | 0 | 0 | 2 | 19 | .272 | .318 | .406 |
 Tyler Locklear | 0-2 | 2 | 0 | 0 | 0 | 0 | 1 | 1 | 12 | .240 | .355 | .400 |
 Adrian Del Castillo | 0-1 | 1 | 0 | 0 | 0 | 0 | 0 | 0 | 3 | .197 | .251 | .318 |
Cleveland Guardians
| Player | H-AB | AB | R | H | RBI | HR | BB | K | #P | AVG | OBP | SLG |
|---|---|---|---|---|---|---|---|---|---|---|---|---|
 Steven Kwan | 1-2 | 2 | 1 | 1 | 0 | 0 | 2 | 0 | 16 | .261 | .362 | .320 |
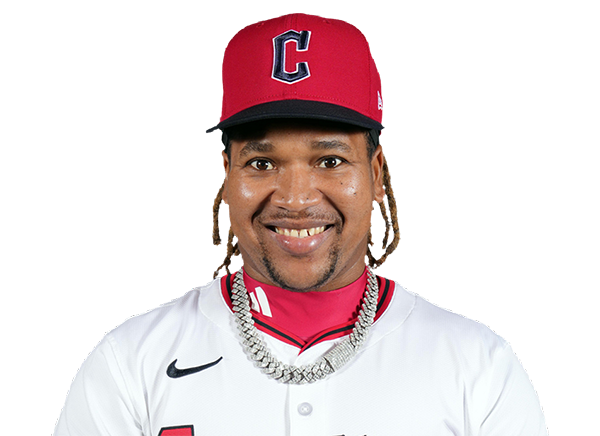 Jose Ramirez | 1-4 | 4 | 1 | 1 | 0 | 0 | 0 | 0 | 13 | .233 | .331 | .388 |
 Chase DeLauter | 2-4 | 4 | 1 | 2 | 3 | 0 | 0 | 1 | 19 | .278 | .347 | .444 |
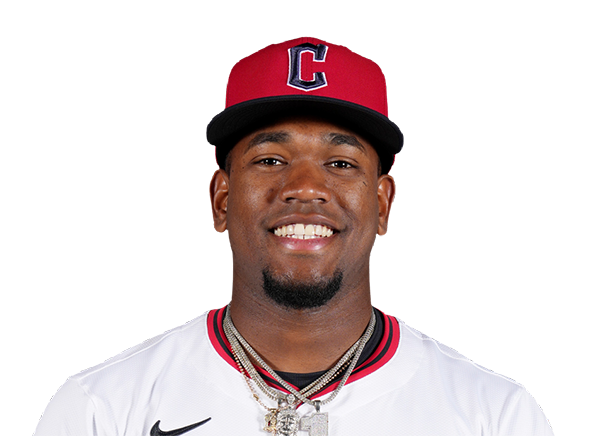 Angel Martinez | 0-0 | 0 | 0 | 0 | 0 | 0 | 0 | 0 | 0 | .225 | .260 | .414 |
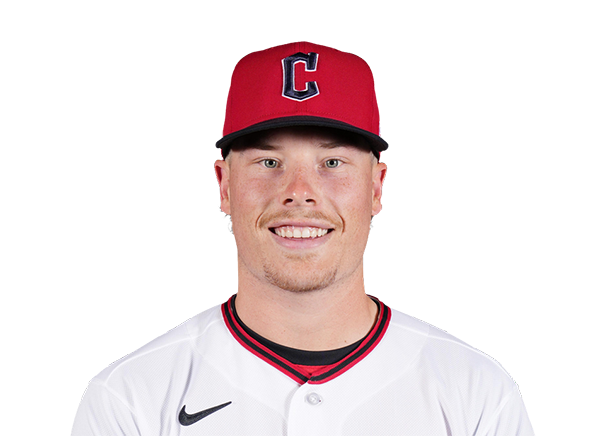 Travis Bazzana | 1-2 | 2 | 0 | 1 | 0 | 0 | 2 | 0 | 21 | .245 | .342 | .397 |
 Kyle Manzardo | 1-4 | 4 | 0 | 1 | 1 | 0 | 0 | 2 | 14 | .215 | .306 | .378 |
 Brayan Rocchio | 0-4 | 4 | 0 | 0 | 0 | 0 | 0 | 1 | 13 | .258 | .319 | .383 |
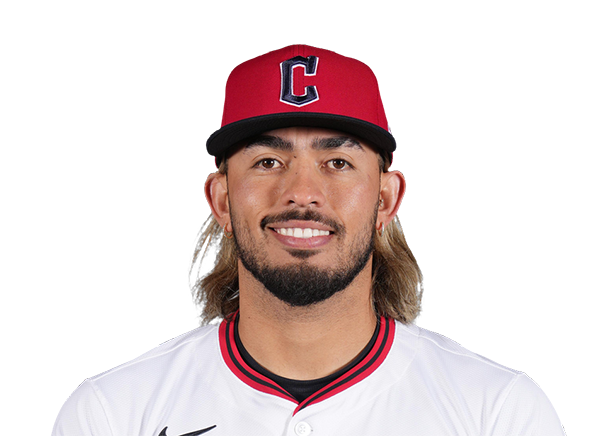 Gabriel Arias | 0-4 | 4 | 0 | 0 | 0 | 0 | 0 | 3 | 15 | .252 | .292 | .398 |
 Patrick Bailey | 1-3 | 3 | 1 | 1 | 1 | 1 | 0 | 1 | 8 | .223 | .268 | .392 |
 Petey Halpin | 1-3 | 3 | 1 | 1 | 0 | 0 | 0 | 0 | 8 | .213 | .246 | .315 |
Arizona Diamondbacks
| Player | IP | H | R | ER | BB | K | HR | PC-ST | ERA | PC |
|---|---|---|---|---|---|---|---|---|---|---|
 Merrill Kelly | 5.0 | 8 | 5 | 5 | 4 | 5 | 1 | 96-56 | 5.04 | 96 |
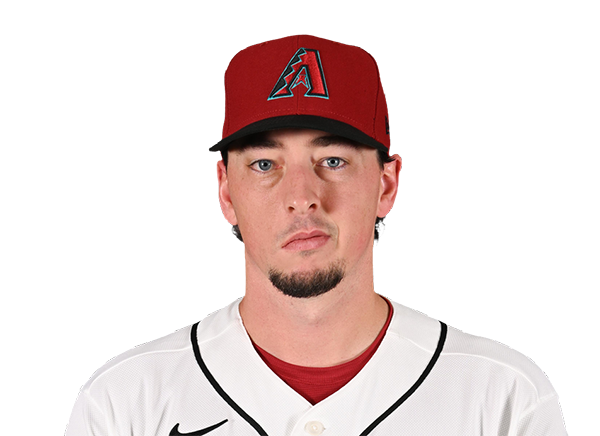 Taylor Clarke | 1.2 | 0 | 0 | 0 | 0 | 1 | 0 | 20-12 | 2.12 | 20 |
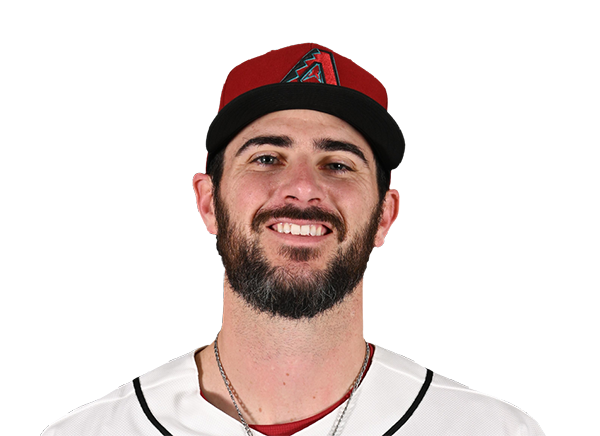 Ryan Thompson | 1.1 | 0 | 0 | 0 | 0 | 2 | 0 | 11-9 | 4.24 | 11 |
Cleveland Guardians
| Player | IP | H | R | ER | BB | K | HR | PC-ST | ERA | PC |
|---|---|---|---|---|---|---|---|---|---|---|
 Gavin Williams | 5.2 | 1 | 0 | 0 | 1 | 10 | 0 | 89-60 | 3.56 | 89 |
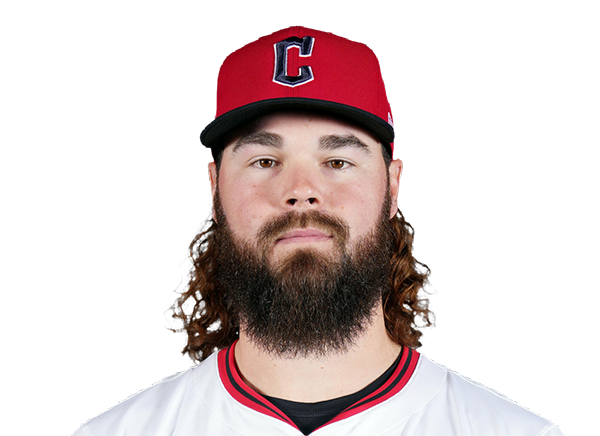 Hunter Gaddis | 0.1 | 0 | 0 | 0 | 1 | 0 | 0 | 13-6 | 3.68 | 13 |
 Craig Yoho | 1.0 | 0 | 0 | 0 | 0 | 1 | 0 | 12-7 | 3.00 | 12 |
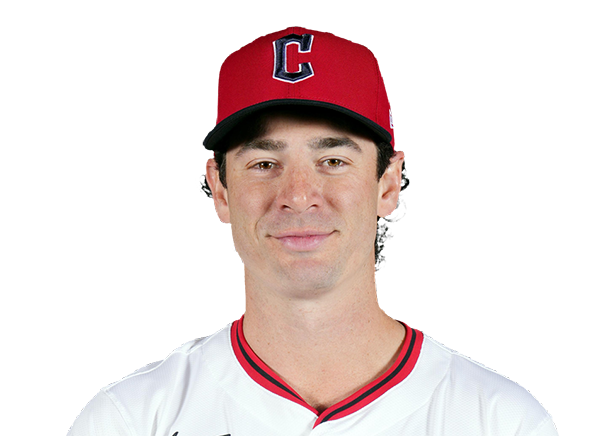 Matt Festa | 0.2 | 1 | 0 | 0 | 1 | 1 | 0 | 16-7 | 4.37 | 16 |
 Cade Smith | 1.1 | 0 | 0 | 0 | 2 | 1 | 0 | 31-18 | 2.45 | 31 |
H2H / Season Series
CLE5–0
ARI
CLE8–12
ARI
CLE1–4
ARI
ARI5–10
CLE
ARI0–7
CLE
ARI9–6
CLE
CLE9–5
ARI
Last 5 Games
| Date | Opponent | Result |
|---|---|---|
| Aug 22 |  vs CIN | L5–11 |
| Aug 21 | vs CIN | W9–0 |
| Aug 19 |  @ BOS | W7–6 |
| Aug 18 | @ BOS | L4–9 |
| Aug 17 | @ BOS | L1–11 |
| Date | Opponent | Result |
|---|---|---|
| Aug 22 |  @ COL | W4–3 |
| Aug 21 | @ COL | W9–1 |
| Aug 20 |  vs SF | W5–2 |
| Aug 19 | vs SF | L0–1 |
| Aug 18 | vs SF | W8–1 |
Standings
American League
| Team | W | L | PCT | GB | DIFF | STRK |
|---|---|---|---|---|---|---|
1 Rays | 76 | 53 | .589 | - | +42 | L3 |
2 White Sox | 67 | 62 | .519 | 9 | +42 | L1 |
3 Astros | 65 | 65 | .500 | 11.5 | -43 | L1 |
4 Yankees | 73 | 56 | .566 | 3 | +95 | L1 |
| 5Red Sox | 70 | 59 | .543 | 6 | +98 | W2 |
6 Rangers | 64 | 66 | .492 | 12.5 | -48 | L1 |
| 7Guardians | 64 | 66 | .492 | 12.5 | -14 | W3 |
8 Blue Jays | 64 | 67 | .489 | 13 | -50 | W1 |
9 Twins | 63 | 67 | .485 | 13.5 | -47 | L2 |
10 Orioles | 63 | 67 | .485 | 13.5 | -33 | W2 |
11 Mariners | 62 | 68 | .477 | 14.5 | -44 | W2 |
12 Tigers | 61 | 68 | .473 | 15 | +77 | L4 |
13 Royals | 57 | 74 | .435 | 20 | -95 | W7 |
14 Angels | 52 | 78 | .400 | 24.5 | -68 | W1 |
15 Athletics | 50 | 80 | .385 | 26.5 | -188 | W1 |
National League
| Team | W | L | PCT | GB | DIFF | STRK |
|---|---|---|---|---|---|---|
1 Brewers | 81 | 49 | .623 | - | +163 | W3 |
2 Dodgers | 79 | 51 | .608 | 2 | +147 | W5 |
3 Braves | 75 | 55 | .577 | 6 | +108 | L2 |
4 Cubs | 74 | 56 | .569 | 7 | +98 | L3 |
5 Phillies | 72 | 58 | .554 | 9 | +25 | W8 |
6 Padres | 70 | 60 | .538 | 11 | +9 | W2 |
| 7Diamondbacks | 68 | 62 | .523 | 13 | +7 | L1 |
8 Marlins | 66 | 64 | .508 | 15 | +17 | W2 |
9 Cardinals | 66 | 65 | .504 | 15.5 | 0 | L2 |
10 Pirates | 63 | 68 | .481 | 18.5 | +29 | L2 |
| 11Reds | 62 | 68 | .477 | 19 | -92 | W1 |
12 Nationals | 61 | 70 | .466 | 20.5 | +14 | L3 |
13 Mets | 59 | 71 | .454 | 22 | -39 | W1 |
| 14Giants | 52 | 77 | .403 | 28.5 | -79 | L3 |
| 15Rockies | 50 | 79 | .388 | 30.5 | -131 | L5 |
ARI
VS
CLE
Pitchers
Merrill Kelly
Catchers
Gabriel Moreno
Infielders
Geraldo Perdomo
Nolan Arenado
Ildemaro Vargas
Tyler Locklear
Outfielders
Corbin Carroll
Max Kepler
Tim Tawa
Designated Hitters
Ketel Marte
Pitchers
Gavin Williams
Catchers
Patrick Bailey
Infielders
Travis Bazzana
Kyle Manzardo
Brayan Rocchio
Gabriel Arias
Outfielders
Steven Kwan
Chase DeLauter
Petey Halpin
Designated Hitters
Jose Ramirez
Diamondbacks
VS
Guardians
Batting
112
Team Games Played
113
3756
At Bats
3731
907
Hits
862
482
Runs Batted In
428
107
Home Runs
109
73
Stolen Bases
113
.241
Batting Average
.231
508
Runs
446
194
Doubles
169
25
Triples
11
1472
Total Bases
1380
369
Walks
405
817
Strikeouts
936
.313
On Base Percentage
.310
.392
Slugging Percentage
.370
.705
OBP Pct + SLG Pct
.680
112
Games Played
113
112
Games Started
113
41
Hit By Pitch
36
0.0
Wins Above Replacement
0.0
0.0
Offensive Wins Above Replacement
0.0
18
Caught Stealing
21
1
Is Qualified
1
476.4
Runs Created
452.2
4.3
Runs Created Per 27 Outs
4.1
.087
Walks Per Plate Appearance
.096
0.45
Walk To Strikeout Ratio
0.43
.150
Isolated Power
.139
.263
Secondary Average
.272
3.92
Pitches Per Plate Appearance
3.97
326
Extra Base Hits
289
4229
Plate Appearances
4224
35.1
At Bats Per Home Run
34.2
26
Sacrifice Hit
22
35
Sacrifice Flies
28
Pitching
112
Team Games Played
113
40
Quality Starts
40
59
Wins
57
53
Losses
56
29
Saves
34
67
Holds
87
961
Hits
897
465
Earned runs
418
134
Home Runs
124
327
Walks
367
760
Strikeouts
1041
6.9
Strikeouts Per 9 Innings
9.4
140.6
Pitches Per Start
147.1
1.30
Walks Plus Hits Per Inning Pitched
1.26
4.21
Earned Run Average
3.76
53
Losses
56
993.0
Innings pitched
1001.2
.527
Win Percentage
.504
43
Save Opportunities
45
.253
Opponent Batting Average
.238
.318
Opponent's On-base pct.
.309
.421
Opponent's Slugging pct.
.388
.739
Opponent's OPB Pct + SLG Pct
.698
3792
At Bats
3771
189
Doubles
170
23
Triples
13
44
Batters Hit
39
63
Stolen Bases
81
112
Games Played
113
1
Complete Games
0
5
Shutouts
4
19
Wild Pitches
41
494
Runs Batted In
441
5
Balks
1
993.0
Innings pitched
1001.2
6.9
Strikeouts Per 9 Innings
9.4
16
Caught Stealing
14
112
Games Started
113
0.0
Wins Above Replacement
0.0
1
Is Qualified
1
506
Runs
462
465
Earned Runs
418
1598
Total Bases
1465
Fielding
112
Team Games Played
113
993
Full Innings
1002
4004
Total Chances
3947
2979
Putouts
3005
983
Assists
882
42
Errors
60
194
Double Plays
169
0.990
Fielding Percentage
0.985
35.9
Range Factor
34.9
0.0
Zone Rating
0.0
112
Games Played
113
0
Games Started
0
0.0
Defensive Wins Above Replacement
0.0
1
Qualified
1