

Dodgers vs Braves Live Score (6 Oct, 2026)
Game Information
Stage
QTR
Season
2026
First Pitch
Tue, Oct 6, 6:00 pm
Venue
Truist Park
Location
Atlanta, Georgia
Venue Type
Outdoor
Broadcast
FS1
Attendance
42,420
Live Situation
1Balls
0Strikes
0Outs
—Pitcher
—At Bat
Pitch Sequence
1
BALL
Slider
90 MPH
2
BALL IN PLAY
Slider
89 MPH
Injury Report

Team Stats
 LAD
ATL


3
Runs
1
8
Hits
5
0
Errors
2
2
Home Runs
0
2
Walks
2
12
Strikeouts
12
Player Box Score
Los Angeles Dodgers
| Player | H-AB | AB | R | H | RBI | HR | BB | K | #P | AVG | OBP | SLG |
|---|---|---|---|---|---|---|---|---|---|---|---|---|
 Mookie Betts | 2-5 | 5 | 0 | 2 | 0 | 0 | 0 | 1 | 29 | .300 | .462 | .300 |
 Freddie Freeman | 1-4 | 4 | 1 | 1 | 1 | 1 | 1 | 1 | 19 | .364 | .462 | .909 |
 Teoscar Hernandez | 0-4 | 4 | 0 | 0 | 0 | 0 | 0 | 0 | 11 | .167 | .167 | .417 |
 Max Muncy | 0-1 | 1 | 0 | 0 | 0 | 0 | 0 | 1 | 3 | .250 | .250 | 1.000 |
 Will Smith | 1-4 | 4 | 0 | 1 | 0 | 0 | 0 | 3 | 17 | .083 | .083 | .083 |
 Shohei Ohtani | 0-2 | 2 | 0 | 0 | 0 | 0 | 1 | 1 | 20 | .200 | .273 | .200 |
 Miguel Rojas | 0-3 | 3 | 0 | 0 | 0 | 0 | 0 | 1 | 14 | .250 | .250 | .500 |
 Tommy Edman | 0-1 | 1 | 0 | 0 | 0 | 0 | 0 | 0 | 1 | .000 | .143 | .000 |
 Andy Pages | 2-4 | 4 | 1 | 2 | 0 | 0 | 0 | 1 | 14 | .182 | .250 | .182 |
 Kyle Tucker | 1-4 | 4 | 0 | 1 | 0 | 0 | 0 | 1 | 18 | .333 | .333 | .583 |
 Enrique Hernandez | 1-4 | 4 | 1 | 1 | 2 | 1 | 0 | 2 | 18 | .250 | .250 | 1.000 |
Atlanta Braves
| Player | H-AB | AB | R | H | RBI | HR | BB | K | #P | AVG | OBP | SLG |
|---|---|---|---|---|---|---|---|---|---|---|---|---|
 Drake Baldwin | 0-4 | 4 | 0 | 0 | 1 | 0 | 0 | 2 | 15 | .130 | .231 | .174 |
 Ronald Acuna Jr. | 0-3 | 3 | 0 | 0 | 0 | 0 | 1 | 1 | 16 | .143 | .308 | .143 |
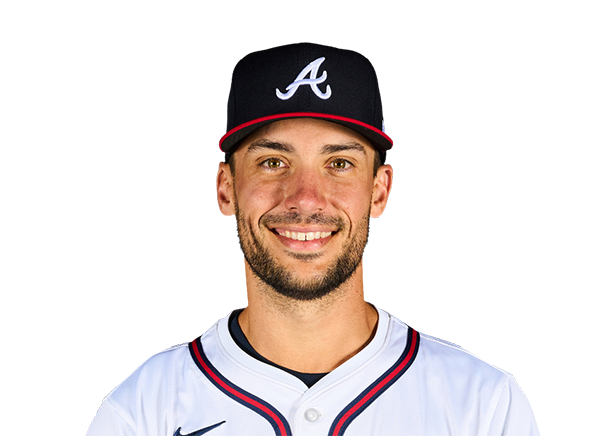 Matt Olson | 1-4 | 4 | 0 | 1 | 0 | 0 | 0 | 2 | 18 | .174 | .231 | .304 |
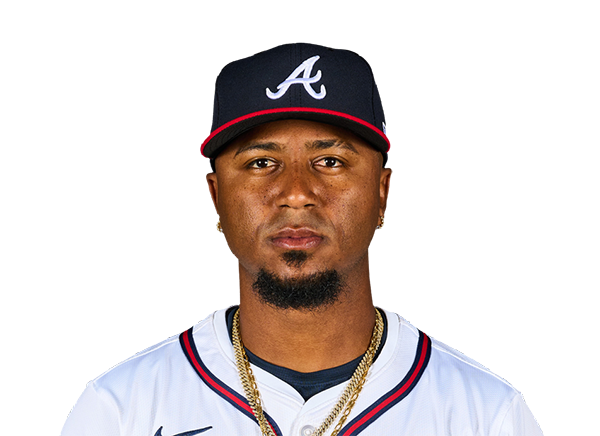 Ozzie Albies | 1-4 | 4 | 0 | 1 | 0 | 0 | 0 | 2 | 14 | .250 | .423 | .700 |
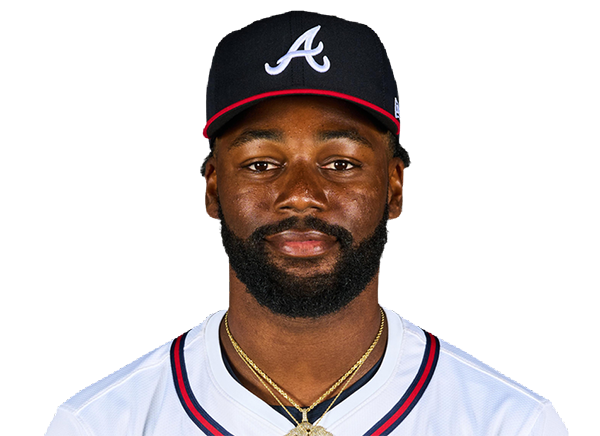 Michael Harris II | 1-4 | 4 | 0 | 1 | 0 | 0 | 0 | 0 | 21 | .375 | .400 | .625 |
 Mauricio Dubon | 1-4 | 4 | 1 | 1 | 0 | 0 | 0 | 0 | 18 | .217 | .280 | .261 |
 Lane Thomas | 1-3 | 3 | 0 | 1 | 0 | 0 | 0 | 2 | 10 | .167 | .167 | .167 |
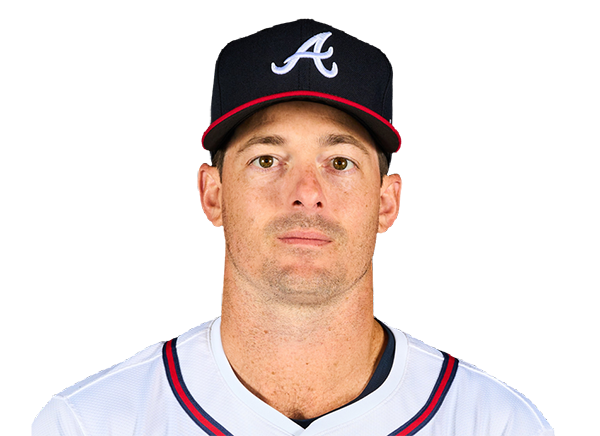 Mike Yastrzemski | 0-1 | 1 | 0 | 0 | 0 | 0 | 0 | 0 | 2 | .091 | .091 | .091 |
 Austin Riley | 0-3 | 3 | 0 | 0 | 0 | 0 | 0 | 2 | 11 | .105 | .292 | .263 |
 Ha-Seong Kim | 0-1 | 1 | 0 | 0 | 0 | 0 | 0 | 0 | 1 | .000 | .286 | .000 |
 Rowdy Tellez | 0-0 | 0 | 0 | 0 | 0 | 0 | 1 | 0 | 4 | .000 | .667 | .000 |
 Brewer Hicklen | 0-1 | 1 | 0 | 0 | 0 | 0 | 0 | 1 | 6 | .000 | .000 | .000 |
Los Angeles Dodgers
| Player | IP | H | R | ER | BB | K | HR | PC-ST | ERA | PC |
|---|---|---|---|---|---|---|---|---|---|---|
 Yoshinobu Yamamoto | 7.0 | 4 | 1 | 1 | 1 | 10 | 0 | 98-62 | 1.29 | 98 |
 Tanner Scott | 1.0 | 0 | 0 | 0 | 1 | 2 | 0 | 19-12 | 10.80 | 19 |
 Edwin Diaz | 1.0 | 1 | 0 | 0 | 0 | 0 | 0 | 19-13 | 0.00 | 19 |
Atlanta Braves
| Player | IP | H | R | ER | BB | K | HR | PC-ST | ERA | PC |
|---|---|---|---|---|---|---|---|---|---|---|
 Chris Sale | 5.0 | 7 | 3 | 3 | 0 | 7 | 2 | 95-62 | 4.26 | 95 |
 Dylan Dodd | 1.0 | 1 | 0 | 0 | 0 | 2 | 0 | 17-11 | 1.93 | 17 |
 Dylan Lee | 1.0 | 0 | 0 | 0 | 0 | 1 | 0 | 9-7 | 5.40 | 9 |
 Brent Suter | 1.0 | 0 | 0 | 0 | 1 | 0 | 0 | 21-12 | 0.00 | 21 |
 Raisel Iglesias | 1.0 | 0 | 0 | 0 | 1 | 2 | 0 | 22-13 | 0.00 | 22 |
H2H / Season Series
ATL1–3
LAD
LAD2–3
ATL
LAD5–3
ATL
ATL1–0
LAD
ATL6–5
LAD
ATL4–3
LAD
LAD2–7
ATL
LAD2–7
ATL
LAD3–1
ATL
Last 5 Games
| Date | Opponent | Result |
|---|---|---|
| Oct 6 | @ ATL | W3–1 |
| Oct 4 | vs ATL | L2–3 |
| Oct 3 | vs ATL | W5–3 |
| Date | Opponent | Result |
|---|---|---|
| Oct 6 | vs LAD | L1–3 |
| Oct 4 | @ LAD | W3–2 |
| Oct 3 | @ LAD | L3–5 |
| Oct 1 |  vs PHI | W6–2 |
| Sep 30 | vs PHI | L3–4 |
Standings
American League
| Team | W | L | PCT | GB | DIFF | STRK |
|---|---|---|---|---|---|---|
1 Rays | 98 | 64 | .605 | - | +86 | L1 |
2 Guardians | 85 | 77 | .525 | 13 | +11 | L1 |
3 Astros | 81 | 81 | .500 | 17 | -32 | W2 |
4 Yankees | 93 | 68 | .578 | 4.5 | +138 | W1 |
5 Red Sox | 87 | 75 | .537 | 11 | +78 | L1 |
6 White Sox | 84 | 78 | .519 | 14 | +56 | W1 |
7 Rangers | 80 | 82 | .494 | 18 | -46 | L1 |
8 Orioles | 79 | 82 | .491 | 18.5 | -21 | L1 |
9 Blue Jays | 79 | 83 | .488 | 19 | -46 | W1 |
10 Twins | 77 | 85 | .475 | 21 | -58 | W1 |
11 Tigers | 76 | 86 | .469 | 22 | +71 | L1 |
12 Mariners | 76 | 86 | .469 | 22 | -58 | W2 |
13 Royals | 69 | 93 | .426 | 29 | -120 | W1 |
14 Athletics | 64 | 98 | .395 | 34 | -238 | L2 |
15 Angels | 62 | 100 | .383 | 36 | -97 | L2 |
National League
| Team | W | L | PCT | GB | DIFF | STRK |
|---|---|---|---|---|---|---|
1 Brewers | 103 | 59 | .636 | - | +214 | W5 |
| 2Dodgers | 100 | 62 | .617 | 3 | +201 | W3 |
| 3Braves | 94 | 68 | .580 | 9 | +116 | L1 |
4 Padres | 91 | 71 | .562 | 12 | +41 | W2 |
5 Cubs | 89 | 73 | .549 | 14 | +147 | W1 |
| 6Phillies | 88 | 74 | .543 | 15 | +15 | W1 |
7 Diamondbacks | 86 | 76 | .531 | 17 | +9 | L2 |
8 Pirates | 82 | 80 | .506 | 21 | +28 | W1 |
9 Marlins | 80 | 82 | .494 | 23 | +3 | W1 |
10 Cardinals | 77 | 85 | .475 | 26 | -29 | L4 |
11 Nationals | 77 | 85 | .475 | 26 | +6 | W1 |
12 Reds | 75 | 87 | .463 | 28 | -160 | L1 |
13 Mets | 74 | 88 | .457 | 29 | -32 | L1 |
14 Giants | 65 | 97 | .401 | 38 | -91 | L5 |
15 Rockies | 58 | 104 | .358 | 45 | -192 | L1 |
LAD
VS
ATL
Pitchers
Yoshinobu Yamamoto
Catchers
Will Smith
Infielders
Mookie Betts
Freddie Freeman
Miguel Rojas
Enrique Hernandez
Outfielders
Teoscar Hernandez
Andy Pages
Kyle Tucker
Designated Hitters
Shohei Ohtani
Pitchers
Chris Sale
Catchers
Drake Baldwin
Infielders
Matt Olson
Ozzie Albies
Austin Riley
Ha-Seong Kim
Outfielders
Michael Harris II
Mauricio Dubon
Lane Thomas
Designated Hitters
Ronald Acuna Jr.
Dodgers
VS
Braves
Batting
3
Team Games Played
6
101
At Bats
189
22
Hits
37
10
Runs Batted In
20
7
Home Runs
6
2
Stolen Bases
3
.218
Batting Average
.196
10
Runs
21
1
Doubles
5
0
Triples
2
44
Total Bases
64
8
Walks
25
30
Strikeouts
55
.275
On Base Percentage
.305
.436
Slugging Percentage
.339
.711
OBP Pct + SLG Pct
.643
3
Games Played
6
3
Games Started
6
0
Hit By Pitch
5
0.0
Wins Above Replacement
0.0
0.0
Offensive Wins Above Replacement
0.0
0
Caught Stealing
0
1
Is Qualified
1
12.9
Runs Created
20.8
4.4
Runs Created Per 27 Outs
3.5
.073
Walks Per Plate Appearance
.112
0.27
Walk To Strikeout Ratio
0.45
.218
Isolated Power
.143
.317
Secondary Average
.291
4.05
Pitches Per Plate Appearance
3.96
8
Extra Base Hits
13
110
Plate Appearances
223
14.4
At Bats Per Home Run
31.5
0
Sacrifice Hit
3
0
Sacrifice Flies
1
Pitching
3
Team Games Played
6
2
Quality Starts
2
2
Wins
3
1
Losses
3
2
Saves
2
1
Holds
2
15
Hits
46
7
Earned runs
19
2
Home Runs
10
13
Walks
12
31
Strikeouts
55
10.3
Strikeouts Per 9 Innings
9.2
154.7
Pitches Per Start
141.7
1.04
Walks Plus Hits Per Inning Pitched
1.07
2.33
Earned Run Average
3.17
1
Losses
3
27.0
Innings pitched
54.0
.667
Win Percentage
.500
2
Save Opportunities
4
.160
Opponent Batting Average
.224
.269
Opponent's On-base pct.
.273
.266
Opponent's Slugging pct.
.415
.534
Opponent's OPB Pct + SLG Pct
.687
94
At Bats
205
2
Doubles
5
1
Triples
2
1
Batters Hit
2
1
Stolen Bases
2
3
Games Played
6
0
Complete Games
0
0
Shutouts
0
1
Wild Pitches
1
6
Runs Batted In
19
0
Balks
0
27.0
Innings pitched
54.0
10.3
Strikeouts Per 9 Innings
9.2
0
Caught Stealing
1
3
Games Started
6
0.0
Wins Above Replacement
0.0
1
Is Qualified
1
7
Runs
19
7
Earned Runs
19
25
Total Bases
85
Fielding
3
Team Games Played
6
243
Full Innings
486
107
Total Chances
208
81
Putouts
162
26
Assists
44
0
Errors
2
3
Double Plays
6
1.000
Fielding Percentage
0.990
4.0
Range Factor
3.8
0.0
Zone Rating
0.0
3
Games Played
6
0
Games Started
0
0.0
Defensive Wins Above Replacement
0.0
1
Qualified
1