

Dodgers vs Brewers Live Score (12 Oct, 2026)
Game Information
Stage
SEMI
Season
2026
First Pitch
Mon, Oct 12, 5:00 pm
Venue
American Family Field
Location
Milwaukee, Wisconsin
Venue Type
Indoor
Broadcast
Fox
Attendance
42,516
Live Situation
2Balls
3Strikes
0Outs
—Pitcher
—At Bat
Pitch Sequence
1
STRIKE LOOKING
Sinker
98 MPH
2
STRIKE SWINGING
Sinker
98 MPH
3
BALL
Sinker
98 MPH
4
BALL
Curve
86 MPH
5
STRIKE SWINGING
Changeup
93 MPH
Injury Report


Team Stats
 LAD
MIL


4
Runs
7
3
Hits
12
2
Errors
2
0
Home Runs
1
2
Walks
6
9
Strikeouts
10
Player Box Score
Los Angeles Dodgers
| Player | H-AB | AB | R | H | RBI | HR | BB | K | #P | AVG | OBP | SLG |
|---|---|---|---|---|---|---|---|---|---|---|---|---|
 Mookie Betts | 1-3 | 3 | 1 | 1 | 0 | 0 | 1 | 1 | 17 | .238 | .385 | .238 |
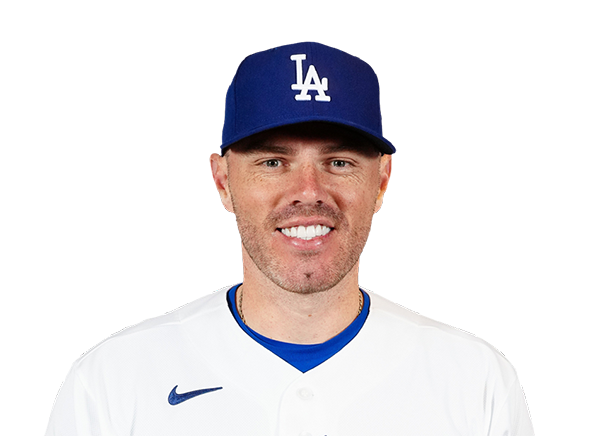 Freddie Freeman | 0-3 | 3 | 0 | 0 | 1 | 0 | 0 | 1 | 11 | .227 | .280 | .500 |
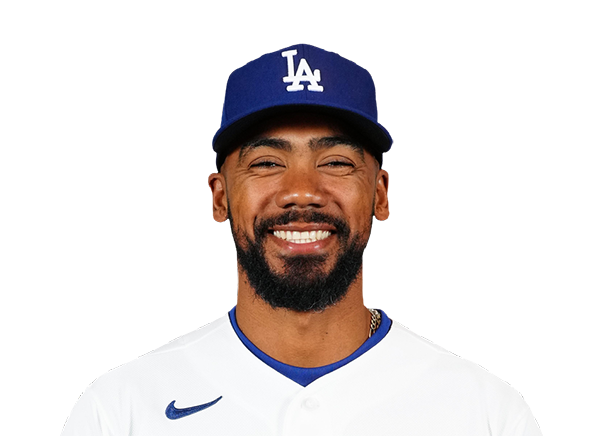 Teoscar Hernandez | 0-3 | 3 | 0 | 0 | 1 | 0 | 0 | 1 | 16 | .217 | .208 | .348 |
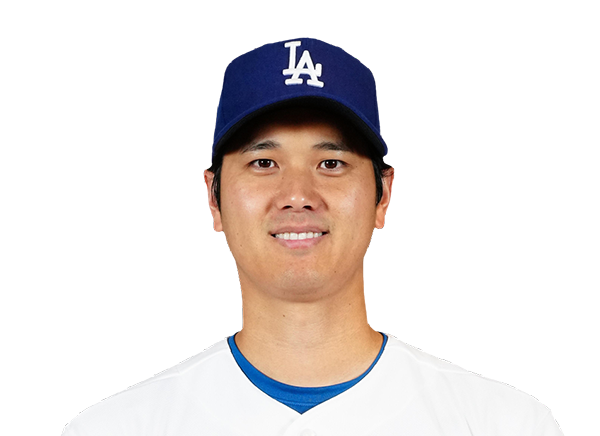 Shohei Ohtani | 0-4 | 4 | 0 | 0 | 0 | 0 | 0 | 2 | 18 | .150 | .261 | .150 |
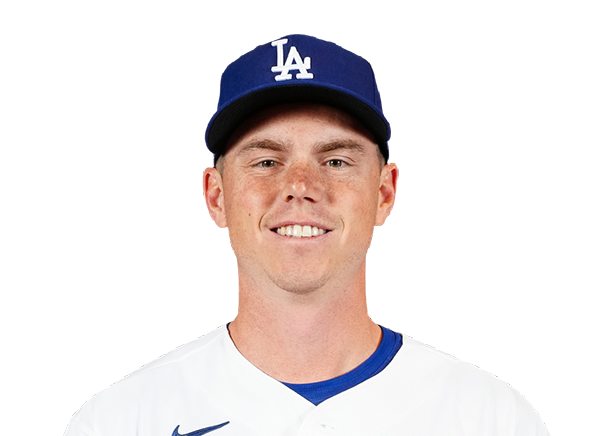 Will Smith | 0-4 | 4 | 0 | 0 | 0 | 0 | 0 | 1 | 18 | .043 | .083 | .043 |
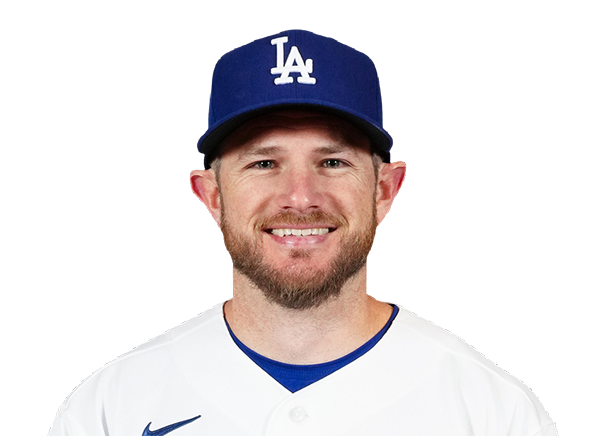 Max Muncy | 0-3 | 3 | 0 | 0 | 0 | 0 | 0 | 1 | 8 | .211 | .211 | .684 |
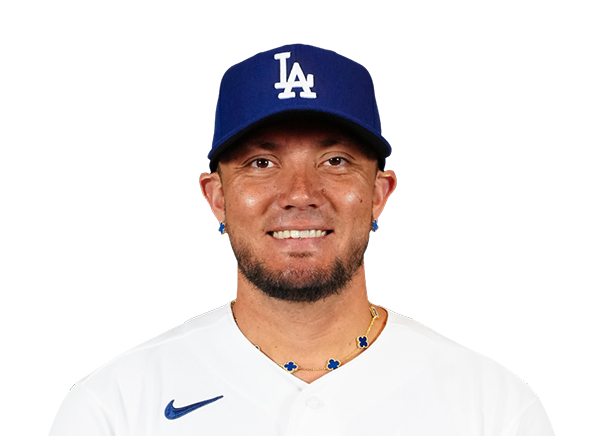 Miguel Rojas | 0-1 | 1 | 0 | 0 | 0 | 0 | 0 | 1 | 5 | .200 | .200 | .400 |
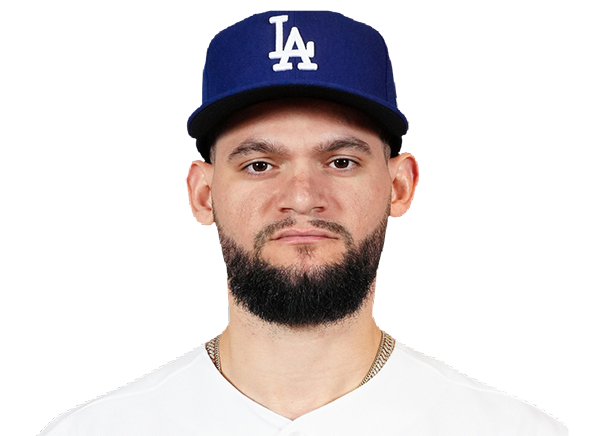 Andy Pages | 0-2 | 2 | 0 | 0 | 0 | 0 | 1 | 1 | 14 | .250 | .318 | .250 |
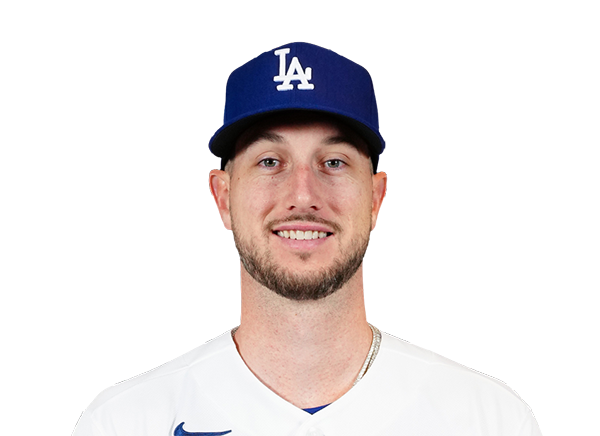 Kyle Tucker | 1-3 | 3 | 1 | 1 | 0 | 0 | 0 | 0 | 13 | .300 | .391 | .500 |
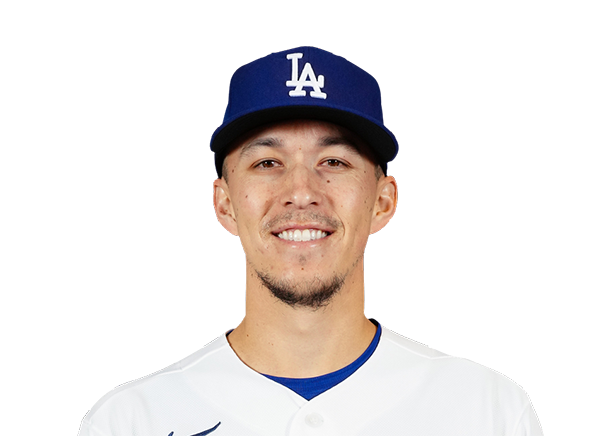 Tommy Edman | 1-2 | 2 | 2 | 1 | 0 | 0 | 0 | 0 | 5 | .111 | .200 | .111 |
Milwaukee Brewers
| Player | H-AB | AB | R | H | RBI | HR | BB | K | #P | AVG | OBP | SLG |
|---|---|---|---|---|---|---|---|---|---|---|---|---|
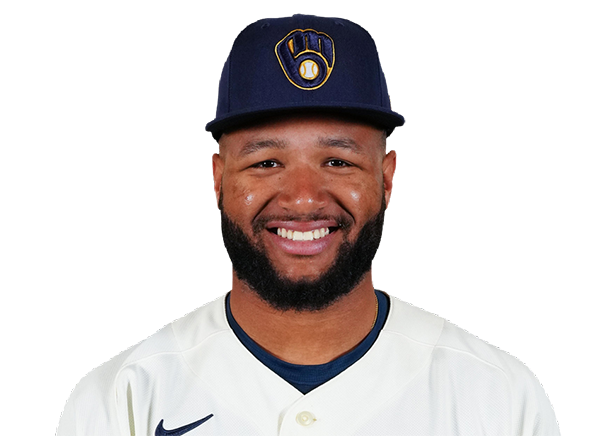 Jackson Chourio | 0-5 | 5 | 0 | 0 | 0 | 0 | 0 | 2 | 17 | .200 | .250 | .320 |
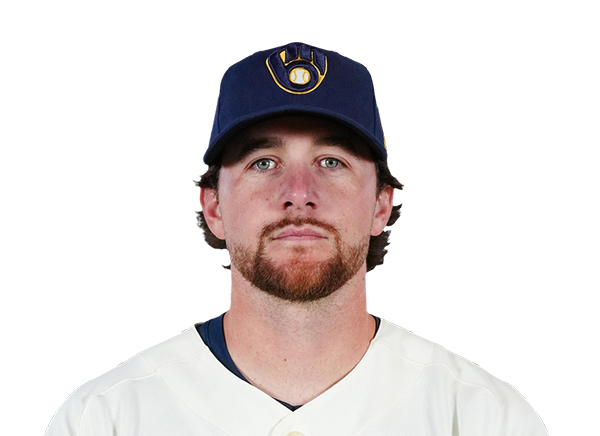 Brice Turang | 2-3 | 3 | 3 | 2 | 1 | 0 | 2 | 1 | 20 | .238 | .385 | .429 |
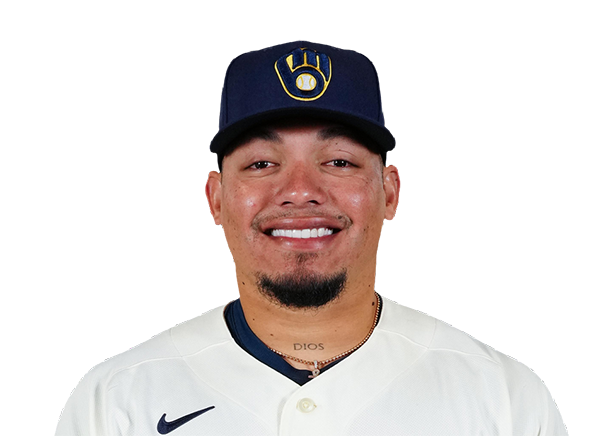 William Contreras | 3-4 | 4 | 1 | 3 | 3 | 1 | 1 | 0 | 19 | .391 | .481 | .783 |
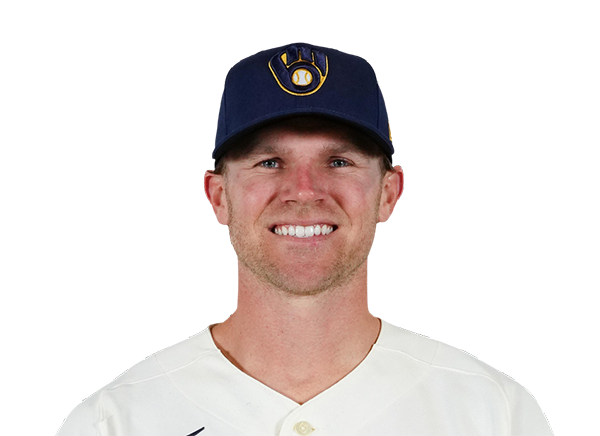 Jake Bauers | 1-4 | 4 | 0 | 1 | 1 | 0 | 1 | 2 | 31 | .263 | .462 | .263 |
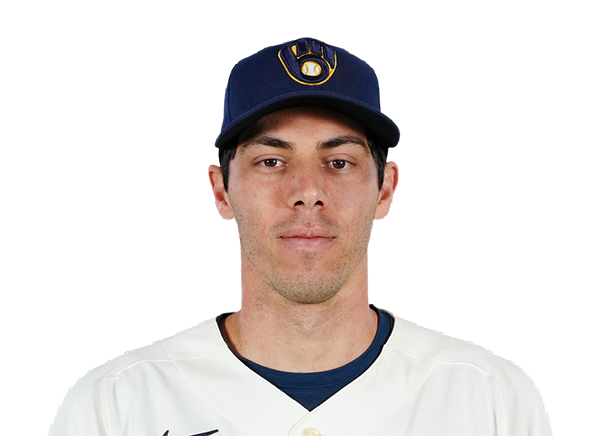 Christian Yelich | 2-5 | 5 | 0 | 2 | 2 | 0 | 0 | 1 | 16 | .368 | .455 | .421 |
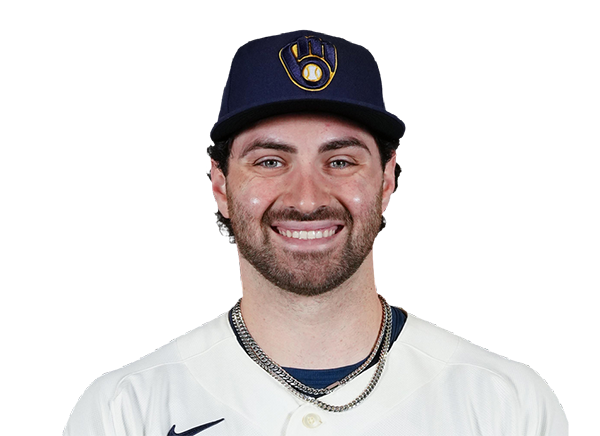 Garrett Mitchell | 0-4 | 4 | 0 | 0 | 0 | 0 | 1 | 3 | 23 | .182 | .280 | .273 |
 Cooper Pratt | 2-4 | 4 | 0 | 2 | 0 | 0 | 0 | 0 | 13 | .286 | .286 | .333 |
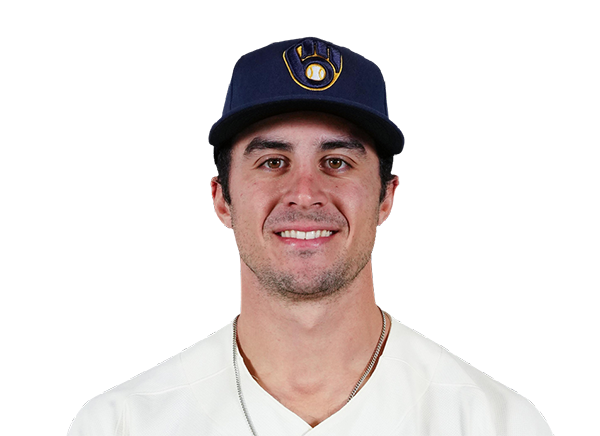 Sal Frelick | 0-3 | 3 | 0 | 0 | 0 | 0 | 1 | 1 | 17 | .250 | .375 | .250 |
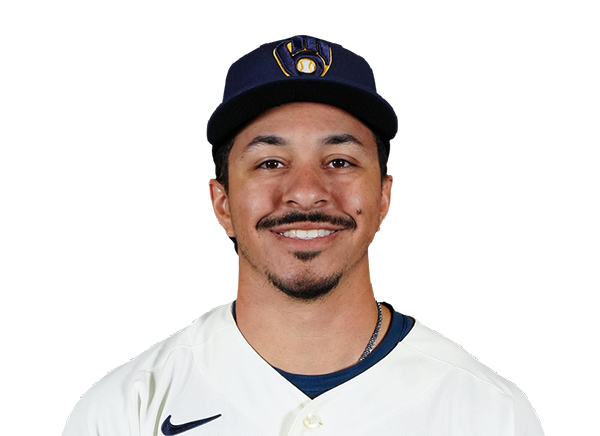 David Hamilton | 2-3 | 3 | 3 | 2 | 0 | 0 | 0 | 0 | 16 | .429 | .500 | .429 |
Los Angeles Dodgers
| Player | IP | H | R | ER | BB | K | HR | PC-ST | ERA | PC |
|---|---|---|---|---|---|---|---|---|---|---|
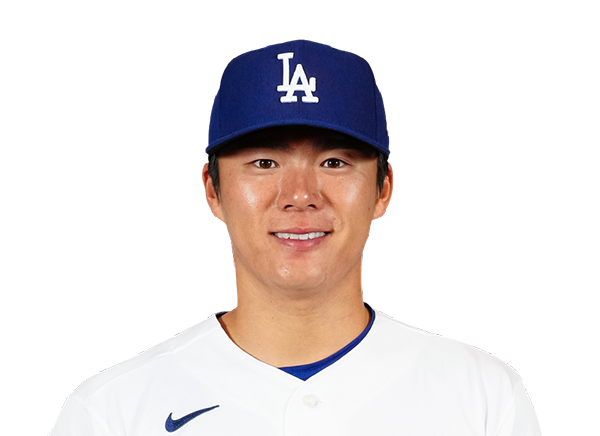 Yoshinobu Yamamoto | 2.2 | 4 | 3 | 3 | 2 | 1 | 0 | 75-46 | 3.72 | 75 |
 Alex Vesia | 0.1 | 0 | 0 | 0 | 0 | 1 | 0 | 4-3 | 0.00 | 4 |
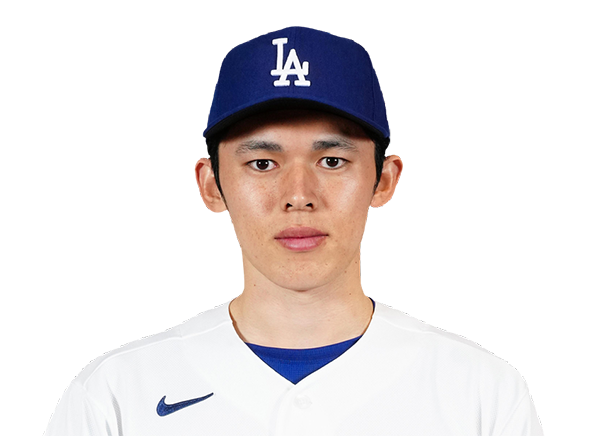 Roki Sasaki | 1.0 | 0 | 0 | 0 | 1 | 1 | 0 | 14-9 | 0.00 | 14 |
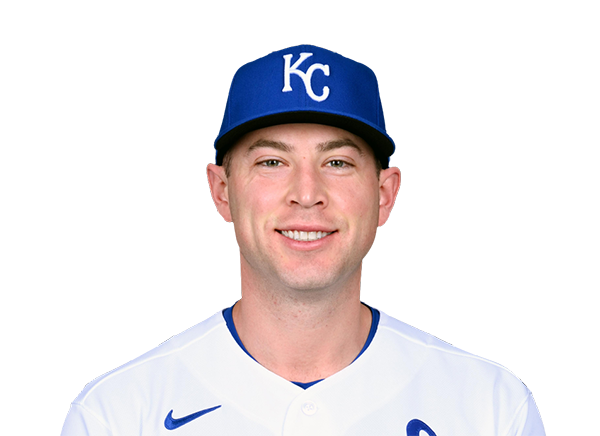 Kris Bubic | 0.2 | 2 | 1 | 1 | 1 | 2 | 1 | 22-12 | 13.50 | 22 |
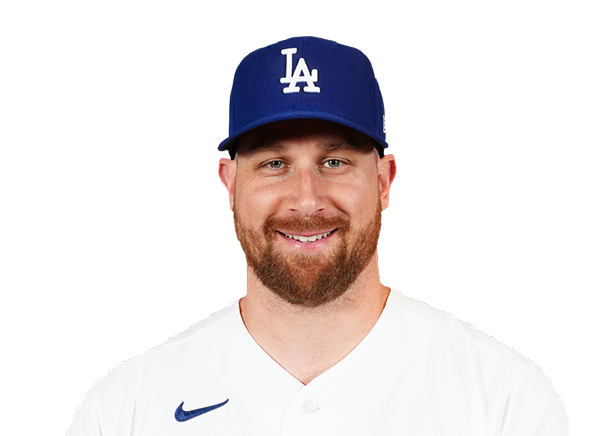 Brock Stewart | 0.2 | 2 | 1 | 1 | 1 | 1 | 0 | 12-9 | 4.50 | 12 |
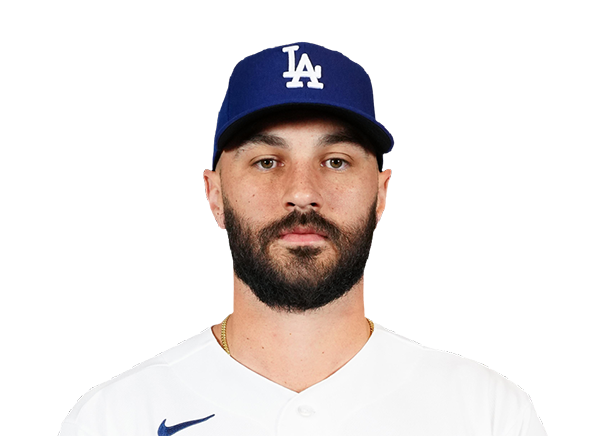 Tanner Scott | 1.0 | 0 | 0 | 0 | 0 | 3 | 0 | 13-9 | 3.86 | 13 |
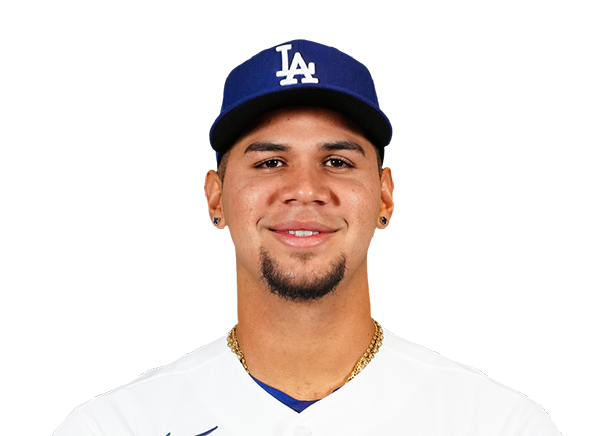 Edgardo Henriquez | 1.0 | 3 | 2 | 2 | 1 | 0 | 0 | 21-14 | 7.36 | 21 |
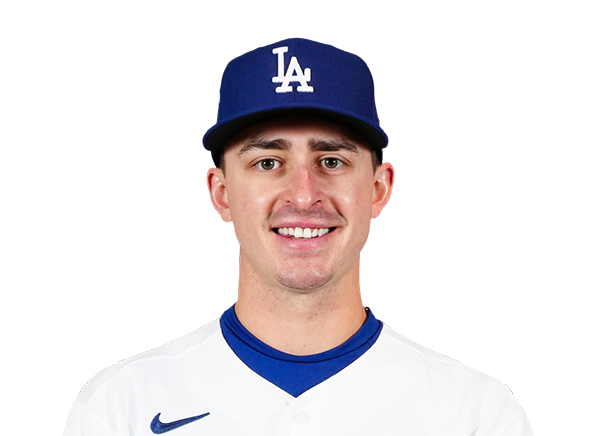 Justin Wrobleski | 0.2 | 1 | 0 | 0 | 0 | 1 | 0 | 11-9 | 0.00 | 11 |
Milwaukee Brewers
| Player | IP | H | R | ER | BB | K | HR | PC-ST | ERA | PC |
|---|---|---|---|---|---|---|---|---|---|---|
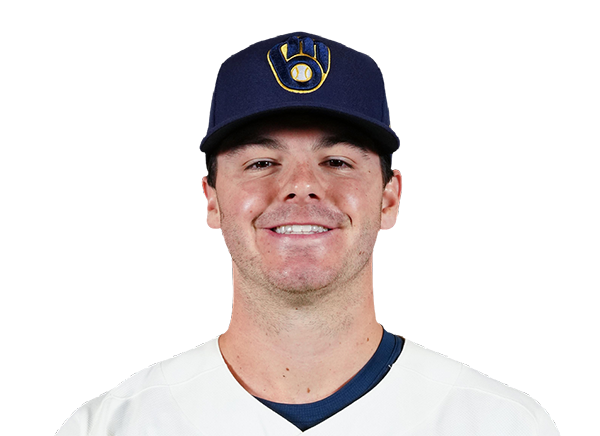 Logan Henderson | 4.0 | 3 | 4 | 2 | 2 | 2 | 0 | 64-44 | 3.00 | 64 |
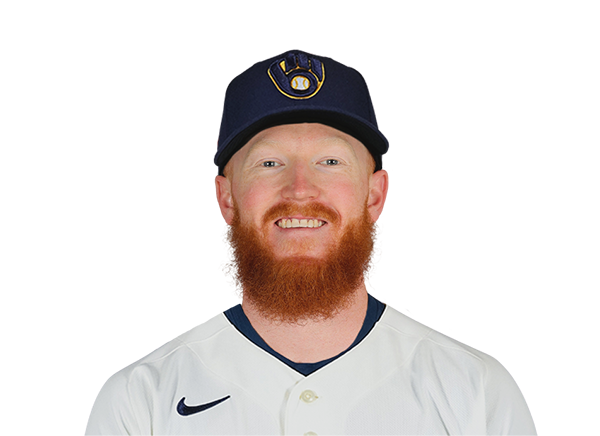 Dustin May | 1.0 | 0 | 0 | 0 | 0 | 1 | 0 | 14-8 | 4.50 | 14 |
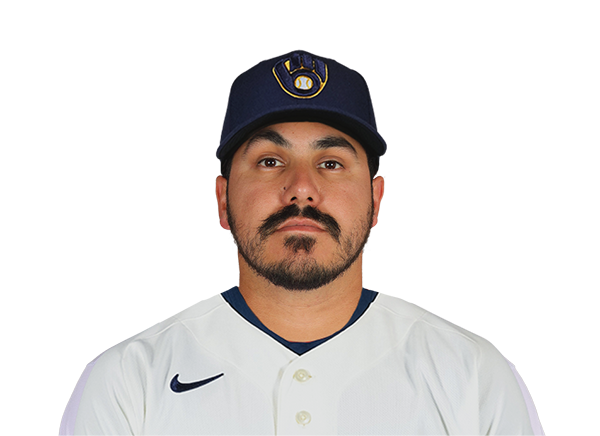 JoJo Romero | 1.0 | 0 | 0 | 0 | 0 | 2 | 0 | 13-9 | 2.70 | 13 |
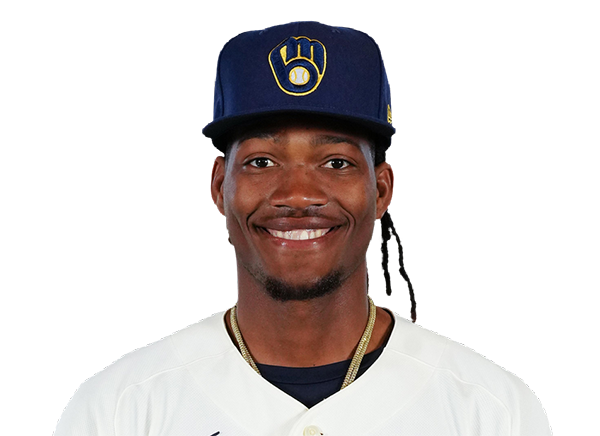 Abner Uribe | 1.1 | 0 | 0 | 0 | 0 | 2 | 0 | 13-9 | 0.00 | 13 |
 Aaron Ashby | 1.2 | 0 | 0 | 0 | 0 | 2 | 0 | 21-14 | 0.00 | 21 |
H2H / Season Series
MIL7–4
LAD
MIL2–1
LAD
LAD2–6
MIL
LAD1–4
MIL
LAD3–1
MIL
LAD4–5
MIL
MIL1–5
LAD
MIL3–11
LAD
MIL5–1
LAD
LAD9–24
MIL
Last 5 Games
| Date | Opponent | Result |
|---|---|---|
| Oct 12 | @ MIL | L4–7 |
| Oct 11 | @ MIL | L1–2 |
| Oct 7 |  @ ATL | W4–1 |
| Oct 6 | @ ATL | W3–1 |
| Oct 4 | vs ATL | L2–3 |
| Date | Opponent | Result |
|---|---|---|
| Oct 12 | vs LAD | W7–4 |
| Oct 11 | vs LAD | W2–1 |
| Oct 7 |  @ SD | W3–1 |
| Oct 6 | @ SD | L3–4 |
| Oct 4 | vs SD | W4–3 |
Standings
American League
| Team | W | L | PCT | GB | DIFF | STRK |
|---|---|---|---|---|---|---|
1 Rays | 98 | 64 | .605 | - | +86 | L1 |
2 Guardians | 85 | 77 | .525 | 13 | +11 | L1 |
3 Astros | 81 | 81 | .500 | 17 | -32 | W2 |
4 Yankees | 93 | 68 | .578 | 4.5 | +138 | W1 |
5 Red Sox | 87 | 75 | .537 | 11 | +78 | L1 |
6 White Sox | 84 | 78 | .519 | 14 | +56 | W1 |
7 Rangers | 80 | 82 | .494 | 18 | -46 | L1 |
8 Orioles | 79 | 82 | .491 | 18.5 | -21 | L1 |
9 Blue Jays | 79 | 83 | .488 | 19 | -46 | W1 |
10 Twins | 77 | 85 | .475 | 21 | -58 | W1 |
11 Tigers | 76 | 86 | .469 | 22 | +71 | L1 |
12 Mariners | 76 | 86 | .469 | 22 | -58 | W2 |
13 Royals | 69 | 93 | .426 | 29 | -120 | W1 |
14 Athletics | 64 | 98 | .395 | 34 | -238 | L2 |
15 Angels | 62 | 100 | .383 | 36 | -97 | L2 |
National League
| Team | W | L | PCT | GB | DIFF | STRK |
|---|---|---|---|---|---|---|
| 1Brewers | 103 | 59 | .636 | - | +214 | W5 |
| 2Dodgers | 100 | 62 | .617 | 3 | +201 | W3 |
| 3Braves | 94 | 68 | .580 | 9 | +116 | L1 |
| 4Padres | 91 | 71 | .562 | 12 | +41 | W2 |
5 Cubs | 89 | 73 | .549 | 14 | +147 | W1 |
6 Phillies | 88 | 74 | .543 | 15 | +15 | W1 |
7 Diamondbacks | 86 | 76 | .531 | 17 | +9 | L2 |
8 Pirates | 82 | 80 | .506 | 21 | +28 | W1 |
9 Marlins | 80 | 82 | .494 | 23 | +3 | W1 |
10 Cardinals | 77 | 85 | .475 | 26 | -29 | L4 |
11 Nationals | 77 | 85 | .475 | 26 | +6 | W1 |
12 Reds | 75 | 87 | .463 | 28 | -160 | L1 |
13 Mets | 74 | 88 | .457 | 29 | -32 | L1 |
14 Giants | 65 | 97 | .401 | 38 | -91 | L5 |
15 Rockies | 58 | 104 | .358 | 45 | -192 | L1 |
LAD
VS
MIL
Pitchers
Yoshinobu Yamamoto
Catchers
Will Smith
Infielders
Mookie Betts
Freddie Freeman
Max Muncy
Tommy Edman
Outfielders
Teoscar Hernandez
Andy Pages
Kyle Tucker
Designated Hitters
Shohei Ohtani
Pitchers
Logan Henderson
Catchers
William Contreras
Infielders
Brice Turang
Jake Bauers
Cooper Pratt
David Hamilton
Outfielders
Jackson Chourio
Garrett Mitchell
Sal Frelick
Designated Hitters
Christian Yelich
Dodgers
VS
Brewers
Batting
6
Team Games Played
6
192
At Bats
193
37
Hits
51
16
Runs Batted In
21
8
Home Runs
5
3
Stolen Bases
7
.193
Batting Average
.264
19
Runs
22
2
Doubles
4
0
Triples
1
63
Total Bases
72
19
Walks
27
52
Strikeouts
49
.263
On Base Percentage
.363
.328
Slugging Percentage
.373
.591
OBP Pct + SLG Pct
.736
6
Games Played
6
6
Games Started
6
0
Hit By Pitch
4
0.0
Wins Above Replacement
0.0
0.0
Offensive Wins Above Replacement
0.0
0
Caught Stealing
2
1
Is Qualified
1
16.5
Runs Created
28.5
2.7
Runs Created Per 27 Outs
5.0
.088
Walks Per Plate Appearance
.118
0.37
Walk To Strikeout Ratio
0.55
.135
Isolated Power
.109
.250
Secondary Average
.275
4.04
Pitches Per Plate Appearance
3.87
10
Extra Base Hits
10
215
Plate Appearances
229
24.0
At Bats Per Home Run
38.6
1
Sacrifice Hit
3
2
Sacrifice Flies
2
Pitching
6
Team Games Played
6
2
Quality Starts
0
3
Wins
5
3
Losses
1
3
Saves
4
2
Holds
4
36
Hits
33
17
Earned runs
10
4
Home Runs
2
29
Walks
23
62
Strikeouts
49
10.7
Strikeouts Per 9 Innings
8.3
147.0
Pitches Per Start
141.7
1.25
Walks Plus Hits Per Inning Pitched
1.06
2.94
Earned Run Average
1.70
3
Losses
1
52.0
Innings pitched
53.0
.500
Win Percentage
.833
4
Save Opportunities
4
.195
Opponent Batting Average
.177
.310
Opponent's On-base pct.
.272
.303
Opponent's Slugging pct.
.220
.613
Opponent's OPB Pct + SLG Pct
.493
185
At Bats
186
6
Doubles
2
1
Triples
0
2
Batters Hit
2
4
Stolen Bases
2
6
Games Played
6
0
Complete Games
0
0
Shutouts
0
2
Wild Pitches
5
15
Runs Batted In
12
0
Balks
1
52.0
Innings pitched
53.0
10.7
Strikeouts Per 9 Innings
8.3
2
Caught Stealing
2
6
Games Started
6
0.0
Wins Above Replacement
0.0
1
Is Qualified
1
17
Runs
15
17
Earned Runs
10
56
Total Bases
41
Fielding
6
Team Games Played
6
468
Full Innings
477
211
Total Chances
217
156
Putouts
159
53
Assists
51
2
Errors
7
6
Double Plays
18
0.991
Fielding Percentage
0.968
4.0
Range Factor
4.0
0.0
Zone Rating
0.0
6
Games Played
6
0
Games Started
0
0.0
Defensive Wins Above Replacement
0.0
1
Qualified
1