

Dodgers vs Diamondbacks Live Score (5 Jun, 2026)
Game Information
Stage
Standard
Season
2026
First Pitch
Thu, Jun 4, 9:40 pm
Venue
Chase Field
Location
Phoenix, Arizona
Attendance
41,999
Live Situation
0Balls
0Strikes
0Outs
—Pitcher
—At Bat
Pitch Sequence
1
BALL IN PLAY
Four-seam FB
97 MPH
Injury Report
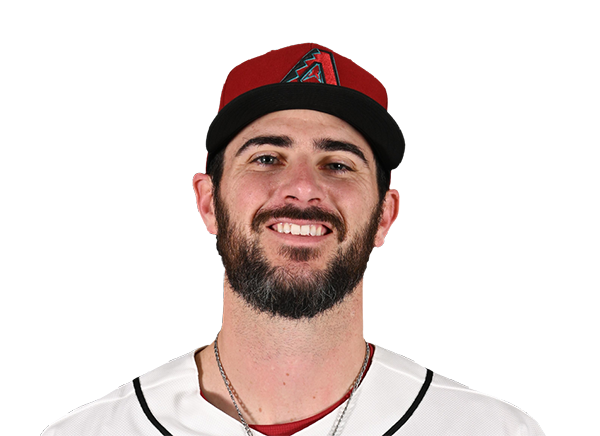


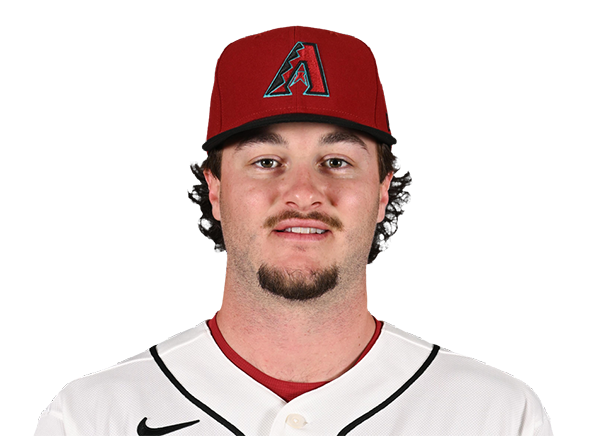
Team Stats
 LAD
ARI

2
Runs
3
6
Hits
11
0
Errors
0
0
Home Runs
2
2
Walks
1
5
Strikeouts
8
Player Box Score
Los Angeles Dodgers
| Player | H-AB | AB | R | H | RBI | HR | BB | K | #P | AVG | OBP | SLG |
|---|---|---|---|---|---|---|---|---|---|---|---|---|
 Mookie Betts |
0-4 | 4 | 0 | 0 | 0 | 0 | 0 | 0 | 11 | .183 | .246 | .365 |
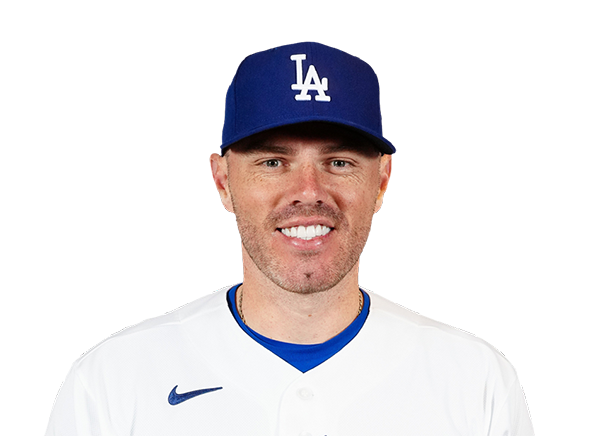 Freddie Freeman |
0-4 | 4 | 0 | 0 | 0 | 0 | 0 | 0 | 11 | .271 | .354 | .463 |
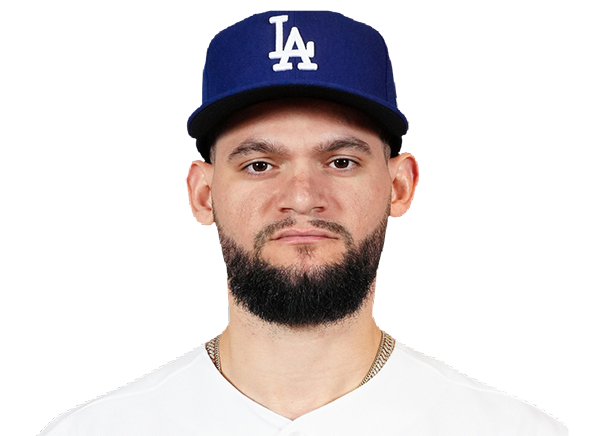 Andy Pages |
0-4 | 4 | 0 | 0 | 0 | 0 | 0 | 1 | 16 | .286 | .333 | .521 |
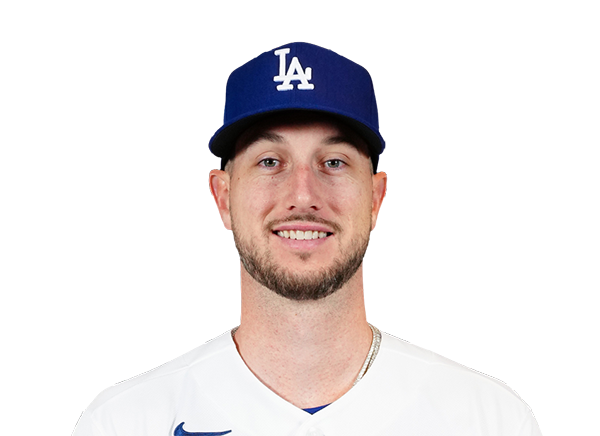 Kyle Tucker |
1-4 | 4 | 0 | 1 | 0 | 0 | 0 | 1 | 13 | .243 | .339 | .396 |
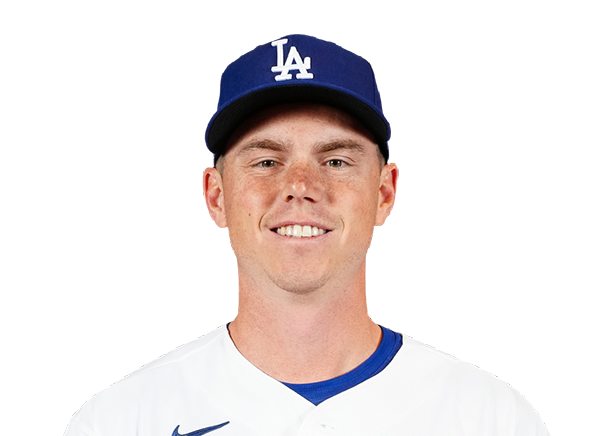 Will Smith |
1-3 | 3 | 0 | 1 | 0 | 0 | 1 | 0 | 18 | .251 | .338 | .386 |
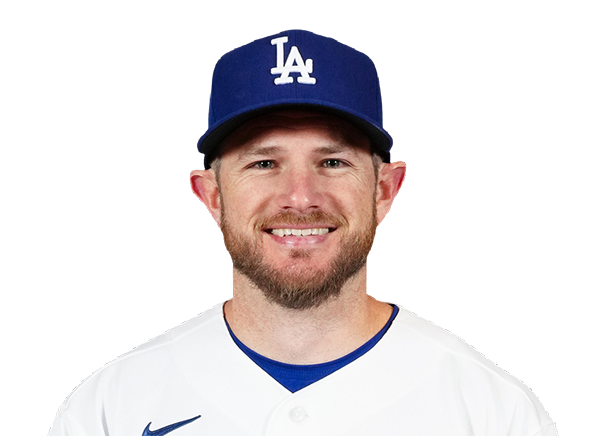 Max Muncy |
1-2 | 2 | 0 | 1 | 0 | 0 | 0 | 0 | 6 | .254 | .347 | .513 |
 Santiago Espinal |
1-2 | 2 | 1 | 1 | 0 | 0 | 0 | 1 | 6 | .222 | .234 | .356 |
 Ryan Ward |
1-2 | 2 | 1 | 1 | 1 | 0 | 1 | 0 | 14 | .286 | .333 | .571 |
 Alex Call |
0-0 | 0 | 0 | 0 | 0 | 0 | 0 | 0 | 0 | .288 | .400 | .364 |
 Dalton Rushing |
1-3 | 3 | 0 | 1 | 1 | 0 | 0 | 2 | 16 | .266 | .343 | .521 |
 Alex Freeland |
0-2 | 2 | 0 | 0 | 0 | 0 | 0 | 0 | 2 | .250 | .323 | .371 |
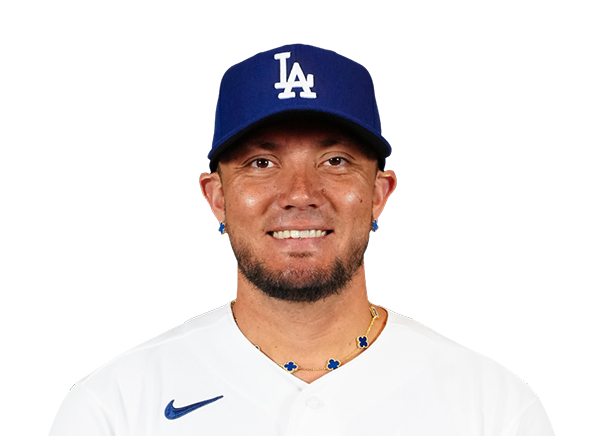 Miguel Rojas |
0-1 | 1 | 0 | 0 | 0 | 0 | 0 | 0 | 2 | .258 | .313 | .337 |
Arizona Diamondbacks
| Player | H-AB | AB | R | H | RBI | HR | BB | K | #P | AVG | OBP | SLG |
|---|---|---|---|---|---|---|---|---|---|---|---|---|
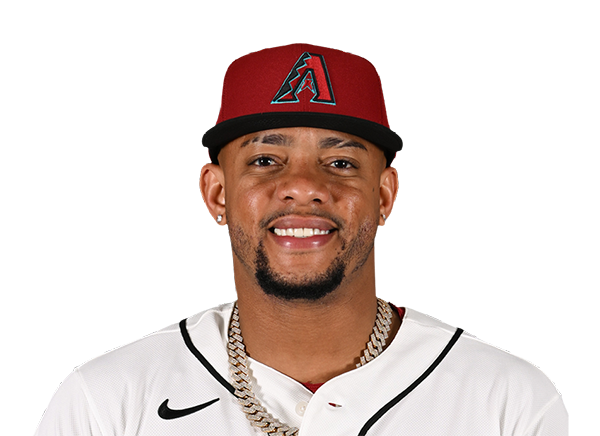 Ketel Marte |
1-5 | 5 | 1 | 1 | 1 | 1 | 0 | 2 | 15 | .258 | .313 | .464 |
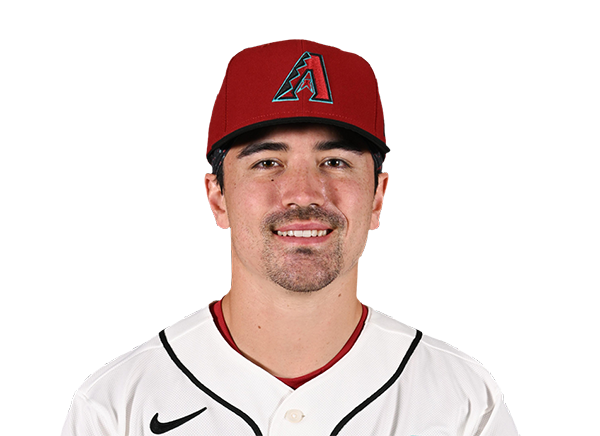 Corbin Carroll |
3-4 | 4 | 1 | 3 | 1 | 1 | 0 | 0 | 13 | .292 | .379 | .557 |
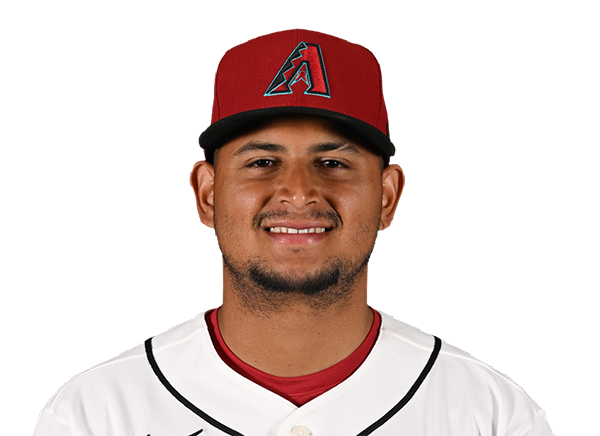 Gabriel Moreno |
0-3 | 3 | 1 | 0 | 0 | 0 | 1 | 0 | 15 | .254 | .324 | .392 |
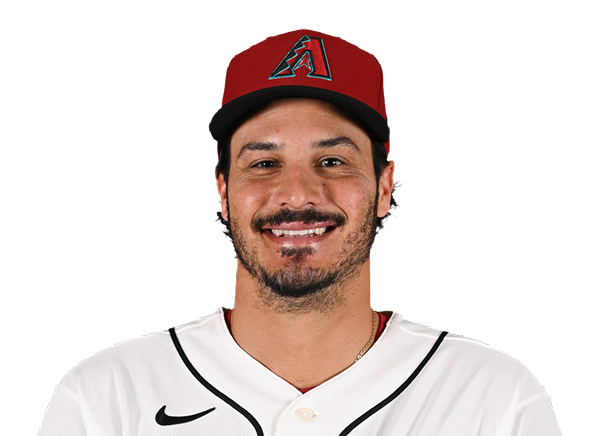 Nolan Arenado |
1-4 | 4 | 0 | 1 | 0 | 0 | 0 | 1 | 15 | .263 | .343 | .453 |
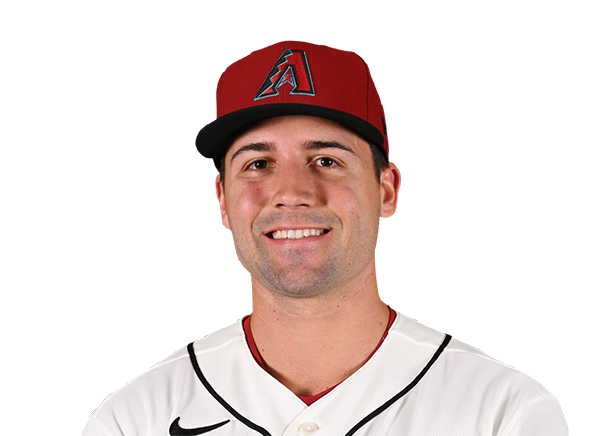 Ryan Waldschmidt |
2-4 | 4 | 0 | 2 | 0 | 0 | 0 | 2 | 15 | .291 | .344 | .384 |
 Ildemaro Vargas |
0-2 | 2 | 0 | 0 | 0 | 0 | 0 | 0 | 8 | .283 | .311 | .443 |
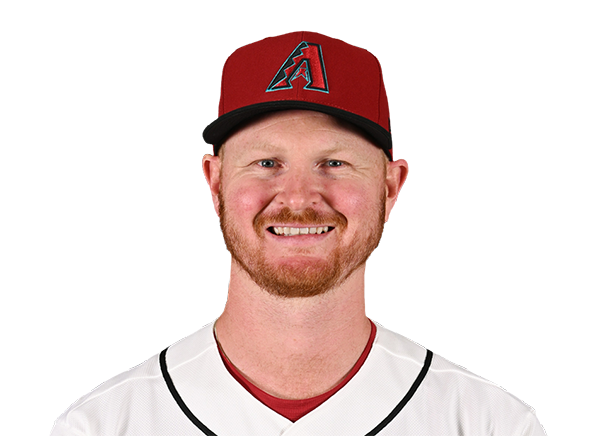 Pavin Smith |
0-1 | 1 | 0 | 0 | 0 | 0 | 0 | 0 | 3 | .077 | .250 | .077 |
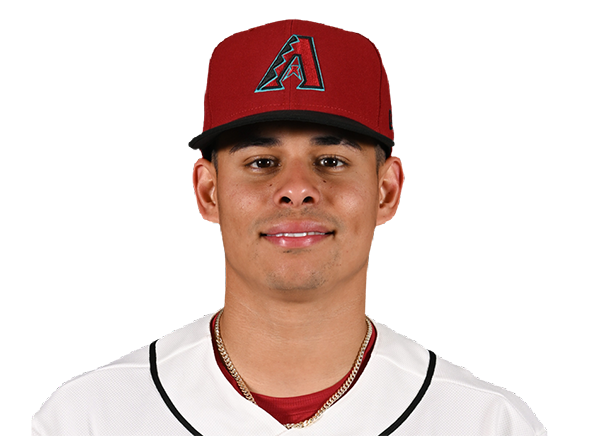 Jorge Barrosa |
0-1 | 1 | 0 | 0 | 0 | 0 | 0 | 0 | 3 | .174 | .248 | .326 |
|
Adrian Del Castillo
|
0-0 | 0 | 0 | 0 | 0 | 0 | 0 | 0 | 0 | .192 | .252 | .325 |
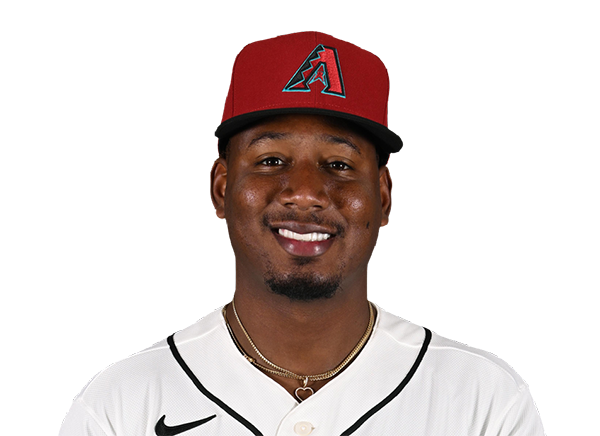 Geraldo Perdomo |
2-4 | 4 | 0 | 2 | 1 | 0 | 0 | 0 | 16 | .230 | .333 | .348 |
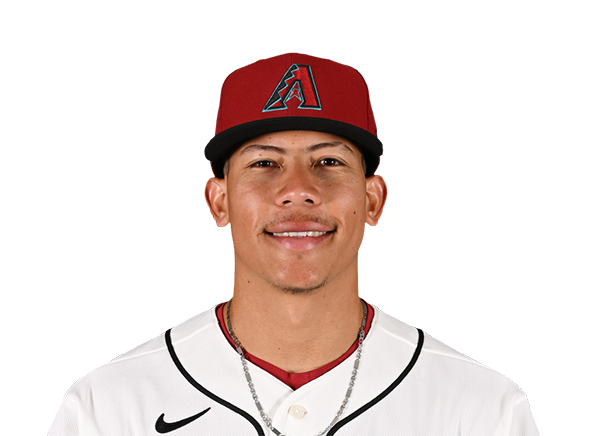 Jose Fernandez |
1-4 | 4 | 0 | 1 | 0 | 0 | 0 | 1 | 14 | .255 | .289 | .352 |
 Tommy Troy |
1-4 | 4 | 0 | 1 | 0 | 0 | 0 | 2 | 18 | .281 | .361 | .438 |
Los Angeles Dodgers
| Player | IP | H | R | ER | BB | K | HR | PC-ST | ERA | PC |
|---|---|---|---|---|---|---|---|---|---|---|
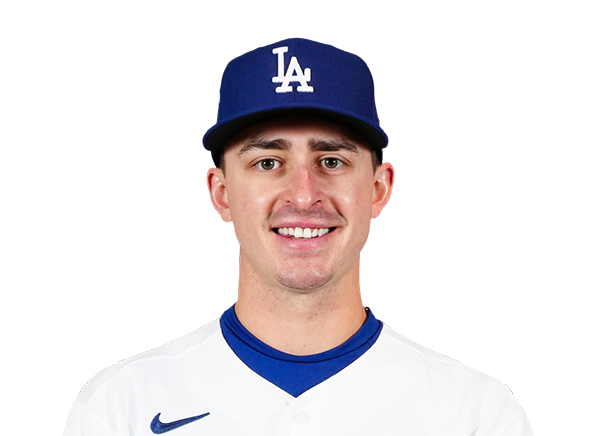 Justin Wrobleski |
6.0 | 6 | 0 | 0 | 0 | 4 | 0 | 84-61 | 2.62 | 84 |
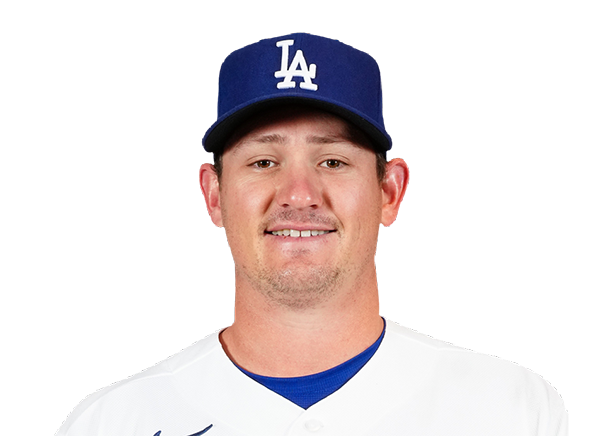 Kyle Hurt |
1.0 | 1 | 0 | 0 | 0 | 2 | 0 | 15-9 | 2.29 | 15 |
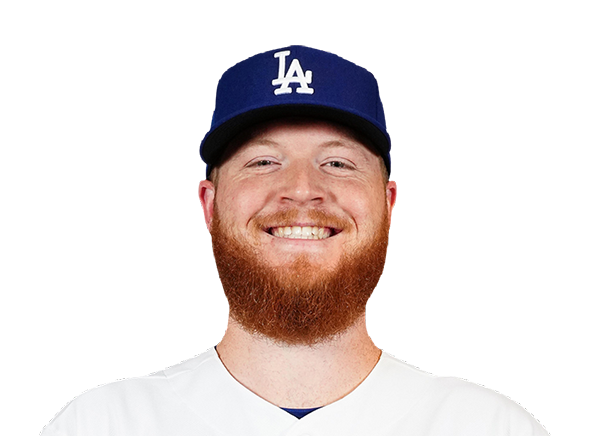 Will Klein |
0.1 | 2 | 2 | 2 | 1 | 1 | 1 | 16-7 | 2.45 | 16 |
 Alex Vesia |
0.2 | 1 | 0 | 0 | 0 | 0 | 0 | 12-8 | 2.14 | 12 |
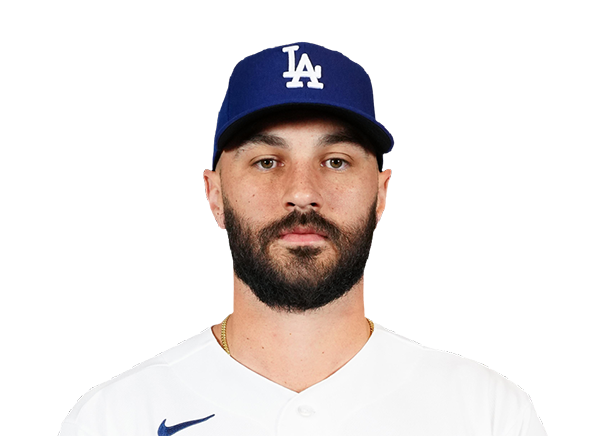 Tanner Scott |
0.1 | 1 | 1 | 1 | 0 | 1 | 1 | 8-6 | 2.42 | 8 |
Arizona Diamondbacks
| Player | IP | H | R | ER | BB | K | HR | PC-ST | ERA | PC |
|---|---|---|---|---|---|---|---|---|---|---|
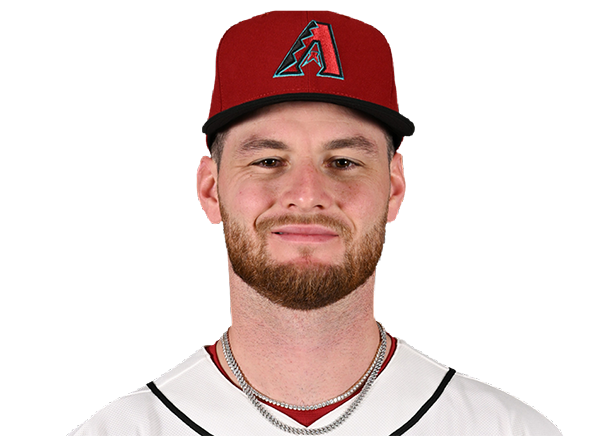 Ryne Nelson |
7.0 | 5 | 2 | 2 | 2 | 3 | 0 | 94-62 | 4.60 | 94 |
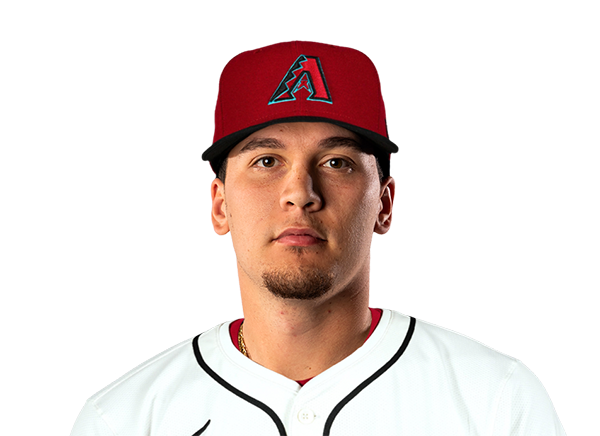 Brandyn Garcia |
1.0 | 0 | 0 | 0 | 0 | 0 | 0 | 7-5 | 0.69 | 7 |
 Paul Sewald |
1.0 | 1 | 0 | 0 | 0 | 2 | 0 | 14-9 | 3.47 | 14 |
H2H / Season Series
ARI4–2
LAD
ARI1–2
LAD
ARI4–3
LAD
LAD3–5
ARI
LAD2–9
ARI
LAD3–9
ARI
ARI3–2
LAD
ARI0–7
LAD
ARI5–6
LAD
ARI4–1
LAD
Last 5 Games
| Date | Opponent | Result |
|---|---|---|
| Aug 22 |  vs PIT | W4–3 |
| Aug 21 | vs PIT | W5–4 |
| Aug 19 |  @ COL | W6–4 |
| Aug 18 | @ COL | W7–6 |
| Aug 17 | @ COL | W11–5 |
| Date | Opponent | Result |
|---|---|---|
| Aug 22 |  vs CIN | L5–11 |
| Aug 21 | vs CIN | W9–0 |
| Aug 19 |  @ BOS | W7–6 |
| Aug 18 | @ BOS | L4–9 |
| Aug 17 | @ BOS | L1–11 |
Standings
American League
| Team | W | L | PCT | GB | DIFF | STRK |
|---|---|---|---|---|---|---|
1 Rays | 76 | 53 | .589 | - | +42 | L3 |
2 White Sox | 67 | 62 | .519 | 9 | +42 | L1 |
3 Astros | 65 | 65 | .500 | 11.5 | -43 | L1 |
4 Yankees | 73 | 56 | .566 | 3 | +95 | L1 |
| 5Red Sox | 70 | 59 | .543 | 6 | +98 | W2 |
6 Rangers | 64 | 66 | .492 | 12.5 | -48 | L1 |
7 Guardians | 64 | 66 | .492 | 12.5 | -14 | W3 |
8 Blue Jays | 64 | 67 | .489 | 13 | -50 | W1 |
9 Twins | 63 | 67 | .485 | 13.5 | -47 | L2 |
10 Orioles | 63 | 67 | .485 | 13.5 | -33 | W2 |
11 Mariners | 62 | 68 | .477 | 14.5 | -44 | W2 |
12 Tigers | 61 | 68 | .473 | 15 | +77 | L4 |
13 Royals | 57 | 74 | .435 | 20 | -95 | W7 |
14 Angels | 52 | 78 | .400 | 24.5 | -68 | W1 |
15 Athletics | 50 | 80 | .385 | 26.5 | -188 | W1 |
National League
| Team | W | L | PCT | GB | DIFF | STRK |
|---|---|---|---|---|---|---|
1 Brewers | 81 | 49 | .623 | - | +163 | W3 |
| 2Dodgers | 79 | 51 | .608 | 2 | +147 | W5 |
3 Braves | 75 | 55 | .577 | 6 | +108 | L2 |
4 Cubs | 74 | 56 | .569 | 7 | +98 | L3 |
5 Phillies | 72 | 58 | .554 | 9 | +25 | W8 |
6 Padres | 70 | 60 | .538 | 11 | +9 | W2 |
| 7Diamondbacks | 68 | 62 | .523 | 13 | +7 | L1 |
8 Marlins | 66 | 64 | .508 | 15 | +17 | W2 |
9 Cardinals | 66 | 65 | .504 | 15.5 | 0 | L2 |
| 10Pirates | 63 | 68 | .481 | 18.5 | +29 | L2 |
| 11Reds | 62 | 68 | .477 | 19 | -92 | W1 |
12 Nationals | 61 | 70 | .466 | 20.5 | +14 | L3 |
13 Mets | 59 | 71 | .454 | 22 | -39 | W1 |
14 Giants | 52 | 77 | .403 | 28.5 | -79 | L3 |
| 15Rockies | 50 | 79 | .388 | 30.5 | -131 | L5 |
LAD
VS
ARI
Pitchers
Justin Wrobleski
Kyle Hurt
Will Klein
Alex Vesia
Tanner Scott
Catchers
Dalton Rushing
Infielders
Mookie Betts
Freddie Freeman
Max Muncy
Santiago Espinal
Alex Freeland
Miguel Rojas
Outfielders
Andy Pages
Kyle Tucker
Ryan Ward
Alex Call
Designated Hitters
Will Smith
Pitchers
Ryne Nelson
Brandyn Garcia
Paul Sewald
Catchers
Gabriel Moreno
Infielders
Ketel Marte
Nolan Arenado
Ildemaro Vargas
Pavin Smith
Adrian Del Castillo
Geraldo Perdomo
Outfielders
Corbin Carroll
Ryan Waldschmidt
Tommy Troy
Designated Hitters
Jose Fernandez
Other Players
Jorge Barrosa
Dodgers
VS
Diamondbacks
Batting
130
Team Games Played
130
4385
At Bats
4369
1134
Hits
1069
614
Runs Batted In
565
167
Home Runs
129
51
Stolen Bases
89
.259
Batting Average
.245
649
Runs
593
213
Doubles
226
14
Triples
33
1876
Total Bases
1748
481
Walks
439
1024
Strikeouts
944
.335
On Base Percentage
.318
.428
Slugging Percentage
.400
.763
OBP Pct + SLG Pct
.718
130
Games Played
130
0
Games Started
0
45
Hit By Pitch
47
0.0
Wins Above Replacement
0.0
0.0
Offensive Wins Above Replacement
0.0
18
Caught Stealing
20
1
Is Qualified
1
630.6
Runs Created
573.6
5.0
Runs Created Per 27 Outs
4.5
.097
Walks Per Plate Appearance
.089
0.47
Walk To Strikeout Ratio
0.47
.169
Isolated Power
.155
.286
Secondary Average
.272
3.93
Pitches Per Plate Appearance
3.94
394
Extra Base Hits
388
4968
Plate Appearances
4930
26.3
At Bats Per Home Run
33.9
12
Sacrifice Hit
32
42
Sacrifice Flies
40
Pitching
130
Team Games Played
130
69
Quality Starts
47
79
Wins
68
51
Losses
62
37
Saves
31
86
Holds
71
934
Hits
1111
473
Earned runs
538
148
Home Runs
153
404
Walks
381
1183
Strikeouts
881
9.2
Strikeouts Per 9 Innings
6.9
0.0
Pitches Per Start
0.0
1.16
Walks Plus Hits Per Inning Pitched
1.29
3.70
Earned Run Average
4.20
51
Losses
62
1151.2
Innings pitched
1154.0
.608
Win Percentage
.523
56
Save Opportunities
46
.218
Opponent Batting Average
.253
.293
Opponent's On-base pct.
.317
.371
Opponent's Slugging pct.
.419
.664
Opponent's OPB Pct + SLG Pct
.736
4281
At Bats
4399
189
Doubles
220
11
Triples
26
55
Batters Hit
50
76
Stolen Bases
76
130
Games Played
130
1
Complete Games
1
0
Shutouts
0
30
Wild Pitches
26
0
Runs Batted In
0
6
Balks
7
1151.2
Innings pitched
1154.0
9.2
Strikeouts Per 9 Innings
6.9
20
Caught Stealing
17
130
Games Started
130
0.0
Wins Above Replacement
0.0
1
Is Qualified
1
502
Runs
586
470
Earned Runs
527
1589
Total Bases
1842
Fielding
130
Team Games Played
130
1152
Full Innings
1154
4560
Total Chances
4641
3455
Putouts
3462
1053
Assists
1131
52
Errors
48
213
Double Plays
226
0.989
Fielding Percentage
0.990
35.2
Range Factor
35.8
0.0
Zone Rating
0.0
130
Games Played
130
0
Games Started
0
0.0
Defensive Wins Above Replacement
0.0
1
Qualified
1