

Dodgers vs Reds Live Score (15 Sep, 2026)
Game Information
Stage
STD
Season
2026
First Pitch
Tue, Sep 15, 6:40 pm
Venue
Great American Ball Park
Location
Cincinnati, Ohio
Venue Type
Outdoor
Broadcast
MLB.TV
Attendance
25,341
Live Situation
0Balls
3Strikes
0Outs
—Pitcher
—At Bat
Pitch Sequence
1
STRIKE LOOKING
Four-seam FB
98 MPH
2
STRIKE FOUL
Four-seam FB
99 MPH
3
STRIKE SWINGING
Four-seam FB
99 MPH
Injury Report




Team Stats
 LAD
CIN


4
Runs
0
8
Hits
3
0
Errors
0
2
Home Runs
0
5
Walks
3
7
Strikeouts
11
Player Box Score
Los Angeles Dodgers
| Player | H-AB | AB | R | H | RBI | HR | BB | K | #P | AVG | OBP | SLG |
|---|---|---|---|---|---|---|---|---|---|---|---|---|
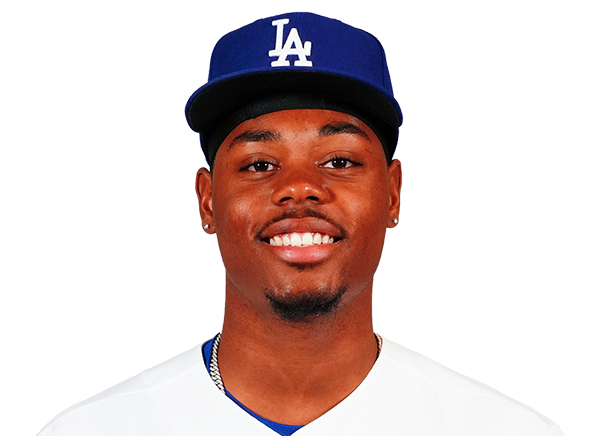 Josue De Paula | 0-5 | 5 | 0 | 0 | 0 | 0 | 0 | 2 | 17 | .143 | .368 | .429 |
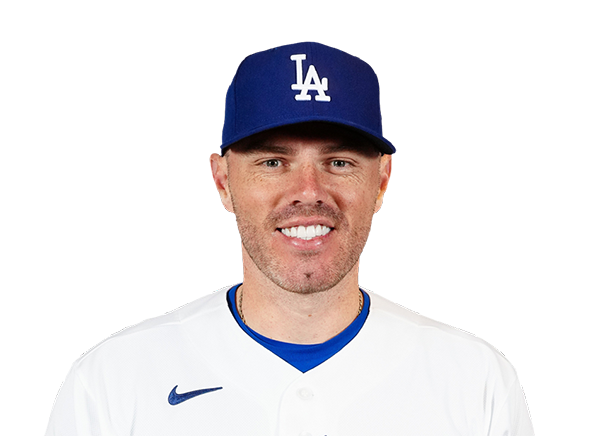 Freddie Freeman | 3-5 | 5 | 0 | 3 | 0 | 0 | 0 | 0 | 27 | .296 | .373 | .448 |
 Mookie Betts | 0-4 | 4 | 0 | 0 | 0 | 0 | 0 | 1 | 14 | .245 | .311 | .427 |
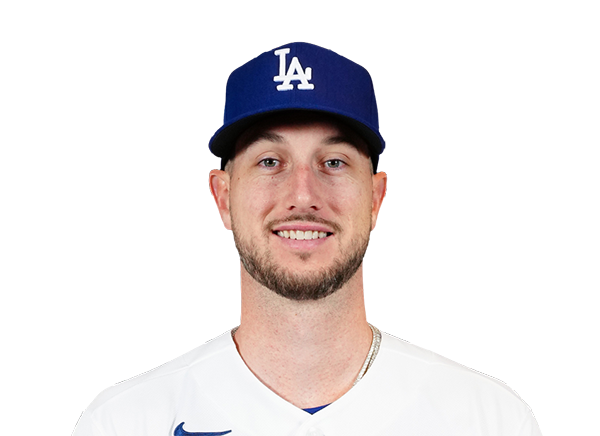 Kyle Tucker | 0-2 | 2 | 1 | 0 | 0 | 0 | 2 | 1 | 20 | .226 | .327 | .374 |
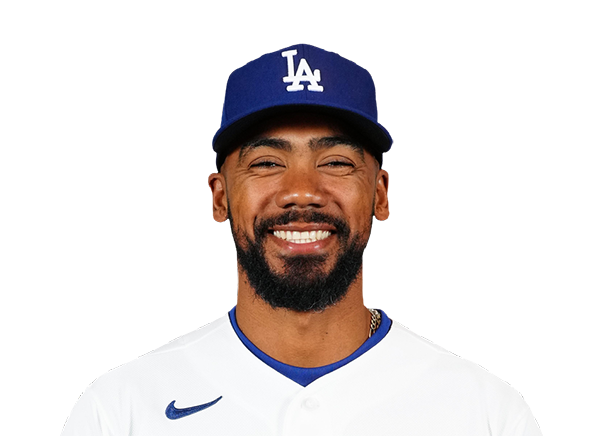 Teoscar Hernandez | 1-3 | 3 | 1 | 1 | 2 | 1 | 1 | 1 | 15 | .266 | .335 | .431 |
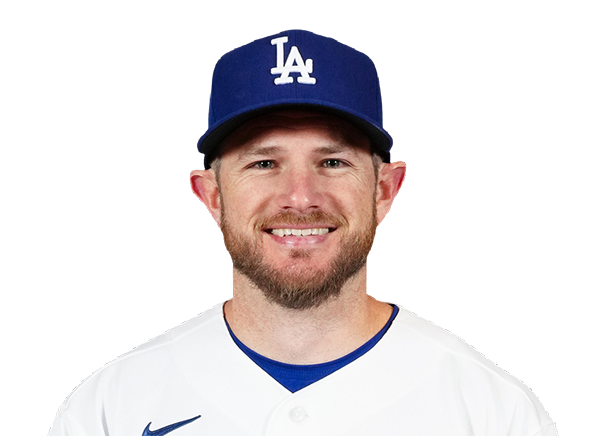 Max Muncy | 0-3 | 3 | 1 | 0 | 0 | 0 | 0 | 1 | 13 | .251 | .349 | .490 |
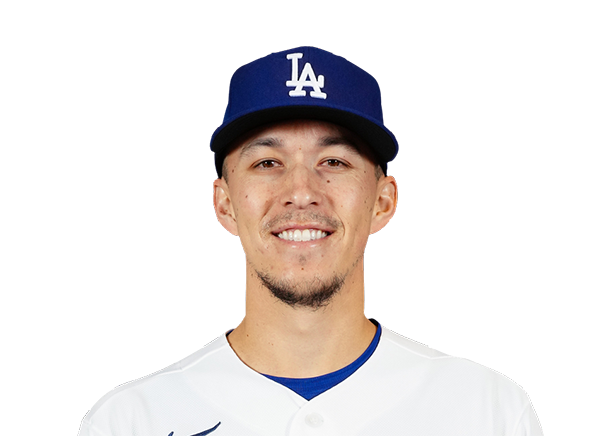 Tommy Edman | 1-3 | 3 | 0 | 1 | 0 | 0 | 0 | 0 | 15 | .254 | .337 | .383 |
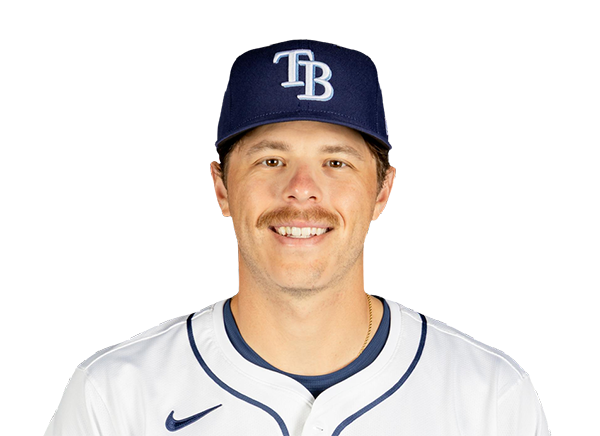 Hunter Feduccia | 1-2 | 2 | 0 | 1 | 1 | 0 | 2 | 0 | 20 | .236 | .322 | .335 |
 Alex Freeland | 2-4 | 4 | 1 | 2 | 1 | 1 | 0 | 1 | 17 | .235 | .319 | .327 |
Cincinnati Reds
| Player | H-AB | AB | R | H | RBI | HR | BB | K | #P | AVG | OBP | SLG |
|---|---|---|---|---|---|---|---|---|---|---|---|---|
 Carlos Jorge | 0-2 | 2 | 0 | 0 | 0 | 0 | 1 | 1 | 11 | .105 | .150 | .105 |
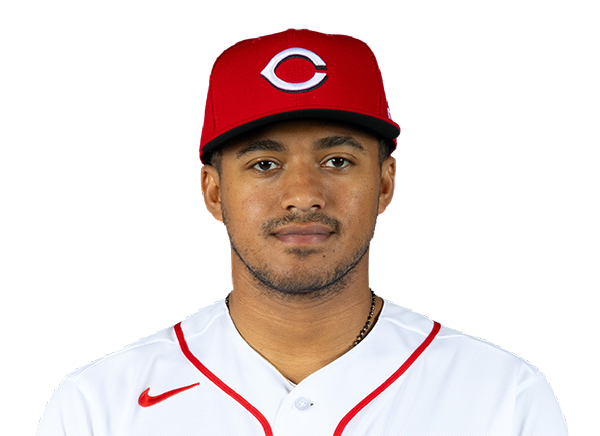 Dane Myers | 0-0 | 0 | 0 | 0 | 0 | 0 | 1 | 0 | 6 | .267 | .357 | .374 |
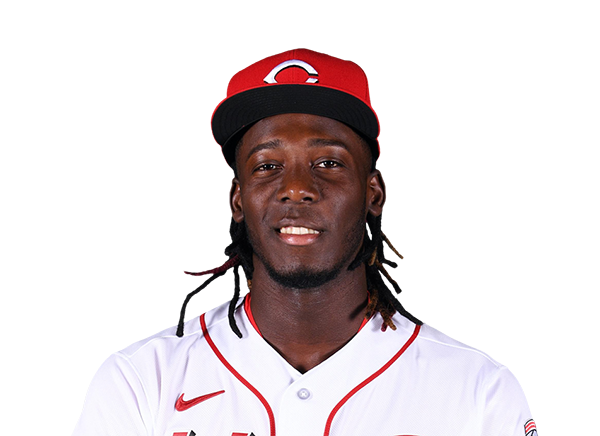 Elly De La Cruz | 2-3 | 3 | 0 | 2 | 0 | 0 | 1 | 0 | 14 | .286 | .363 | .516 |
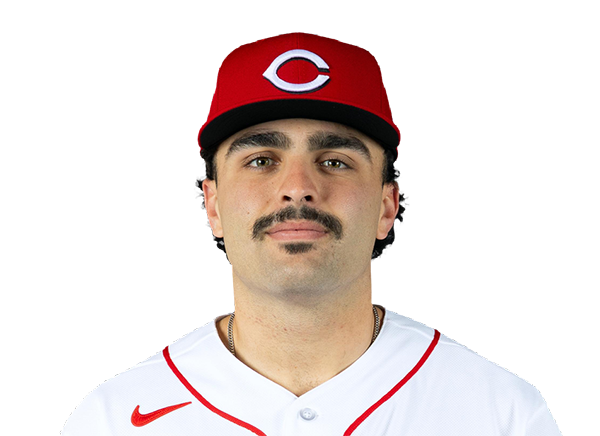 Sal Stewart | 0-4 | 4 | 0 | 0 | 0 | 0 | 0 | 3 | 16 | .266 | .335 | .470 |
 JJ Bleday | 0-3 | 3 | 0 | 0 | 0 | 0 | 0 | 0 | 11 | .213 | .323 | .412 |
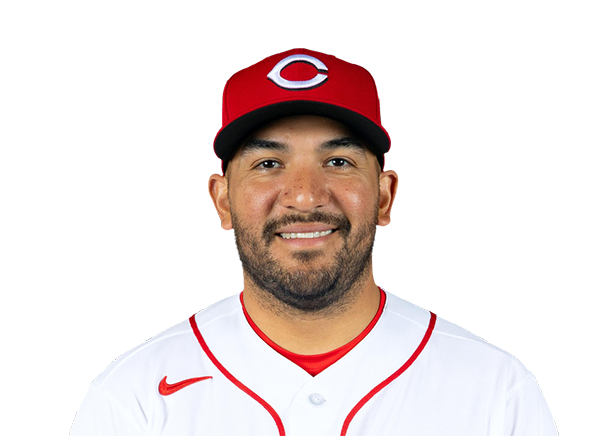 Jose Trevino | 0-1 | 1 | 0 | 0 | 0 | 0 | 0 | 1 | 3 | .214 | .218 | .343 |
 Eugenio Suarez | 0-4 | 4 | 0 | 0 | 0 | 0 | 0 | 3 | 13 | .211 | .305 | .430 |
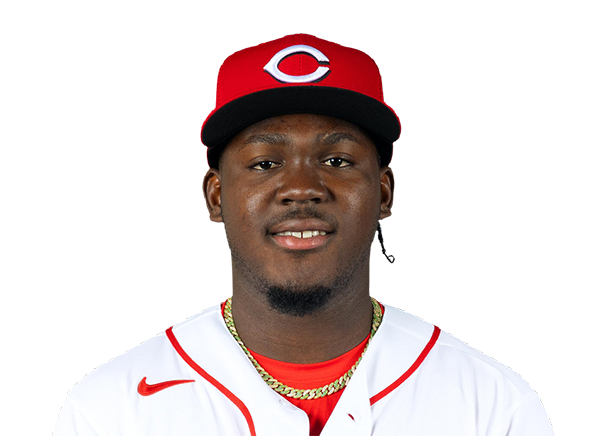 Hector Rodriguez | 0-3 | 3 | 0 | 0 | 0 | 0 | 0 | 0 | 11 | .224 | .274 | .379 |
 Matt McLain | 0-3 | 3 | 0 | 0 | 0 | 0 | 0 | 3 | 15 | .186 | .279 | .340 |
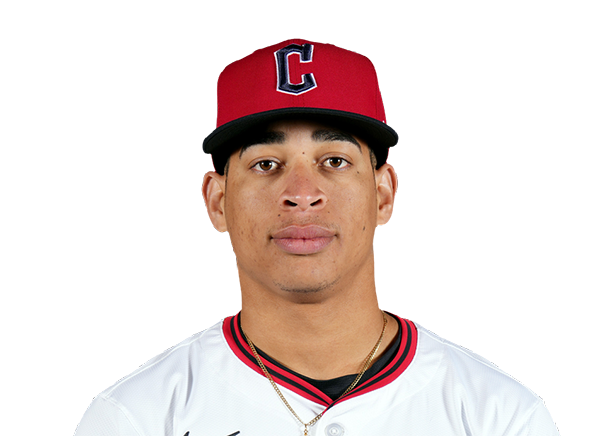 Juan Brito | 1-3 | 3 | 0 | 1 | 0 | 0 | 0 | 0 | 16 | .238 | .295 | .388 |
 Will Banfield | 0-2 | 2 | 0 | 0 | 0 | 0 | 0 | 0 | 4 | .091 | .091 | .091 |
 Tyler Stephenson | 0-1 | 1 | 0 | 0 | 0 | 0 | 0 | 0 | 3 | .246 | .328 | .419 |
Los Angeles Dodgers
| Player | IP | H | R | ER | BB | K | HR | PC-ST | ERA | PC |
|---|---|---|---|---|---|---|---|---|---|---|
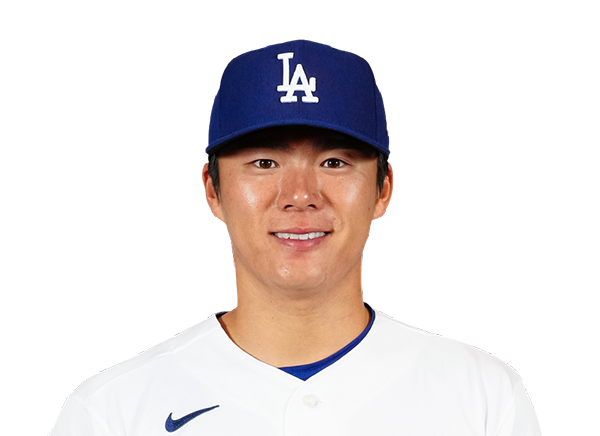 Yoshinobu Yamamoto | 7.0 | 1 | 0 | 0 | 2 | 7 | 0 | 91-55 | 2.51 | 91 |
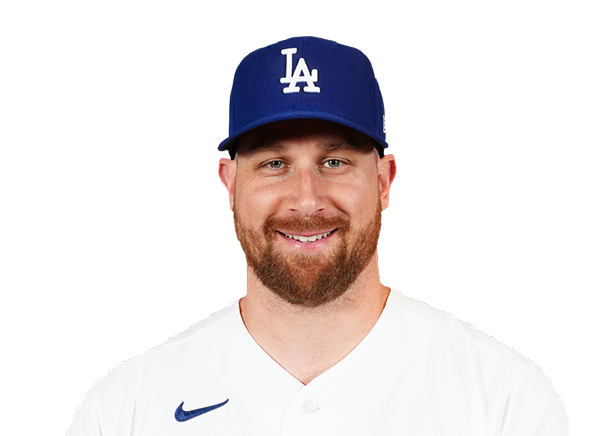 Brock Stewart | 1.0 | 1 | 0 | 0 | 0 | 1 | 0 | 15-14 | 2.66 | 15 |
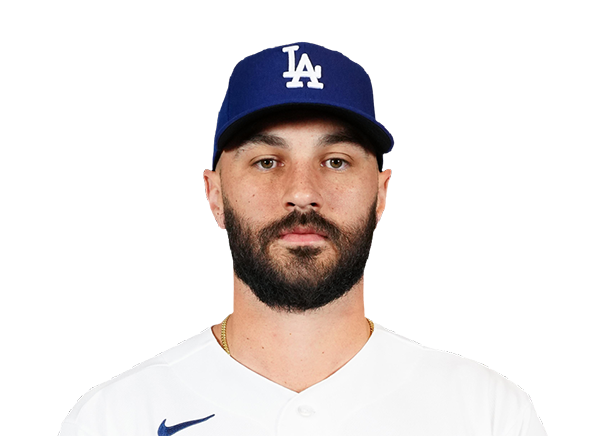 Tanner Scott | 1.0 | 1 | 0 | 0 | 1 | 3 | 0 | 17-12 | 2.87 | 17 |
Cincinnati Reds
| Player | IP | H | R | ER | BB | K | HR | PC-ST | ERA | PC |
|---|---|---|---|---|---|---|---|---|---|---|
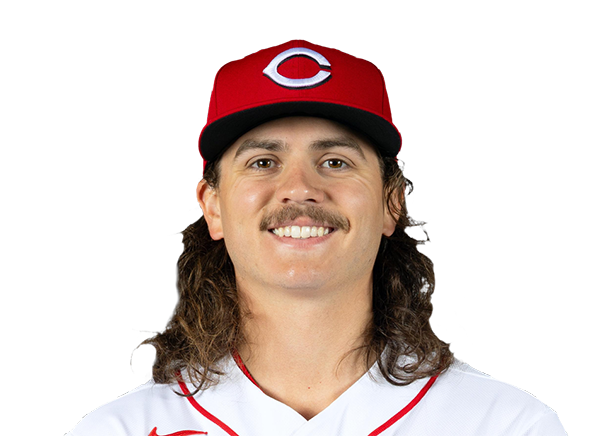 Rhett Lowder | 5.0 | 5 | 3 | 3 | 2 | 4 | 1 | 91-53 | 5.79 | 91 |
|
Julian Garcia | 1.0 | 0 | 0 | 0 | 1 | 0 | 0 | 13-5 | 3.00 | 13 |
 Pierce Johnson | 1.0 | 2 | 1 | 1 | 0 | 1 | 1 | 23-13 | 4.84 | 23 |
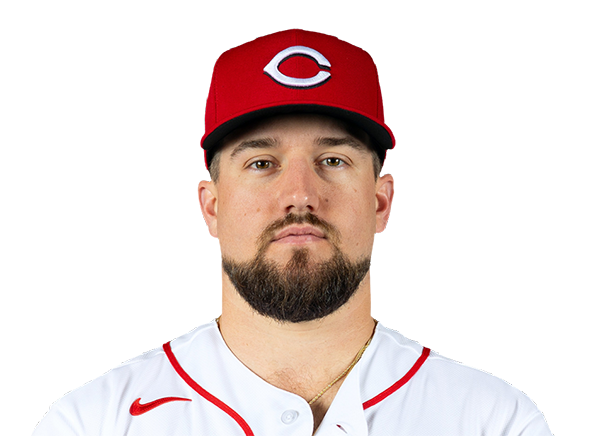 Graham Ashcraft | 1.0 | 0 | 0 | 0 | 1 | 1 | 0 | 11-7 | 4.75 | 11 |
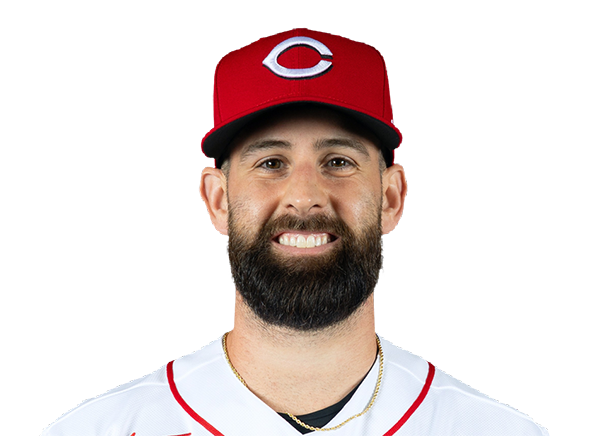 Tejay Antone | 1.0 | 1 | 0 | 0 | 1 | 1 | 0 | 20-12 | 3.38 | 20 |
H2H / Season Series
CIN0–4
LAD
CIN1–4
LAD
LAD14–1
CIN
LAD3–2
CIN
LAD6–3
CIN
LAD9–5
CIN
CIN14–13
LAD
Last 5 Games
| Date | Opponent | Result |
|---|---|---|
| Sep 15 | @ CIN | W4–0 |
| Sep 14 | @ CIN | W4–1 |
| Sep 13 |  @ MIA | L4–6 |
| Sep 12 | @ MIA | L3–4 |
| Sep 11 | @ MIA | W6–2 |
| Date | Opponent | Result |
|---|---|---|
| Sep 15 | vs LAD | L0–4 |
| Sep 14 | vs LAD | L1–4 |
| Sep 13 |  @ MIL | W4–3 |
| Sep 12 | @ MIL | L9–13 |
| Sep 11 | @ MIL | L0–20 |
Standings
American League
| Team | W | L | PCT | GB | DIFF | STRK |
|---|---|---|---|---|---|---|
1 Rays | 91 | 59 | .607 | - | +70 | W4 |
2 White Sox | 77 | 74 | .510 | 14.5 | +37 | L1 |
3 Astros | 76 | 75 | .503 | 15.5 | -51 | W1 |
4 Yankees | 88 | 63 | .583 | 3.5 | +137 | W3 |
5 Red Sox | 82 | 69 | .543 | 9.5 | +86 | L1 |
6 Guardians | 77 | 75 | .507 | 15 | -10 | W1 |
7 Rangers | 75 | 76 | .497 | 16.5 | -42 | W3 |
8 Blue Jays | 75 | 77 | .493 | 17 | -41 | L2 |
9 Orioles | 74 | 78 | .487 | 18 | -32 | W2 |
10 Tigers | 72 | 79 | .477 | 19.5 | +80 | W6 |
11 Twins | 70 | 81 | .464 | 21.5 | -74 | L3 |
12 Mariners | 70 | 82 | .461 | 22 | -61 | L3 |
13 Royals | 66 | 85 | .437 | 25.5 | -96 | L3 |
14 Athletics | 61 | 90 | .404 | 30.5 | -204 | L1 |
15 Angels | 58 | 93 | .384 | 33.5 | -73 | W2 |
National League
| Team | W | L | PCT | GB | DIFF | STRK |
|---|---|---|---|---|---|---|
| 1Brewers | 94 | 57 | .623 | - | +199 | W1 |
| 2Dodgers | 92 | 59 | .609 | 2 | +177 | W2 |
3 Braves | 89 | 63 | .586 | 5.5 | +115 | W1 |
4 Cubs | 84 | 68 | .553 | 10.5 | +139 | L1 |
5 Phillies | 83 | 68 | .550 | 11 | +28 | L1 |
6 Padres | 82 | 69 | .543 | 12 | +17 | L1 |
7 Diamondbacks | 80 | 72 | .526 | 14.5 | +1 | L1 |
8 Pirates | 75 | 76 | .497 | 19 | +22 | L1 |
| 9Marlins | 75 | 77 | .493 | 19.5 | +7 | W1 |
10 Cardinals | 75 | 77 | .493 | 19.5 | -13 | L1 |
11 Nationals | 71 | 81 | .467 | 23.5 | +6 | W4 |
| 12Reds | 70 | 81 | .464 | 24 | -152 | L2 |
13 Mets | 69 | 82 | .457 | 25 | -37 | L3 |
14 Giants | 63 | 89 | .414 | 31.5 | -71 | W1 |
15 Rockies | 56 | 95 | .371 | 38 | -164 | W1 |
LAD
VS
CIN
Pitchers
Yoshinobu Yamamoto
Catchers
Hunter Feduccia
Infielders
Freddie Freeman
Mookie Betts
Max Muncy
Alex Freeland
Outfielders
Kyle Tucker
Teoscar Hernandez
Tommy Edman
Designated Hitters
Josue De Paula
Pitchers
Rhett Lowder
Catchers
Will Banfield
Infielders
Elly De La Cruz
Sal Stewart
Matt McLain
Juan Brito
Outfielders
Carlos Jorge
JJ Bleday
Hector Rodriguez
Designated Hitters
Eugenio Suarez
Dodgers
VS
Reds
Batting
151
Team Games Played
151
5070
At Bats
5021
1293
Hits
1148
705
Runs Batted In
597
188
Home Runs
200
67
Stolen Bases
103
.255
Batting Average
.229
749
Runs
625
245
Doubles
210
17
Triples
12
2136
Total Bases
1982
583
Walks
532
1185
Strikeouts
1445
.337
On Base Percentage
.306
.421
Slugging Percentage
.395
.758
OBP Pct + SLG Pct
.701
151
Games Played
151
151
Games Started
151
64
Hit By Pitch
47
0.0
Wins Above Replacement
0.0
0.0
Offensive Wins Above Replacement
0.0
20
Caught Stealing
32
1
Is Qualified
1
727.9
Runs Created
624.1
4.9
Runs Created Per 27 Outs
4.2
.101
Walks Per Plate Appearance
.094
0.49
Walk To Strikeout Ratio
0.37
.166
Isolated Power
.166
.291
Secondary Average
.286
3.94
Pitches Per Plate Appearance
3.94
450
Extra Base Hits
422
5780
Plate Appearances
5655
27.0
At Bats Per Home Run
25.1
14
Sacrifice Hit
15
46
Sacrifice Flies
37
Pitching
151
Team Games Played
151
79
Quality Starts
45
92
Wins
70
59
Losses
81
43
Saves
40
95
Holds
82
1089
Hits
1306
540
Earned runs
723
166
Home Runs
201
461
Walks
624
1398
Strikeouts
1220
9.4
Strikeouts Per 9 Innings
8.2
143.2
Pitches Per Start
153.1
1.16
Walks Plus Hits Per Inning Pitched
1.44
3.64
Earned Run Average
4.87
59
Losses
81
1336.2
Innings pitched
1336.0
.609
Win Percentage
.464
64
Save Opportunities
62
.219
Opponent Batting Average
.254
.292
Opponent's On-base pct.
.341
.370
Opponent's Slugging pct.
.429
.662
Opponent's OPB Pct + SLG Pct
.770
4965
At Bats
5138
220
Doubles
236
14
Triples
30
63
Batters Hit
78
97
Stolen Bases
139
151
Games Played
151
1
Complete Games
0
12
Shutouts
8
36
Wild Pitches
43
544
Runs Batted In
747
5
Balks
3
1336.2
Innings pitched
1336.0
9.4
Strikeouts Per 9 Innings
8.2
25
Caught Stealing
33
151
Games Started
151
0.0
Wins Above Replacement
0.0
1
Is Qualified
1
572
Runs
777
540
Earned Runs
723
1835
Total Bases
2205
Fielding
151
Team Games Played
151
1337
Full Innings
1336
5281
Total Chances
5311
4010
Putouts
4008
1212
Assists
1216
59
Errors
87
245
Double Plays
210
0.989
Fielding Percentage
0.984
35.2
Range Factor
35.2
0.0
Zone Rating
0.0
151
Games Played
151
0
Games Started
0
0.0
Defensive Wins Above Replacement
0.0
1
Qualified
1