

Dodgers vs Reds Live Score (17 Sep, 2026)
Game Information
Stage
STD
Season
2026
First Pitch
Thu, Sep 17, 12:40 pm
Venue
Great American Ball Park
Location
Cincinnati, Ohio
Venue Type
Outdoor
Broadcast
MLB.TV
Attendance
24,169
Live Situation
2Balls
3Strikes
0Outs
—Pitcher
—At Bat
Pitch Sequence
1
STRIKE LOOKING
Four-seam FB
100 MPH
2
BALL
Four-seam FB
100 MPH
3
STRIKE FOUL
Four-seam FB
100 MPH
4
BALL
Four-seam FB
100 MPH
5
STRIKE SWINGING
Slider
88 MPH
Injury Report
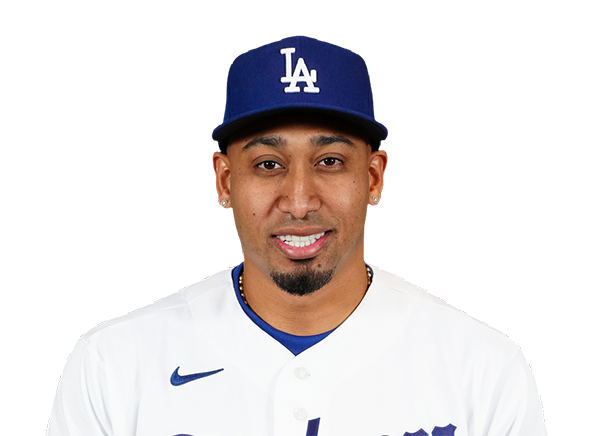
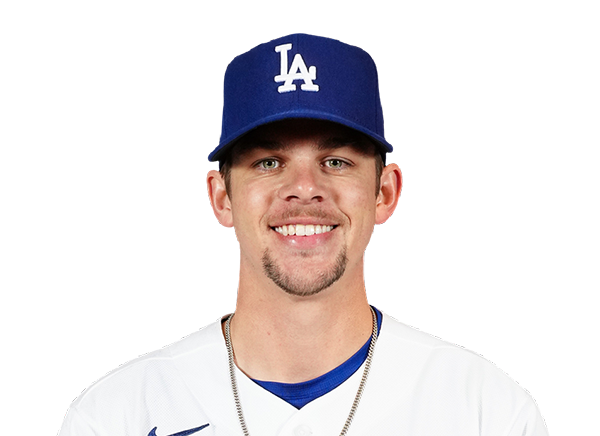
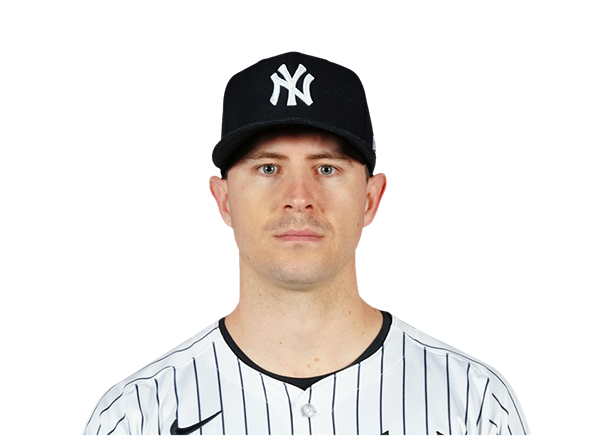

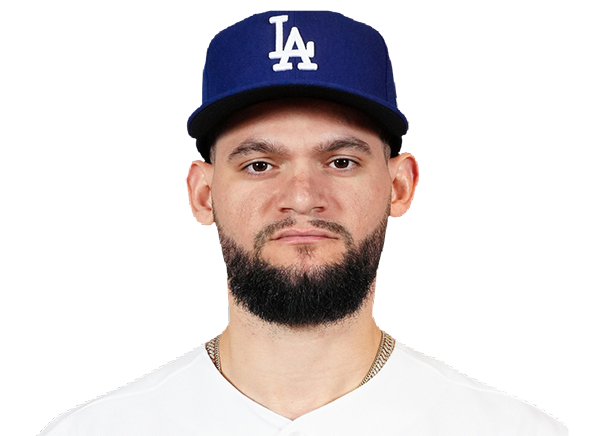


Team Stats
 LAD
CIN


8
Runs
2
12
Hits
7
0
Errors
0
2
Home Runs
1
6
Walks
0
3
Strikeouts
8
Player Box Score
Los Angeles Dodgers
| Player | H-AB | AB | R | H | RBI | HR | BB | K | #P | AVG | OBP | SLG |
|---|---|---|---|---|---|---|---|---|---|---|---|---|
 Tommy Edman | 0-4 | 4 | 0 | 0 | 0 | 0 | 0 | 1 | 22 | .246 | .332 | .371 |
 Freddie Freeman | 2-3 | 3 | 2 | 2 | 1 | 0 | 1 | 0 | 27 | .295 | .372 | .445 |
 Enrique Hernandez | 0-0 | 0 | 0 | 0 | 0 | 0 | 0 | 0 | 0 | .230 | .288 | .392 |
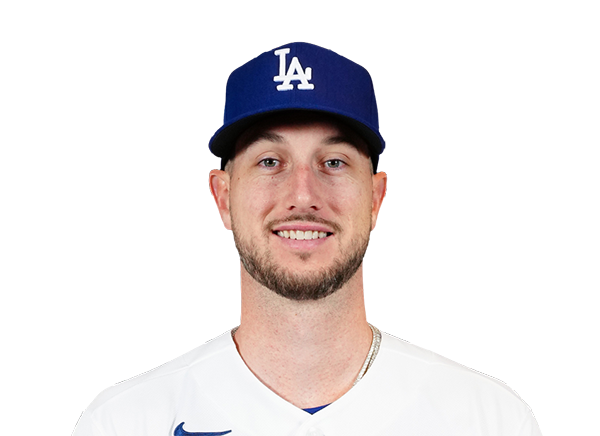 Kyle Tucker | 4-5 | 5 | 2 | 4 | 3 | 1 | 0 | 0 | 13 | .232 | .331 | .387 |
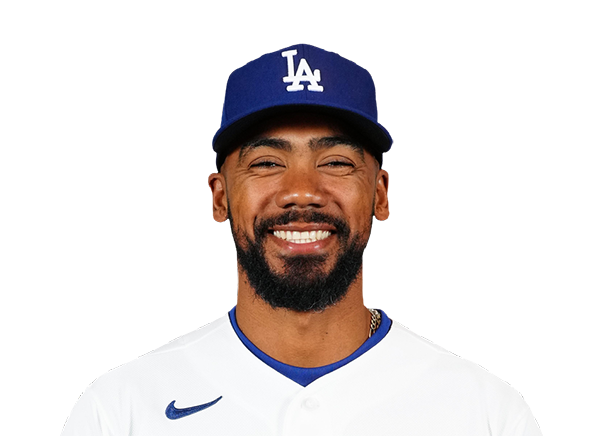 Teoscar Hernandez | 1-4 | 4 | 1 | 1 | 0 | 0 | 1 | 1 | 19 | .263 | .334 | .425 |
 Alex Call | 0-0 | 0 | 0 | 0 | 0 | 0 | 0 | 0 | 0 | .234 | .349 | .304 |
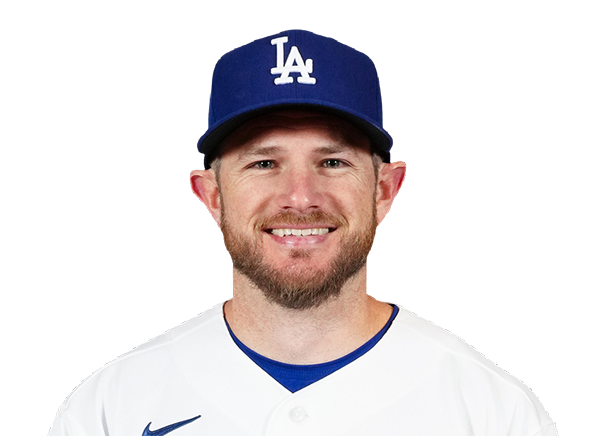 Max Muncy | 2-4 | 4 | 0 | 2 | 2 | 0 | 0 | 0 | 15 | .252 | .350 | .490 |
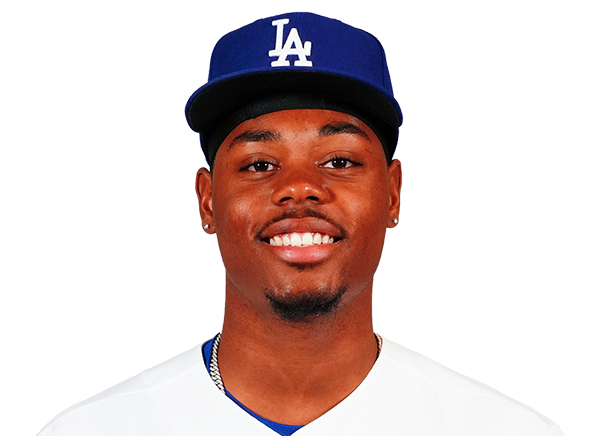 Josue De Paula | 1-4 | 4 | 0 | 1 | 1 | 0 | 1 | 0 | 23 | .167 | .400 | .389 |
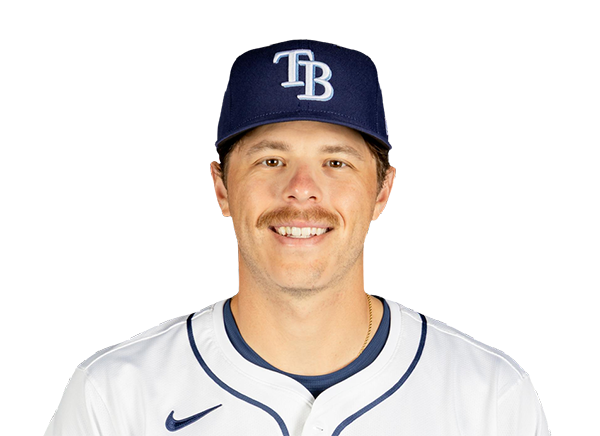 Hunter Feduccia | 0-3 | 3 | 0 | 0 | 0 | 0 | 2 | 1 | 17 | .233 | .323 | .330 |
 Alex Freeland | 0-4 | 4 | 1 | 0 | 0 | 0 | 1 | 0 | 16 | .230 | .322 | .322 |
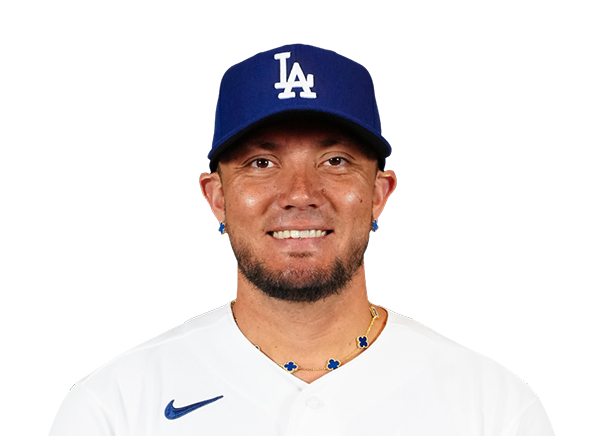 Miguel Rojas | 2-5 | 5 | 2 | 2 | 1 | 1 | 0 | 0 | 16 | .270 | .312 | .398 |
Cincinnati Reds
| Player | H-AB | AB | R | H | RBI | HR | BB | K | #P | AVG | OBP | SLG |
|---|---|---|---|---|---|---|---|---|---|---|---|---|
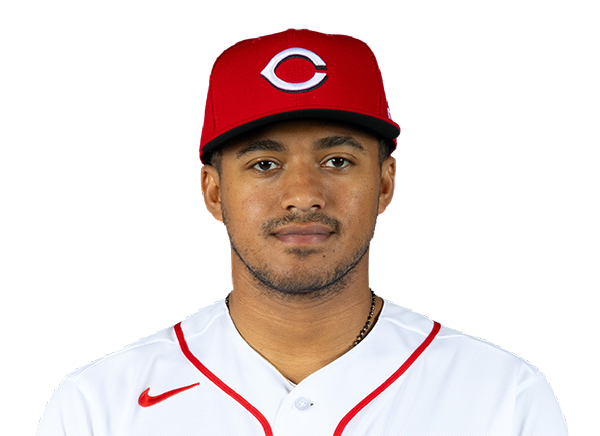 Dane Myers | 0-3 | 3 | 0 | 0 | 0 | 0 | 0 | 1 | 10 | .263 | .351 | .378 |
 Carlos Jorge | 0-1 | 1 | 0 | 0 | 0 | 0 | 0 | 0 | 4 | .100 | .143 | .100 |
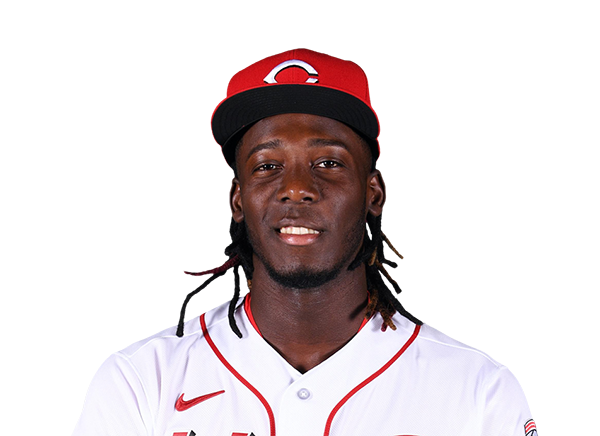 Elly De La Cruz | 0-4 | 4 | 0 | 0 | 0 | 0 | 0 | 3 | 27 | .284 | .362 | .517 |
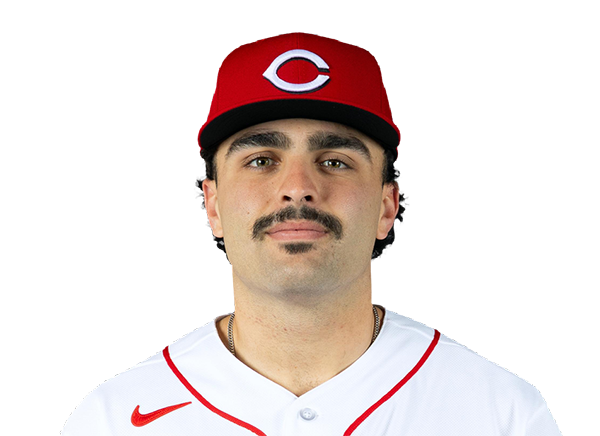 Sal Stewart | 2-4 | 4 | 2 | 2 | 1 | 1 | 0 | 1 | 21 | .271 | .339 | .477 |
 Tyler Stephenson | 1-3 | 3 | 0 | 1 | 0 | 0 | 0 | 0 | 6 | .247 | .330 | .418 |
 Will Banfield | 1-1 | 1 | 0 | 1 | 0 | 0 | 0 | 0 | 2 | .167 | .167 | .250 |
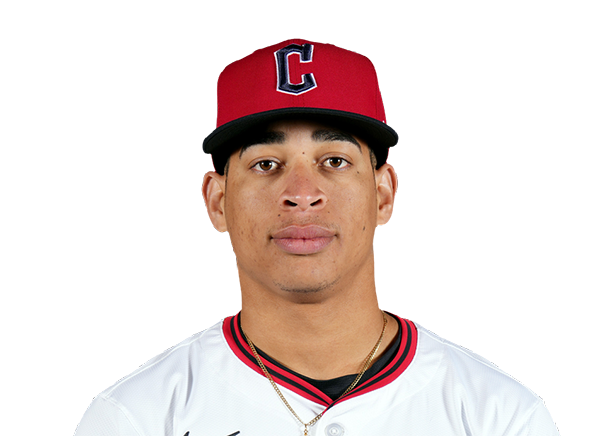 Juan Brito | 0-4 | 4 | 0 | 0 | 1 | 0 | 0 | 0 | 18 | .253 | .305 | .391 |
 Matt McLain | 0-4 | 4 | 0 | 0 | 0 | 0 | 0 | 1 | 11 | .185 | .277 | .338 |
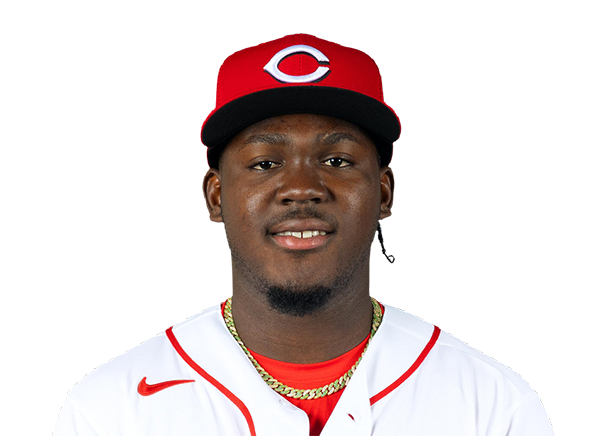 Hector Rodriguez | 1-3 | 3 | 0 | 1 | 0 | 0 | 0 | 1 | 11 | .227 | .276 | .395 |
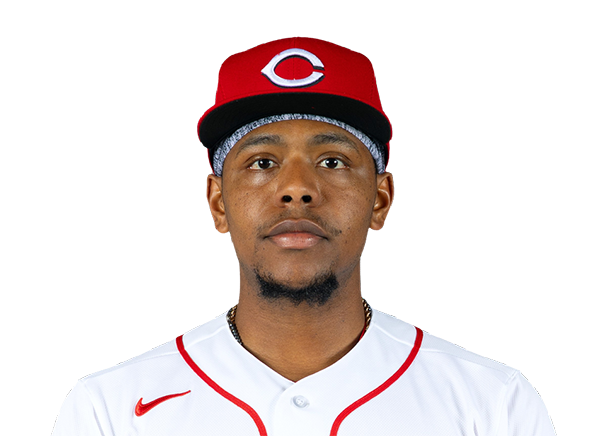 Ke'Bryan Hayes | 0-3 | 3 | 0 | 0 | 0 | 0 | 0 | 0 | 10 | .144 | .200 | .233 |
 TJ Friedl | 2-3 | 3 | 0 | 2 | 0 | 0 | 0 | 1 | 11 | .172 | .255 | .255 |
Los Angeles Dodgers
| Player | IP | H | R | ER | BB | K | HR | PC-ST | ERA | PC |
|---|---|---|---|---|---|---|---|---|---|---|
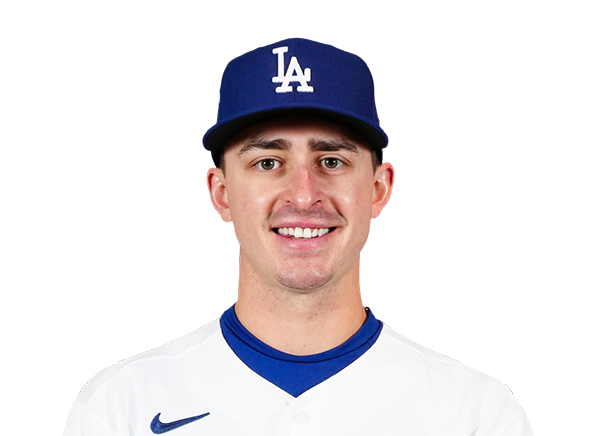 Justin Wrobleski | 3.0 | 0 | 0 | 0 | 0 | 3 | 0 | 32-23 | 3.70 | 32 |
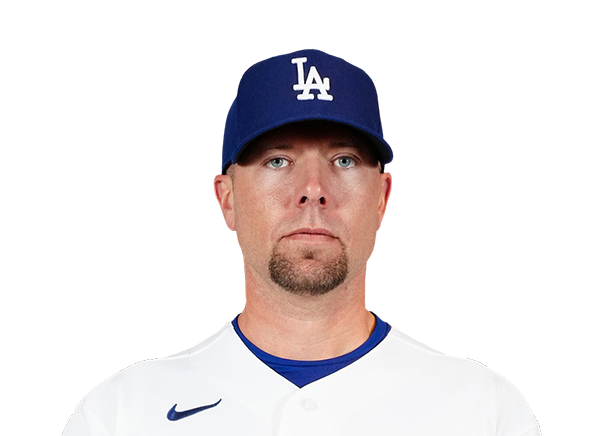 Blake Treinen | 1.0 | 1 | 1 | 1 | 0 | 2 | 1 | 22-13 | 3.54 | 22 |
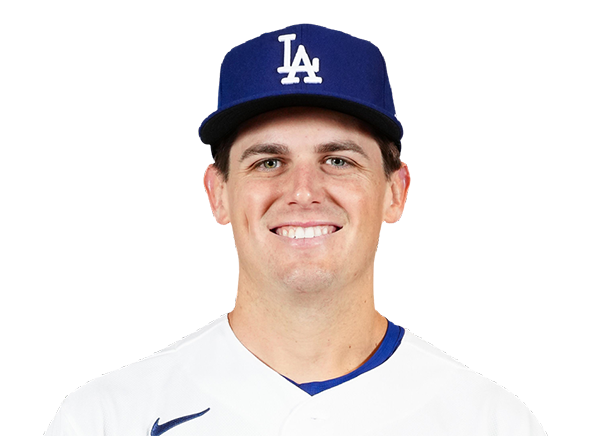 Landon Knack | 4.0 | 4 | 0 | 0 | 0 | 2 | 0 | 61-39 | 3.86 | 61 |
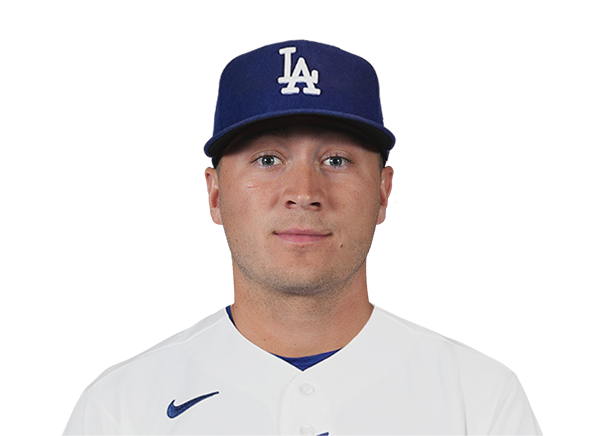 Seth Halvorsen | 1.0 | 2 | 1 | 1 | 0 | 1 | 0 | 16-9 | 6.11 | 16 |
Cincinnati Reds
| Player | IP | H | R | ER | BB | K | HR | PC-ST | ERA | PC |
|---|---|---|---|---|---|---|---|---|---|---|
 Brady Singer | 3.1 | 9 | 7 | 7 | 4 | 0 | 1 | 96-53 | 5.67 | 96 |
 Luis Mey | 1.2 | 1 | 0 | 0 | 0 | 2 | 0 | 21-16 | 6.03 | 21 |
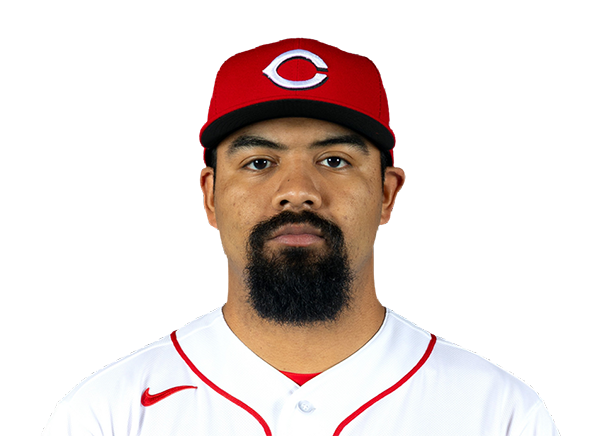 Tony Santillan | 1.0 | 0 | 0 | 0 | 2 | 0 | 0 | 16-8 | 6.42 | 16 |
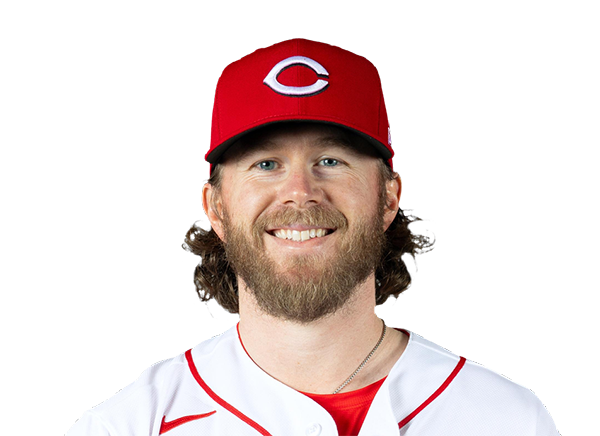 Pierce Johnson | 1.0 | 0 | 0 | 0 | 0 | 0 | 0 | 10-7 | 4.73 | 10 |
 Brandon Williamson | 2.0 | 2 | 1 | 1 | 0 | 1 | 1 | 25-16 | 5.56 | 25 |
H2H / Season Series
CIN2–8
LAD
CIN6–2
LAD
CIN0–4
LAD
CIN1–4
LAD
LAD14–1
CIN
LAD3–2
CIN
LAD6–3
CIN
LAD9–5
CIN
CIN14–13
LAD
Last 5 Games
| Date | Opponent | Result |
|---|---|---|
| Sep 17 | @ CIN | W8–2 |
| Sep 16 | @ CIN | L2–6 |
| Sep 15 | @ CIN | W4–0 |
| Sep 14 | @ CIN | W4–1 |
| Sep 13 |  @ MIA | L4–6 |
| Date | Opponent | Result |
|---|---|---|
| Sep 17 | vs LAD | L2–8 |
| Sep 16 | vs LAD | W6–2 |
| Sep 15 | vs LAD | L0–4 |
| Sep 14 | vs LAD | L1–4 |
| Sep 13 |  @ MIL | W4–3 |
Standings
American League
| Team | W | L | PCT | GB | DIFF | STRK |
|---|---|---|---|---|---|---|
1 Rays | 93 | 59 | .612 | - | +80 | W6 |
2 White Sox | 78 | 75 | .510 | 15.5 | +36 | W1 |
3 Astros | 77 | 76 | .503 | 16.5 | -50 | W1 |
4 Yankees | 88 | 64 | .579 | 5 | +136 | L1 |
5 Red Sox | 82 | 70 | .539 | 11 | +82 | L2 |
6 Guardians | 78 | 75 | .510 | 15.5 | -7 | W2 |
7 Rangers | 76 | 76 | .500 | 17 | -38 | W4 |
8 Blue Jays | 76 | 77 | .497 | 17.5 | -37 | W1 |
9 Orioles | 75 | 78 | .490 | 18.5 | -26 | W3 |
10 Tigers | 72 | 81 | .471 | 21.5 | +74 | L2 |
11 Twins | 71 | 81 | .467 | 22 | -73 | W1 |
12 Mariners | 71 | 82 | .464 | 22.5 | -56 | W1 |
13 Royals | 67 | 86 | .438 | 26.5 | -97 | L1 |
14 Athletics | 61 | 92 | .399 | 32.5 | -214 | L3 |
15 Angels | 58 | 94 | .382 | 35 | -78 | L1 |
National League
| Team | W | L | PCT | GB | DIFF | STRK |
|---|---|---|---|---|---|---|
| 1Brewers | 95 | 58 | .621 | - | +197 | L1 |
| 2Dodgers | 93 | 60 | .608 | 2 | +179 | W1 |
3 Braves | 89 | 64 | .582 | 6 | +111 | L1 |
4 Cubs | 85 | 68 | .556 | 10 | +143 | W1 |
5 Phillies | 85 | 68 | .556 | 10 | +34 | W2 |
6 Padres | 84 | 69 | .549 | 11 | +30 | W2 |
7 Diamondbacks | 80 | 73 | .523 | 15 | 0 | L2 |
| 8Marlins | 76 | 77 | .497 | 19 | +8 | W2 |
9 Pirates | 76 | 77 | .497 | 19 | +24 | W1 |
10 Cardinals | 75 | 78 | .490 | 20 | -14 | L2 |
11 Nationals | 71 | 82 | .464 | 24 | +3 | L1 |
| 12Reds | 71 | 82 | .464 | 24 | -154 | L1 |
13 Mets | 69 | 84 | .451 | 26 | -46 | L5 |
14 Giants | 64 | 89 | .418 | 31 | -70 | W2 |
15 Rockies | 56 | 97 | .366 | 39 | -177 | L2 |
LAD
VS
CIN
Pitchers
Justin Wrobleski
Catchers
Hunter Feduccia
Infielders
Freddie Freeman
Max Muncy
Alex Freeland
Miguel Rojas
Outfielders
Tommy Edman
Kyle Tucker
Teoscar Hernandez
Designated Hitters
Josue De Paula
Pitchers
Brady Singer
Catchers
Tyler Stephenson
Infielders
Sal Stewart
Juan Brito
Matt McLain
Ke'Bryan Hayes
Outfielders
Dane Myers
Hector Rodriguez
TJ Friedl
Designated Hitters
Elly De La Cruz
Dodgers
VS
Reds
Batting
153
Team Games Played
153
5139
At Bats
5087
1312
Hits
1168
715
Runs Batted In
605
190
Home Runs
203
68
Stolen Bases
104
.255
Batting Average
.230
759
Runs
633
249
Doubles
212
17
Triples
13
2165
Total Bases
2015
597
Walks
534
1198
Strikeouts
1458
.338
On Base Percentage
.307
.421
Slugging Percentage
.396
.759
OBP Pct + SLG Pct
.703
153
Games Played
153
153
Games Started
153
66
Hit By Pitch
49
0.0
Wins Above Replacement
0.0
0.0
Offensive Wins Above Replacement
0.0
21
Caught Stealing
33
1
Is Qualified
1
740.9
Runs Created
634.8
5.0
Runs Created Per 27 Outs
4.2
.102
Walks Per Plate Appearance
.093
0.50
Walk To Strikeout Ratio
0.37
.166
Isolated Power
.167
.291
Secondary Average
.285
3.94
Pitches Per Plate Appearance
3.94
456
Extra Base Hits
428
5867
Plate Appearances
5725
27.0
At Bats Per Home Run
25.1
15
Sacrifice Hit
15
47
Sacrifice Flies
37
Pitching
153
Team Games Played
153
79
Quality Starts
45
93
Wins
71
60
Losses
82
43
Saves
40
95
Holds
83
1109
Hits
1325
548
Earned runs
733
169
Home Runs
203
463
Walks
638
1411
Strikeouts
1233
9.4
Strikeouts Per 9 Innings
8.2
143.3
Pitches Per Start
153.4
1.16
Walks Plus Hits Per Inning Pitched
1.45
3.64
Earned Run Average
4.87
60
Losses
82
1353.2
Innings pitched
1354.0
.608
Win Percentage
.464
65
Save Opportunities
62
.220
Opponent Batting Average
.254
.293
Opponent's On-base pct.
.342
.371
Opponent's Slugging pct.
.429
.664
Opponent's OPB Pct + SLG Pct
.771
5031
At Bats
5207
222
Doubles
240
15
Triples
30
65
Batters Hit
80
98
Stolen Bases
140
153
Games Played
153
1
Complete Games
0
12
Shutouts
8
37
Wild Pitches
43
552
Runs Batted In
757
5
Balks
3
1353.2
Innings pitched
1354.0
9.4
Strikeouts Per 9 Innings
8.2
26
Caught Stealing
34
153
Games Started
153
0.0
Wins Above Replacement
0.0
1
Is Qualified
1
580
Runs
787
548
Earned Runs
733
1868
Total Bases
2234
Fielding
153
Team Games Played
153
1354
Full Innings
1354
5350
Total Chances
5376
4061
Putouts
4062
1230
Assists
1227
59
Errors
87
249
Double Plays
212
0.989
Fielding Percentage
0.984
35.2
Range Factor
35.2
0.0
Zone Rating
0.0
153
Games Played
153
0
Games Started
0
0.0
Defensive Wins Above Replacement
0.0
1
Qualified
1