

Giants vs Orioles Live Score (11 Apr, 2026)
Game Information
Stage
Standard
Season
2026
First Pitch
Sat, Apr 11, 7:15 pm
Venue
Oriole Park at Camden Yards
Location
Baltimore, Maryland
Attendance
29,444
Live Situation
0Balls
1Strikes
0Outs
—Pitcher
—At Bat
Pitch Sequence
1
STRIKE SWINGING
Slider
86 MPH
2
BALL IN PLAY
Slider
86 MPH
Injury Report

Team Stats
 SF
BAL


2
Runs
6
10
Hits
9
0
Errors
0
0
Home Runs
2
1
Walks
4
6
Strikeouts
11
Player Box Score
San Francisco Giants
| Player | H-AB | AB | R | H | RBI | HR | BB | K | #P | AVG | OBP | SLG |
|---|---|---|---|---|---|---|---|---|---|---|---|---|
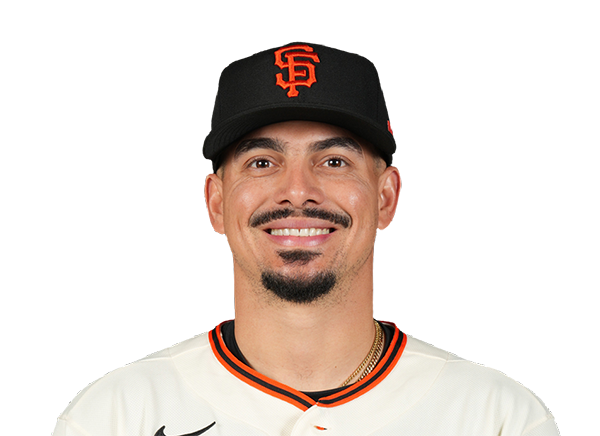 Willy Adames | 0-3 | 3 | 0 | 0 | 0 | 0 | 1 | 1 | 23 | .259 | .317 | .500 |
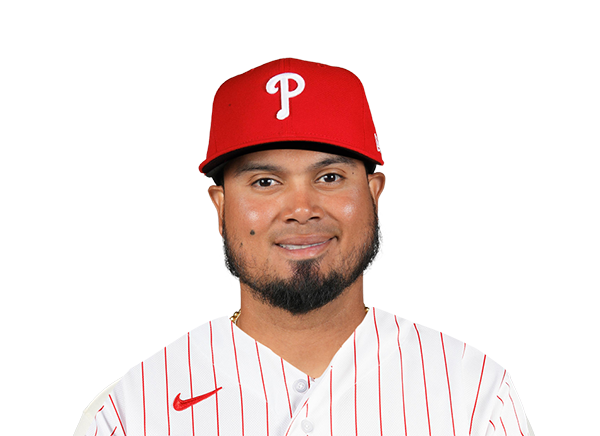 Luis Arraez | 1-3 | 3 | 0 | 1 | 0 | 0 | 0 | 0 | 11 | .304 | .339 | .393 |
 Christian Koss | 1-1 | 1 | 0 | 1 | 0 | 0 | 0 | 0 | 2 | .250 | .250 | .500 |
 Matt Chapman | 1-4 | 4 | 0 | 1 | 0 | 0 | 0 | 0 | 14 | .310 | .365 | .448 |
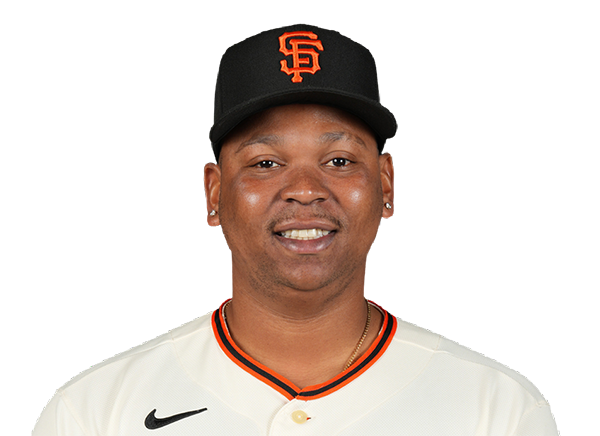 Rafael Devers | 1-4 | 4 | 2 | 1 | 0 | 0 | 0 | 1 | 17 | .220 | .270 | .339 |
 Casey Schmitt | 1-4 | 4 | 0 | 1 | 0 | 0 | 0 | 2 | 19 | .324 | .395 | .471 |
 Jung Hoo Lee | 2-4 | 4 | 0 | 2 | 0 | 0 | 0 | 0 | 14 | .200 | .263 | .340 |
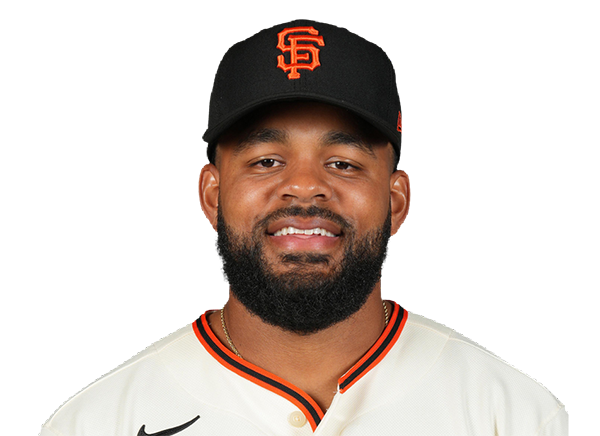 Heliot Ramos | 2-4 | 4 | 0 | 2 | 2 | 0 | 0 | 0 | 16 | .236 | .263 | .255 |
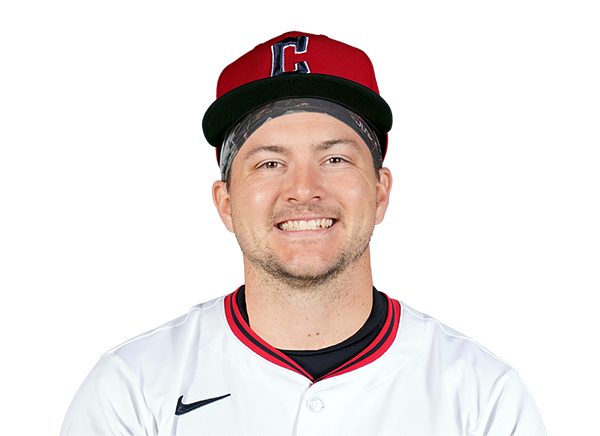 Patrick Bailey | 0-3 | 3 | 0 | 0 | 0 | 0 | 0 | 0 | 7 | .146 | .205 | .146 |
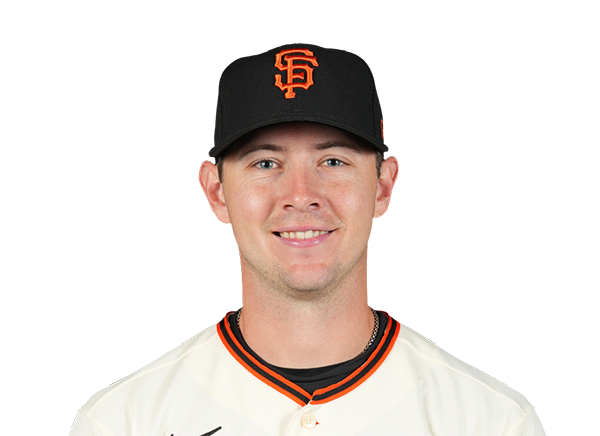 Daniel Susac | 0-1 | 1 | 0 | 0 | 0 | 0 | 0 | 0 | 4 | .750 | .778 | 1.000 |
 Harrison Bader | 1-4 | 4 | 0 | 1 | 0 | 0 | 0 | 2 | 16 | .115 | .145 | .192 |
Baltimore Orioles
| Player | H-AB | AB | R | H | RBI | HR | BB | K | #P | AVG | OBP | SLG |
|---|---|---|---|---|---|---|---|---|---|---|---|---|
 Gunnar Henderson | 1-4 | 4 | 1 | 1 | 1 | 1 | 1 | 2 | 21 | .246 | .348 | .614 |
 Taylor Ward | 0-3 | 3 | 0 | 0 | 0 | 0 | 1 | 2 | 14 | .345 | .431 | .527 |
 Pete Alonso | 0-3 | 3 | 0 | 0 | 0 | 0 | 1 | 2 | 21 | .167 | .262 | .259 |
 Samuel Basallo | 0-4 | 4 | 0 | 0 | 0 | 0 | 0 | 1 | 18 | .135 | .238 | .216 |
 Ryan Mountcastle | 1-1 | 1 | 0 | 1 | 0 | 0 | 0 | 0 | 2 | .286 | .333 | .357 |
 Dylan Beavers | 1-2 | 2 | 2 | 1 | 0 | 0 | 1 | 1 | 16 | .273 | .342 | .394 |
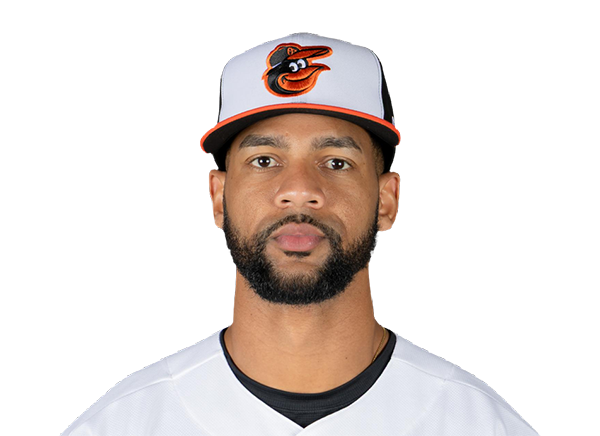 Leody Taveras | 0-4 | 4 | 1 | 0 | 0 | 0 | 0 | 1 | 21 | .333 | .455 | .444 |
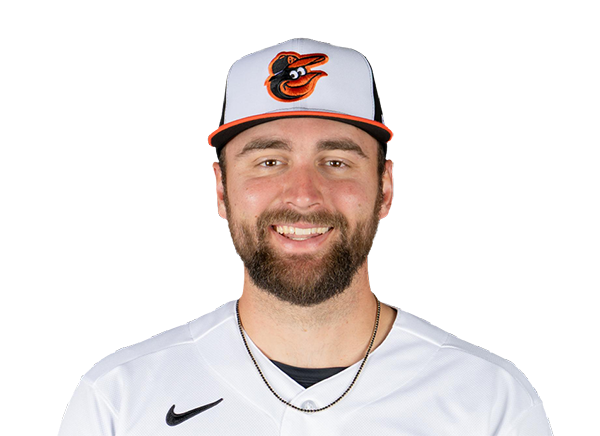 Colton Cowser | 2-4 | 4 | 0 | 2 | 1 | 0 | 0 | 1 | 15 | .231 | .300 | .269 |
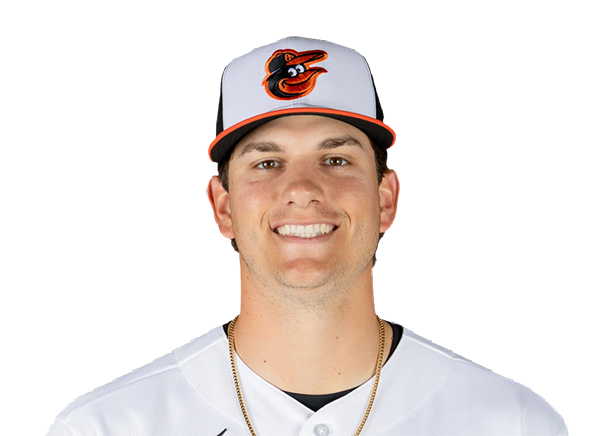 Coby Mayo | 1-4 | 4 | 1 | 1 | 2 | 0 | 0 | 1 | 10 | .147 | .275 | .176 |
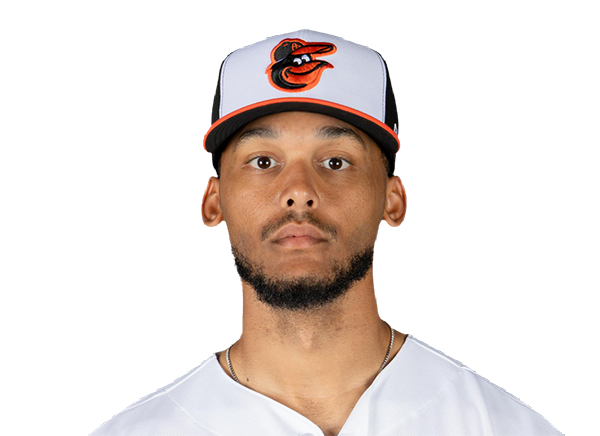 Jeremiah Jackson | 3-4 | 4 | 1 | 3 | 2 | 1 | 0 | 0 | 6 | .278 | .289 | .389 |
San Francisco Giants
| Player | IP | H | R | ER | BB | K | HR | PC-ST | ERA | PC |
|---|---|---|---|---|---|---|---|---|---|---|
 Logan Webb | 6.0 | 5 | 4 | 4 | 3 | 6 | 1 | 98-63 | 5.25 | 98 |
 Caleb Kilian | 0.2 | 1 | 1 | 1 | 1 | 2 | 1 | 17-12 | 1.50 | 17 |
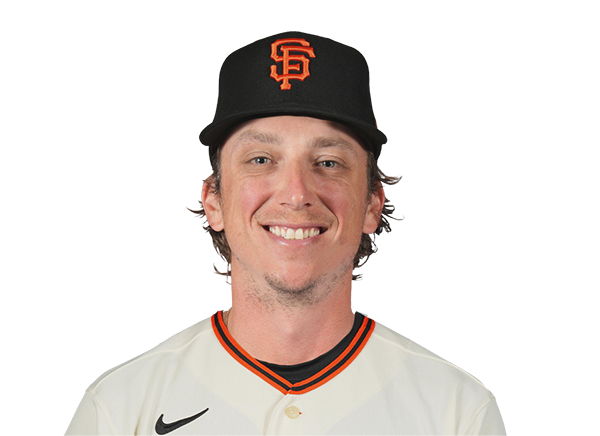 Ryan Borucki | 1.1 | 3 | 1 | 1 | 0 | 3 | 0 | 29-19 | 8.44 | 29 |
Baltimore Orioles
| Player | IP | H | R | ER | BB | K | HR | PC-ST | ERA | PC |
|---|---|---|---|---|---|---|---|---|---|---|
 Chris Bassitt | 4.2 | 7 | 2 | 1 | 1 | 2 | 0 | 89-57 | 9.00 | 89 |
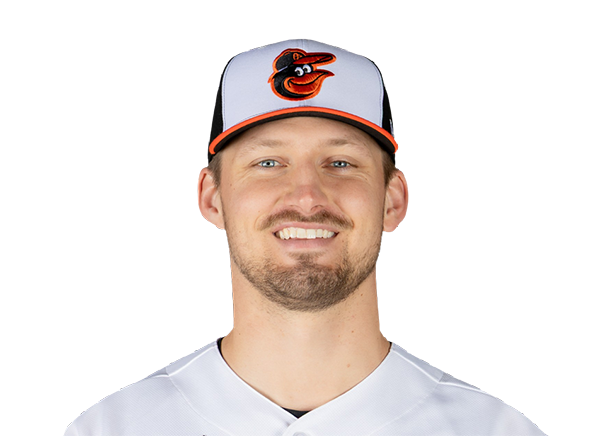 Grant Wolfram | 1.0 | 0 | 0 | 0 | 0 | 1 | 0 | 14-9 | 3.00 | 14 |
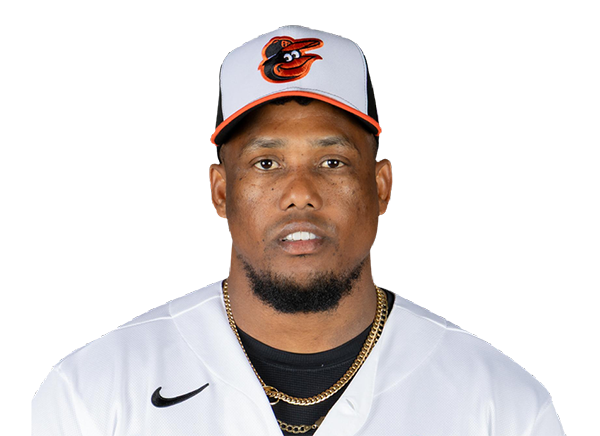 Yennier Cano | 0.1 | 0 | 0 | 0 | 0 | 0 | 0 | 2-1 | 2.08 | 2 |
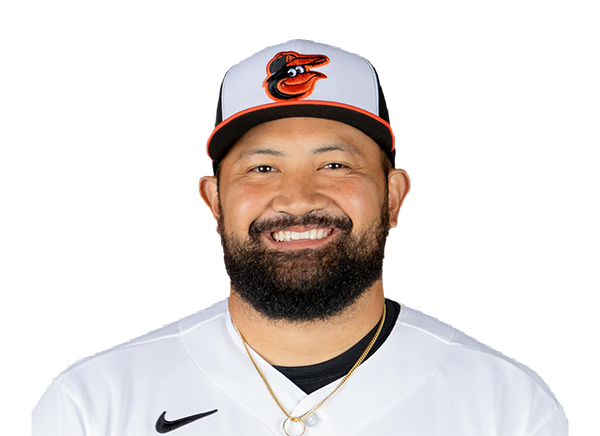 Rico Garcia | 1.0 | 0 | 0 | 0 | 0 | 1 | 0 | 8-6 | 0.00 | 8 |
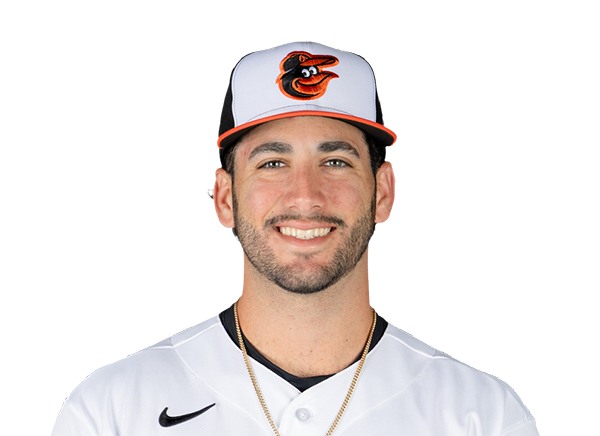 Anthony Nunez | 1.0 | 1 | 0 | 0 | 0 | 2 | 0 | 16-11 | 1.23 | 16 |
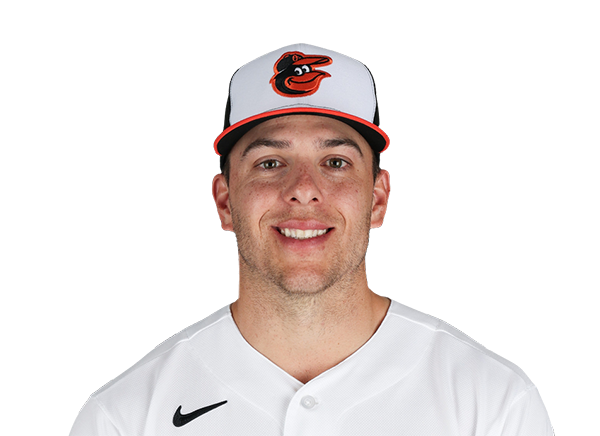 Ryan Helsley | 1.0 | 2 | 0 | 0 | 0 | 0 | 0 | 14-10 | 3.38 | 14 |
H2H / Season Series
BAL6–2
SF
BAL6–2
SF
BAL3–6
SF
Last 5 Games
| Date | Opponent | Result |
|---|---|---|
| Aug 23 |  @ BOS | L4–5 |
| Aug 22 | @ BOS | L2–3 |
| Aug 21 | @ BOS | L4–6 |
| Aug 20 |  @ CLE | L2–5 |
| Aug 19 | @ CLE | W1–0 |
| Date | Opponent | Result |
|---|---|---|
| Aug 23 |  vs TB | L1–3 |
| Aug 22 | vs TB | W3–2 |
| Aug 21 | vs TB | W5–3 |
| Aug 20 |  vs NYY | L1–6 |
| Aug 19 | vs NYY | L3–5 |
Standings
American League
| Team | W | L | PCT | GB | DIFF | STRK |
|---|---|---|---|---|---|---|
| 1Rays | 77 | 53 | .592 | - | +44 | W1 |
2 White Sox | 68 | 62 | .523 | 9 | +43 | W1 |
3 Astros | 65 | 66 | .496 | 12.5 | -44 | L2 |
| 4Yankees | 74 | 56 | .569 | 3 | +100 | W1 |
| 5Red Sox | 71 | 59 | .546 | 6 | +99 | W3 |
6 Rangers | 65 | 66 | .496 | 12.5 | -46 | W1 |
| 7Guardians | 65 | 66 | .496 | 12.5 | -9 | W4 |
8 Blue Jays | 64 | 68 | .485 | 14 | -55 | L1 |
9 Twins | 63 | 68 | .481 | 14.5 | -54 | L3 |
| 10Orioles | 63 | 68 | .481 | 14.5 | -35 | L1 |
11 Mariners | 62 | 69 | .473 | 15.5 | -61 | L1 |
12 Tigers | 61 | 69 | .469 | 16 | +73 | L5 |
13 Royals | 58 | 74 | .439 | 20 | -91 | W8 |
14 Angels | 52 | 79 | .397 | 25.5 | -70 | L1 |
15 Athletics | 51 | 80 | .389 | 26.5 | -187 | W2 |
National League
| Team | W | L | PCT | GB | DIFF | STRK |
|---|---|---|---|---|---|---|
1 Brewers | 81 | 50 | .618 | - | +161 | L1 |
2 Dodgers | 80 | 51 | .611 | 1 | +151 | W6 |
3 Braves | 76 | 55 | .580 | 5 | +110 | W1 |
4 Cubs | 75 | 56 | .573 | 6 | +115 | W1 |
5 Phillies | 73 | 58 | .557 | 8 | +27 | W9 |
6 Padres | 71 | 60 | .542 | 10 | +16 | W3 |
7 Diamondbacks | 69 | 62 | .527 | 12 | +9 | W1 |
8 Marlins | 67 | 64 | .511 | 14 | +21 | W3 |
9 Cardinals | 66 | 66 | .500 | 15.5 | -2 | L3 |
10 Pirates | 63 | 69 | .477 | 18.5 | +25 | L3 |
11 Reds | 62 | 69 | .473 | 19 | -94 | L1 |
12 Nationals | 61 | 71 | .462 | 20.5 | +10 | L4 |
13 Mets | 59 | 72 | .450 | 22 | -40 | L1 |
| 14Giants | 52 | 78 | .400 | 28.5 | -80 | L4 |
15 Rockies | 50 | 80 | .385 | 30.5 | -136 | L6 |
SF
VS
BAL
Pitchers
Logan Webb
Caleb Kilian
Ryan Borucki
Catchers
Patrick Bailey
Infielders
Willy Adames
Luis Arraez
Christian Koss
Matt Chapman
Rafael Devers
Outfielders
Jung Hoo Lee
Heliot Ramos
Harrison Bader
Designated Hitters
Casey Schmitt
Other Players
Daniel Susac
Pitchers
Chris Bassitt
Grant Wolfram
Yennier Cano
Rico Garcia
Anthony Nunez
Ryan Helsley
Catchers
Samuel Basallo
Infielders
Gunnar Henderson
Pete Alonso
Coby Mayo
Jeremiah Jackson
Outfielders
Taylor Ward
Leody Taveras
Colton Cowser
Designated Hitters
Ryan Mountcastle
Dylan Beavers
Giants
VS
Orioles
Batting
130
Team Games Played
131
4415
At Bats
4348
1090
Hits
1020
502
Runs Batted In
563
144
Home Runs
159
57
Stolen Bases
68
.247
Batting Average
.235
523
Runs
583
214
Doubles
188
24
Triples
18
1784
Total Bases
1721
344
Walks
491
1036
Strikeouts
1202
.305
On Base Percentage
.317
.404
Slugging Percentage
.396
.709
OBP Pct + SLG Pct
.713
130
Games Played
131
130
Games Started
131
41
Hit By Pitch
48
0.0
Wins Above Replacement
0.0
0.0
Offensive Wins Above Replacement
0.0
18
Caught Stealing
29
1
Is Qualified
1
547.6
Runs Created
553.7
4.3
Runs Created Per 27 Outs
4.3
.071
Walks Per Plate Appearance
.099
0.33
Walk To Strikeout Ratio
0.41
.157
Isolated Power
.161
.244
Secondary Average
.283
3.85
Pitches Per Plate Appearance
4.00
382
Extra Base Hits
365
4858
Plate Appearances
4937
30.7
At Bats Per Home Run
27.3
22
Sacrifice Hit
16
36
Sacrifice Flies
32
Pitching
130
Team Games Played
131
45
Quality Starts
51
52
Wins
63
78
Losses
68
24
Saves
34
63
Holds
68
1072
Hits
1132
554
Earned runs
543
119
Home Runs
139
487
Walks
435
976
Strikeouts
1038
7.7
Strikeouts Per 9 Innings
8.0
147.6
Pitches Per Start
145.7
1.36
Walks Plus Hits Per Inning Pitched
1.34
4.36
Earned Run Average
4.19
78
Losses
68
1144.1
Innings pitched
1165.2
.400
Win Percentage
.481
44
Save Opportunities
52
.248
Opponent Batting Average
.254
.329
Opponent's On-base pct.
.322
.388
Opponent's Slugging pct.
.408
.717
Opponent's OPB Pct + SLG Pct
.730
4324
At Bats
4462
192
Doubles
226
29
Triples
23
57
Batters Hit
37
105
Stolen Bases
69
130
Games Played
131
1
Complete Games
1
9
Shutouts
2
48
Wild Pitches
41
567
Runs Batted In
590
4
Balks
2
1144.1
Innings pitched
1165.2
7.7
Strikeouts Per 9 Innings
8.0
34
Caught Stealing
33
130
Games Started
131
0.0
Wins Above Replacement
0.0
1
Is Qualified
1
603
Runs
618
554
Earned Runs
543
1679
Total Bases
1821
Fielding
130
Team Games Played
131
1144
Full Innings
1166
4738
Total Chances
4708
3433
Putouts
3497
1221
Assists
1129
84
Errors
82
214
Double Plays
188
0.982
Fielding Percentage
0.983
36.6
Range Factor
35.7
0.0
Zone Rating
0.0
130
Games Played
131
0
Games Started
0
0.0
Defensive Wins Above Replacement
0.0
1
Qualified
1