

Giants vs Red Sox Live Score (22 Aug, 2026)
Game Information
Stage
STD
Season
2026
First Pitch
Sat, Aug 22, 7:15 pm
Venue
Fenway Park
Location
Boston, Massachusetts
Venue Type
Outdoor
Broadcast
MLB.TV
Attendance
0
Live Situation
0Balls
0Strikes
0Outs
—Pitcher
—At Bat
Home Runs
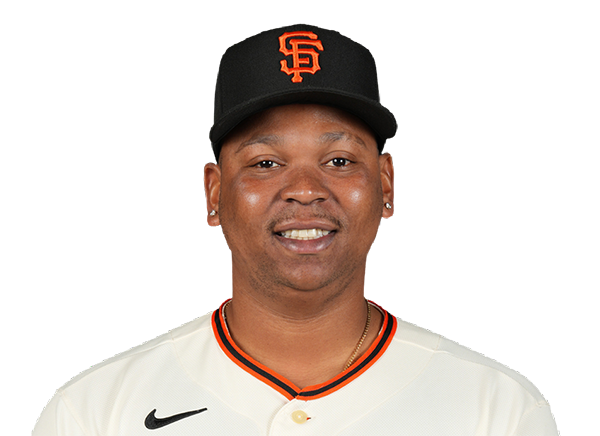
Rafael Devers
26 HR
.245 AVG
70 RBI
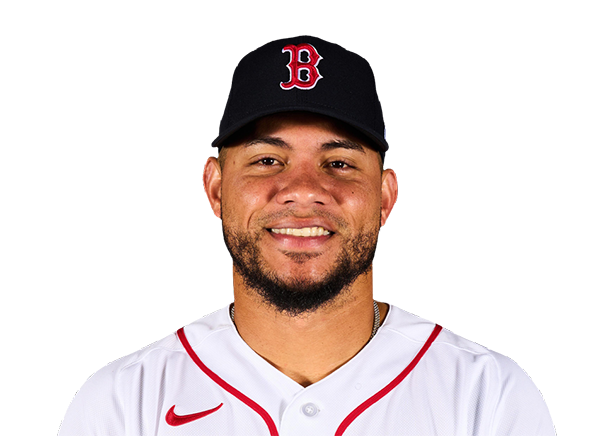
Willson Contreras
26 HR
.285 AVG
78 RBI
Batting Average
Jung Hoo Lee
.291 AVG
.328 OBP
.430 SLG

Ceddanne Rafaela
.285 AVG
.322 OBP
.462 SLG

Runs Batted In
Rafael Devers
70 RBI
26 HR
.245 AVG
Willson Contreras
78 RBI
26 HR
.285 AVG
Earned Run Average
Logan Webb
3.75 ERA
8 W
112 K

Sonny Gray
2.79 ERA
16 W
123 K

Wins
Logan Webb
8 W
3.75 ERA
112 K
Sonny Gray
16 W
2.79 ERA
123 K
Strikeouts
Landen Roupp
130 K
7 W
4.34 ERA

Payton Tolle
134 K
8 W
3.08 ERA
Injury Report


Team Stats
 SF
BOS


517
Runs
581
1074
Hits
1075
84
Errors
62
141
Home Runs
132
338
Walks
409
1019
Strikeouts
1037
Player Box Score
San Francisco Giants
| Player | H-AB | AB | H | RBI | HR | SB | K | AVG |
|---|---|---|---|---|---|---|---|---|
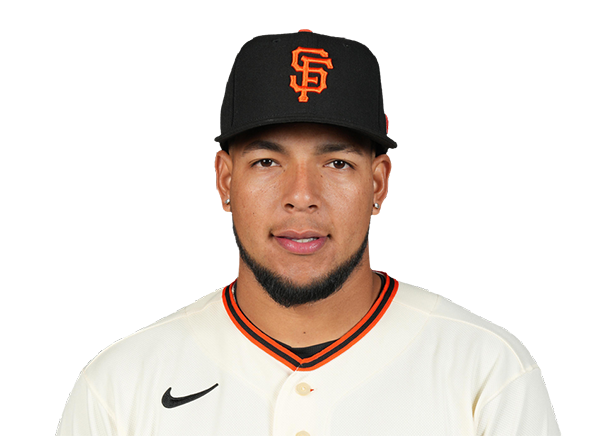 Victor Bericoto | 20-80 | 80 | 20 | 11 | 4 | 1 | 23 | .250 |
|
Rafael Devers | 118-482 | 482 | 118 | 70 | 26 | 0 | 142 | .245 |
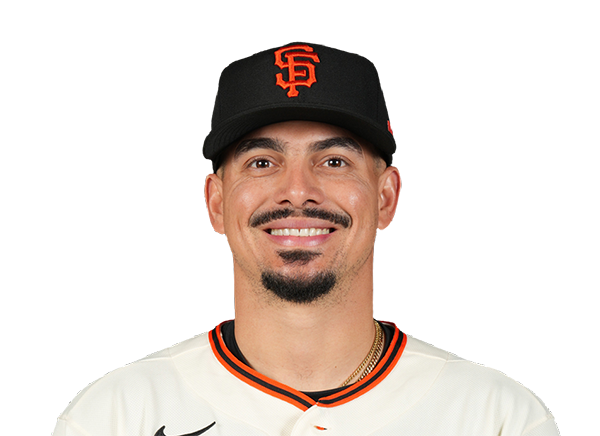 Willy Adames | 104-458 | 458 | 104 | 50 | 20 | 5 | 136 | .227 |
 Bryce Eldridge | 75-303 | 303 | 75 | 34 | 14 | 1 | 92 | .248 |
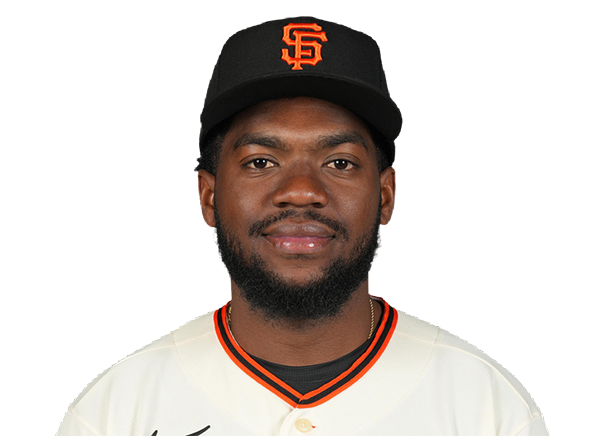 Osleivis Basabe | 16-68 | 68 | 16 | 8 | 3 | 1 | 13 | .235 |
|
Jung Hoo Lee | 130-446 | 446 | 130 | 46 | 9 | 8 | 48 | .291 |
 Christian Koss | 19-93 | 93 | 19 | 2 | 0 | 2 | 25 | .204 |
 Drew Gilbert | 65-270 | 270 | 65 | 31 | 7 | 1 | 55 | .241 |
 Andrew Knizner | 0-7 | 7 | 0 | 0 | 0 | 0 | 2 | .000 |
Boston Red Sox
| Player | H-AB | AB | H | RBI | HR | SB | K | AVG |
|---|---|---|---|---|---|---|---|---|
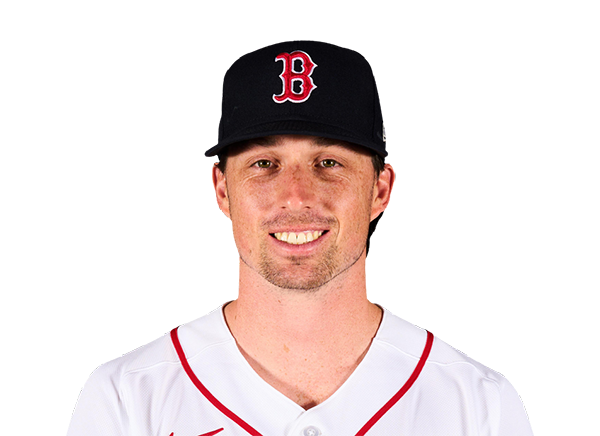 Nick Sogard | 31-116 | 116 | 31 | 7 | 1 | 0 | 24 | .267 |
|
Ceddanne Rafaela | 139-487 | 487 | 139 | 64 | 16 | 16 | 105 | .285 |
 Wilyer Abreu | 124-475 | 475 | 124 | 68 | 22 | 8 | 106 | .261 |
|
Willson Contreras | 115-403 | 403 | 115 | 78 | 26 | 3 | 122 | .285 |
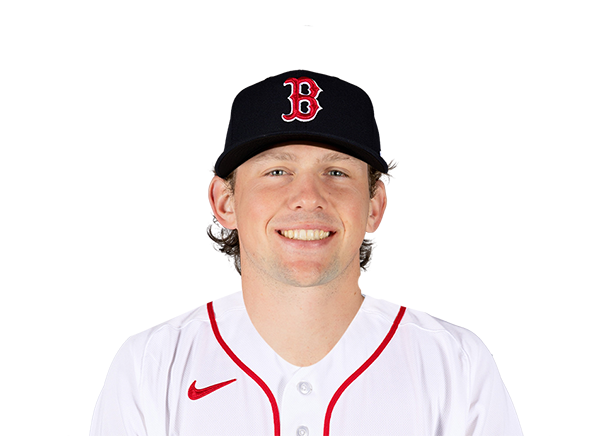 Adley Rutschman | 68-278 | 278 | 68 | 51 | 9 | 0 | 50 | .245 |
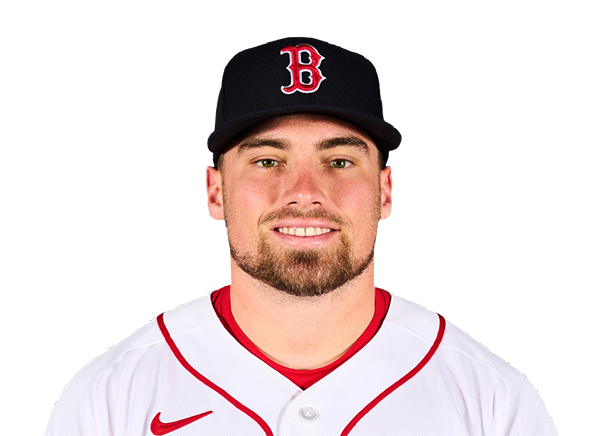 Caleb Durbin | 104-409 | 409 | 104 | 62 | 12 | 16 | 62 | .254 |
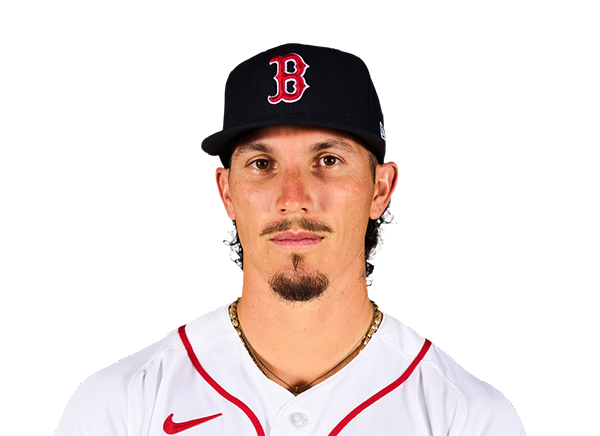 Jarren Duran | 96-460 | 460 | 96 | 62 | 17 | 18 | 143 | .209 |
 Andruw Monasterio | 67-260 | 260 | 67 | 38 | 6 | 4 | 56 | .258 |
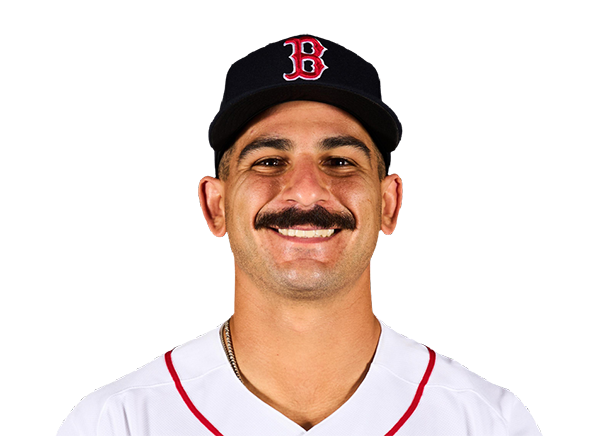 Mickey Gasper | 30-120 | 120 | 30 | 15 | 3 | 0 | 22 | .250 |
San Francisco Giants
| Player | IP | H | R | ER | BB | K | HR | PC-ST | ERA | PC |
|---|---|---|---|---|---|---|---|---|---|---|
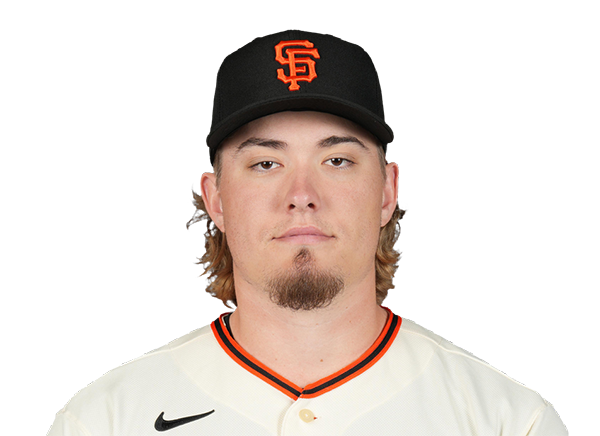 Blade Tidwell | --.-- | -- | -- | -- | -- | -- | -- | ----- | 4.33 | -- |
Boston Red Sox
| Player | IP | H | R | ER | BB | K | HR | PC-ST | ERA | PC |
|---|---|---|---|---|---|---|---|---|---|---|
 Patrick Sandoval | --.-- | -- | -- | -- | -- | -- | -- | ----- | 4.76 | -- |
H2H / Season Series
BOS6–4
SF
Last 5 Games
| Date | Opponent | Result |
|---|---|---|
| Aug 21 | @ BOS | L4–6 |
| Aug 20 |  @ CLE | L2–5 |
| Aug 19 | @ CLE | W1–0 |
| Aug 18 | @ CLE | L1–8 |
| Aug 16 |  vs COL | L7–13 |
| Date | Opponent | Result |
|---|---|---|
| Aug 21 | vs SF | W6–4 |
| Aug 19 |  vs ARI | L6–7 |
| Aug 18 | vs ARI | W9–4 |
| Aug 17 | vs ARI | W11–1 |
| Aug 16 |  @ PIT | L3–8 |
Standings
American League
| Team | W | L | PCT | GB | DIFF | STRK |
|---|---|---|---|---|---|---|
1 Rays | 76 | 52 | .594 | - | +43 | L2 |
2 White Sox | 67 | 61 | .523 | 9 | +47 | W1 |
3 Astros | 65 | 64 | .504 | 11.5 | -42 | W1 |
4 Yankees | 73 | 56 | .566 | 3.5 | +95 | L1 |
| 5Red Sox | 69 | 59 | .539 | 7 | +97 | W1 |
6 Rangers | 64 | 65 | .496 | 12.5 | -45 | W2 |
7 Blue Jays | 64 | 67 | .489 | 13.5 | -50 | W1 |
8 Twins | 63 | 66 | .488 | 13.5 | -45 | L1 |
| 9Guardians | 63 | 66 | .488 | 13.5 | -15 | W2 |
10 Orioles | 62 | 67 | .481 | 14.5 | -34 | W1 |
11 Tigers | 61 | 67 | .477 | 15 | +79 | L3 |
12 Mariners | 61 | 68 | .473 | 15.5 | -45 | W1 |
13 Royals | 56 | 74 | .431 | 21 | -97 | W6 |
14 Angels | 51 | 78 | .395 | 25.5 | -71 | L1 |
15 Athletics | 49 | 80 | .380 | 27.5 | -189 | L5 |
National League
| Team | W | L | PCT | GB | DIFF | STRK |
|---|---|---|---|---|---|---|
1 Brewers | 81 | 49 | .623 | - | +163 | W3 |
2 Dodgers | 78 | 51 | .605 | 2.5 | +146 | W4 |
3 Braves | 75 | 55 | .577 | 6 | +108 | L2 |
4 Cubs | 74 | 55 | .574 | 6.5 | +99 | L2 |
5 Phillies | 71 | 58 | .550 | 9.5 | +16 | W7 |
6 Padres | 69 | 60 | .535 | 11.5 | +7 | W1 |
| 7Diamondbacks | 68 | 61 | .527 | 12.5 | +13 | W2 |
8 Cardinals | 66 | 64 | .508 | 15 | +9 | L1 |
9 Marlins | 65 | 64 | .504 | 15.5 | +15 | W1 |
| 10Pirates | 63 | 67 | .485 | 18 | +30 | L1 |
11 Reds | 61 | 68 | .473 | 19.5 | -98 | L2 |
12 Nationals | 61 | 69 | .469 | 20 | +16 | L2 |
13 Mets | 58 | 71 | .450 | 22.5 | -44 | L1 |
| 14Giants | 52 | 76 | .406 | 28 | -78 | L2 |
| 15Rockies | 50 | 78 | .391 | 30 | -130 | L4 |
SF
VS
BOS
Pitchers
Blade Tidwell
Catchers
Andrew Knizner
Infielders
Willy Adames
Bryce Eldridge
Osleivis Basabe
Christian Koss
Outfielders
Victor Bericoto
Jung Hoo Lee
Drew Gilbert
Designated Hitters
Rafael Devers
Pitchers
Patrick Sandoval
Catchers
Adley Rutschman
Infielders
Nick Sogard
Willson Contreras
Caleb Durbin
Andruw Monasterio
Outfielders
Ceddanne Rafaela
Wilyer Abreu
Jarren Duran
Designated Hitters
Mickey Gasper
Giants
VS
Red Sox
Batting
128
Team Games Played
128
4346
At Bats
4288
1074
Hits
1075
497
Runs Batted In
556
141
Home Runs
132
56
Stolen Bases
96
.247
Batting Average
.251
517
Runs
581
214
Doubles
232
24
Triples
20
1759
Total Bases
1743
338
Walks
409
1019
Strikeouts
1037
.305
On Base Percentage
.324
.405
Slugging Percentage
.406
.710
OBP Pct + SLG Pct
.730
128
Games Played
128
128
Games Started
128
41
Hit By Pitch
75
0.0
Wins Above Replacement
0.0
0.0
Offensive Wins Above Replacement
0.0
18
Caught Stealing
35
1
Is Qualified
1
540.2
Runs Created
577.1
4.3
Runs Created Per 27 Outs
4.6
.071
Walks Per Plate Appearance
.084
0.33
Walk To Strikeout Ratio
0.39
.158
Isolated Power
.156
.244
Secondary Average
.265
3.86
Pitches Per Plate Appearance
3.83
379
Extra Base Hits
384
4783
Plate Appearances
4848
30.8
At Bats Per Home Run
32.5
22
Sacrifice Hit
29
36
Sacrifice Flies
45
Pitching
128
Team Games Played
128
45
Quality Starts
52
52
Wins
69
76
Losses
59
24
Saves
35
61
Holds
79
1053
Hits
1025
546
Earned runs
446
118
Home Runs
123
481
Walks
363
962
Strikeouts
1095
7.7
Strikeouts Per 9 Innings
8.7
147.6
Pitches Per Start
139.6
1.36
Walks Plus Hits Per Inning Pitched
1.22
4.36
Earned Run Average
3.53
76
Losses
59
1128.0
Innings pitched
1138.1
.406
Win Percentage
.539
43
Save Opportunities
46
.247
Opponent Batting Average
.239
.329
Opponent's On-base pct.
.304
.387
Opponent's Slugging pct.
.376
.716
Opponent's OPB Pct + SLG Pct
.680
4257
At Bats
4286
186
Doubles
201
28
Triples
8
55
Batters Hit
50
104
Stolen Bases
86
128
Games Played
128
1
Complete Games
0
9
Shutouts
13
47
Wild Pitches
27
559
Runs Batted In
467
4
Balks
3
1128.0
Innings pitched
1138.1
7.7
Strikeouts Per 9 Innings
8.7
34
Caught Stealing
17
128
Games Started
128
0.0
Wins Above Replacement
0.0
1
Is Qualified
1
595
Runs
484
546
Earned Runs
446
1649
Total Bases
1611
Fielding
128
Team Games Played
128
1128
Full Innings
1138
4675
Total Chances
4594
3384
Putouts
3415
1207
Assists
1117
84
Errors
62
214
Double Plays
232
0.982
Fielding Percentage
0.987
36.6
Range Factor
35.8
0.0
Zone Rating
0.0
128
Games Played
128
0
Games Started
0
0.0
Defensive Wins Above Replacement
0.0
1
Qualified
1