

Mets vs Blue Jays Live Score (1 Jul, 2026)
Game Information
Stage
Standard
Season
2026
First Pitch
Wed, Jul 1, 3:07 pm
Venue
Rogers Centre
Location
Toronto, Ontario
Attendance
41,842
Live Situation
0Balls
3Strikes
0Outs
—Pitcher
—At Bat
Pitch Sequence
1
STRIKE FOUL
Sinker
92 MPH
2
STRIKE SWINGING
Four-seam FB
93 MPH
3
STRIKE SWINGING
Cutter
85 MPH
Injury Report

Team Stats
 NYM
TOR


3
Runs
9
5
Hits
12
0
Errors
0
2
Home Runs
2
2
Walks
5
11
Strikeouts
7
Player Box Score
New York Mets
| Player | H-AB | AB | R | H | RBI | HR | BB | K | #P | AVG | OBP | SLG |
|---|---|---|---|---|---|---|---|---|---|---|---|---|
 Carson Benge | 2-4 | 4 | 1 | 2 | 2 | 1 | 0 | 0 | 20 | .259 | .318 | .402 |
 Juan Soto | 0-4 | 4 | 0 | 0 | 0 | 0 | 0 | 1 | 18 | .293 | .403 | .554 |
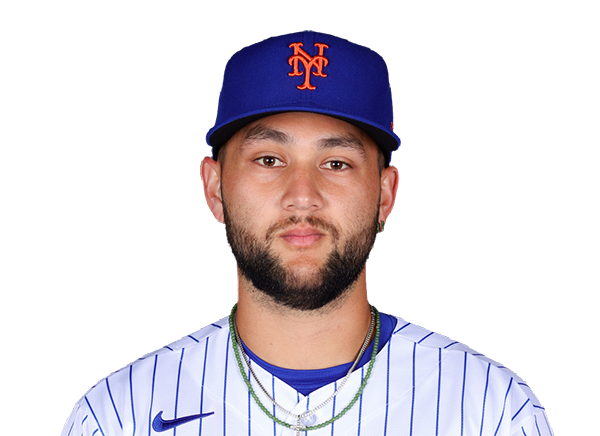 Bo Bichette | 0-2 | 2 | 0 | 0 | 0 | 0 | 1 | 1 | 13 | .250 | .296 | .379 |
 Ronny Mauricio | 0-1 | 1 | 0 | 0 | 0 | 0 | 0 | 1 | 4 | .178 | .178 | .267 |
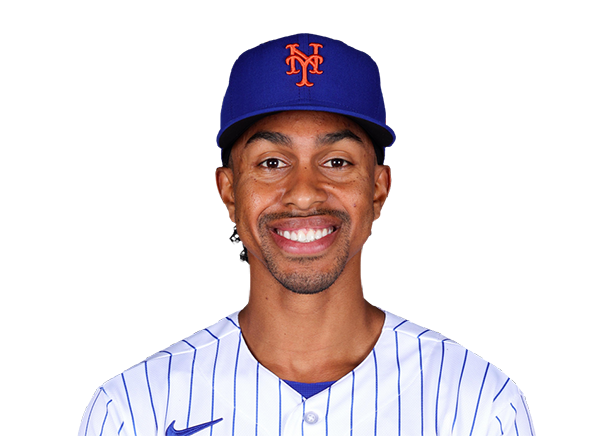 Francisco Lindor | 1-3 | 3 | 1 | 1 | 1 | 1 | 1 | 1 | 16 | .216 | .300 | .388 |
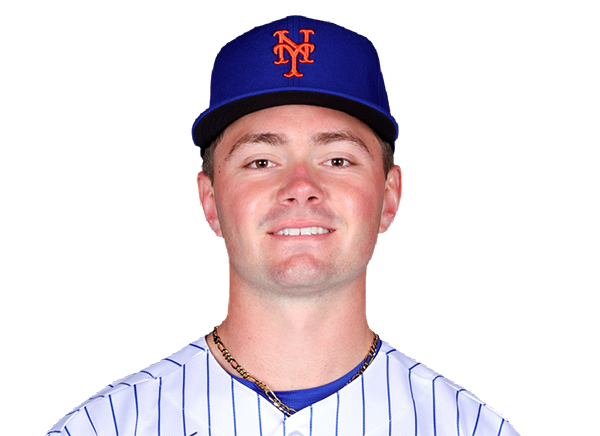 A.J. Ewing | 0-4 | 4 | 0 | 0 | 0 | 0 | 0 | 1 | 14 | .268 | .352 | .401 |
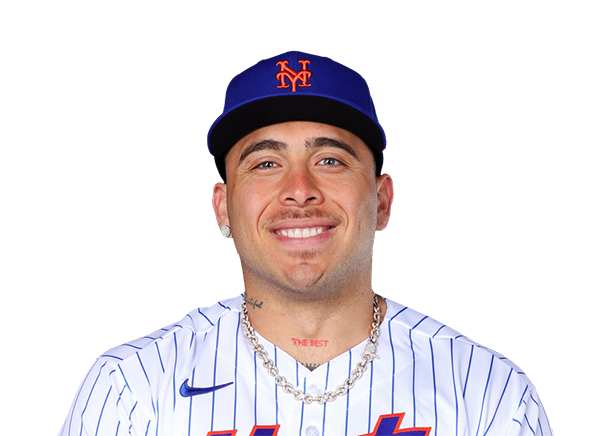 Francisco Alvarez | 0-4 | 4 | 0 | 0 | 0 | 0 | 0 | 3 | 16 | .245 | .307 | .429 |
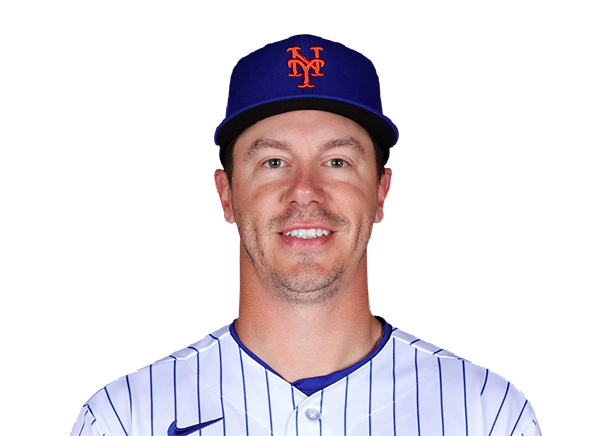 Jared Young | 0-3 | 3 | 0 | 0 | 0 | 0 | 0 | 2 | 12 | .228 | .299 | .421 |
 Brett Baty | 1-3 | 3 | 1 | 1 | 0 | 0 | 0 | 1 | 9 | .211 | .295 | .295 |
 Tyrone Taylor | 1-3 | 3 | 0 | 1 | 0 | 0 | 0 | 0 | 11 | .206 | .229 | .333 |
Toronto Blue Jays
| Player | H-AB | AB | R | H | RBI | HR | BB | K | #P | AVG | OBP | SLG |
|---|---|---|---|---|---|---|---|---|---|---|---|---|
 Nathan Lukes | 2-5 | 5 | 1 | 2 | 0 | 0 | 0 | 1 | 27 | .299 | .348 | .419 |
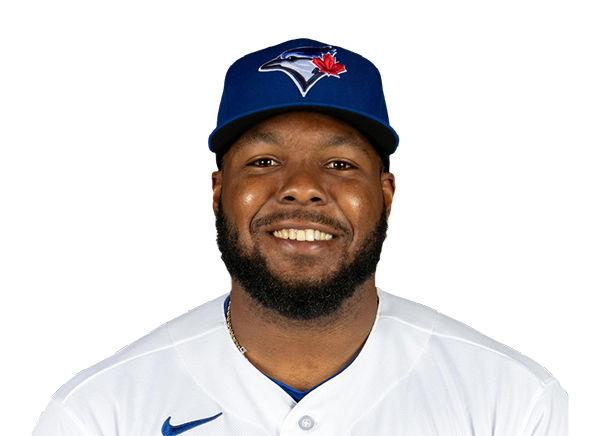 Vladimir Guerrero Jr. | 1-4 | 4 | 1 | 1 | 0 | 0 | 1 | 2 | 22 | .267 | .348 | .350 |
 Kazuma Okamoto | 2-3 | 3 | 1 | 2 | 1 | 0 | 1 | 0 | 18 | .240 | .323 | .464 |
 Daulton Varsho | 1-4 | 4 | 1 | 1 | 1 | 0 | 0 | 0 | 9 | .258 | .327 | .423 |
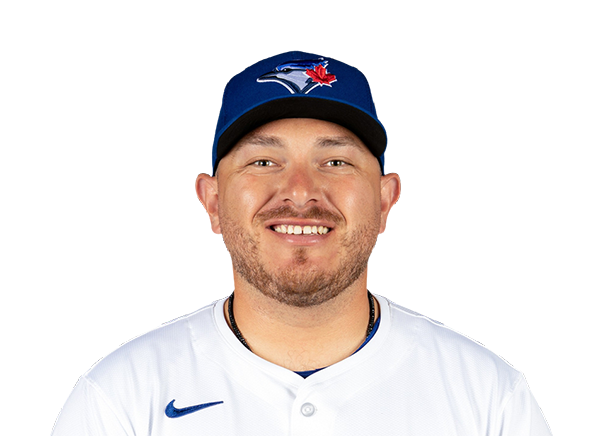 Alejandro Kirk | 2-2 | 2 | 2 | 2 | 0 | 0 | 2 | 0 | 16 | .212 | .274 | .333 |
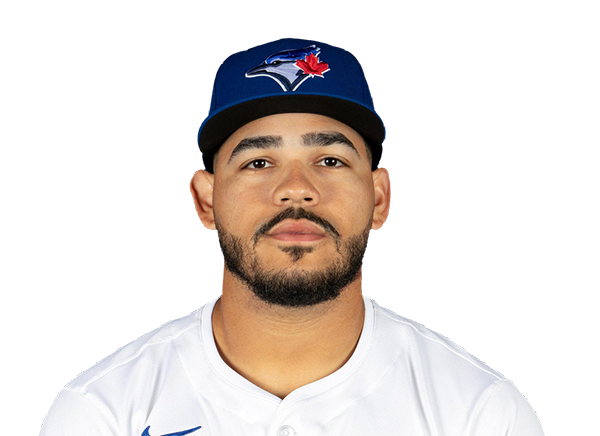 Yohendrick Pinango | 0-3 | 3 | 0 | 0 | 0 | 0 | 0 | 0 | 8 | .268 | .311 | .423 |
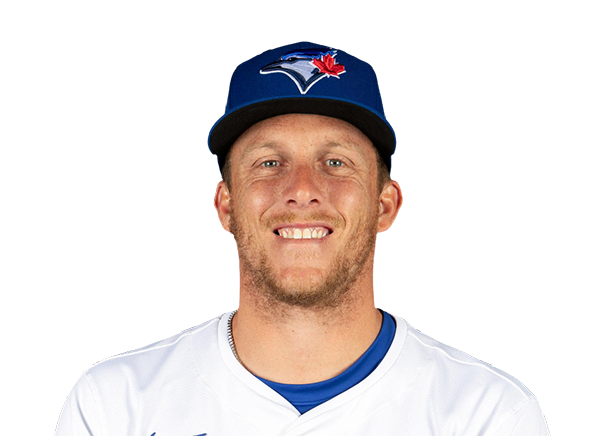 Myles Straw | 1-1 | 1 | 1 | 1 | 3 | 1 | 0 | 0 | 2 | .239 | .300 | .351 |
 Ernie Clement | 2-4 | 4 | 1 | 2 | 1 | 0 | 0 | 1 | 19 | .299 | .322 | .439 |
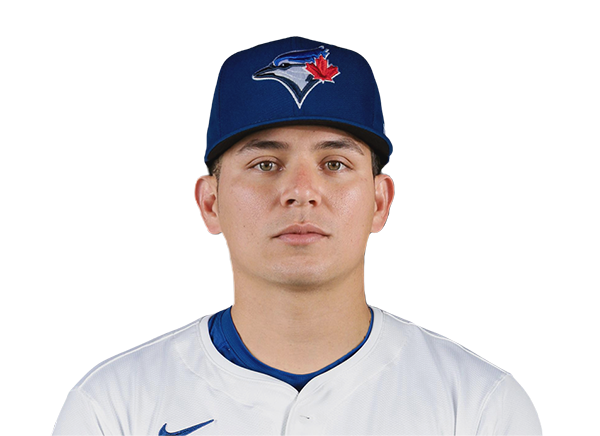 Luis Urias | 0-0 | 0 | 0 | 0 | 0 | 0 | 0 | 0 | 0 | .400 | .500 | .667 |
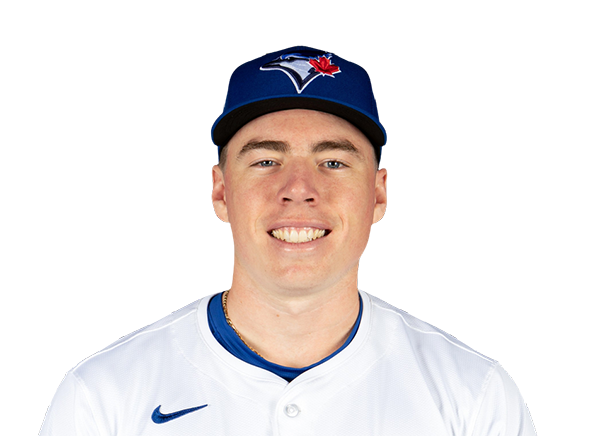 Sean Keys | 1-4 | 4 | 1 | 1 | 3 | 1 | 0 | 2 | 15 | .167 | .167 | .417 |
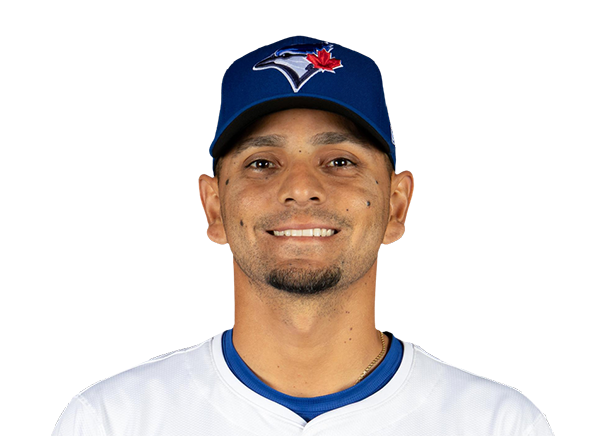 Andres Gimenez | 0-3 | 3 | 0 | 0 | 0 | 0 | 1 | 1 | 15 | .237 | .282 | .372 |
New York Mets
| Player | IP | H | R | ER | BB | K | HR | PC-ST | ERA | PC |
|---|---|---|---|---|---|---|---|---|---|---|
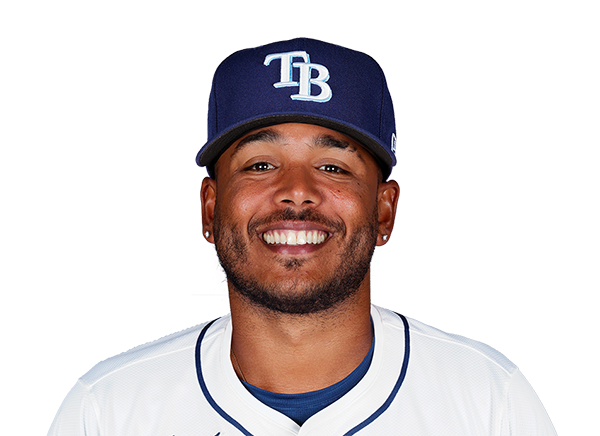 Freddy Peralta | 4.0 | 7 | 5 | 5 | 3 | 4 | 1 | 91-52 | 4.81 | 91 |
 Joey Gerber | 1.1 | 0 | 0 | 0 | 1 | 0 | 0 | 16-9 | 1.23 | 16 |
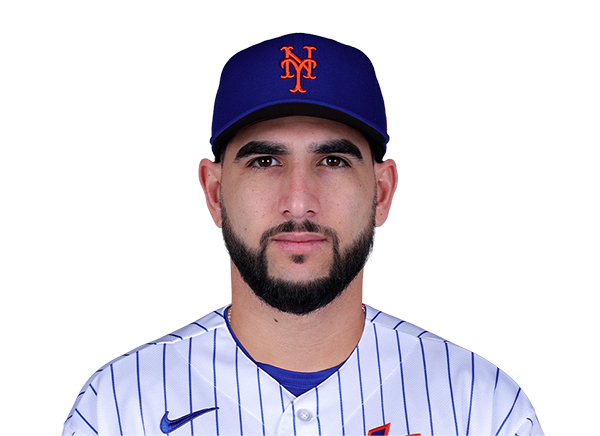 Cionel Perez | 1.1 | 5 | 4 | 4 | 1 | 2 | 1 | 30-20 | 5.73 | 30 |
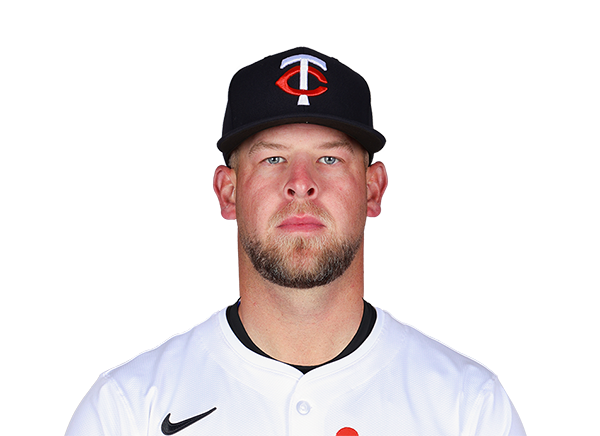 A.J. Minter | 1.1 | 0 | 0 | 0 | 0 | 1 | 0 | 14-10 | 0.00 | 14 |
Toronto Blue Jays
| Player | IP | H | R | ER | BB | K | HR | PC-ST | ERA | PC |
|---|---|---|---|---|---|---|---|---|---|---|
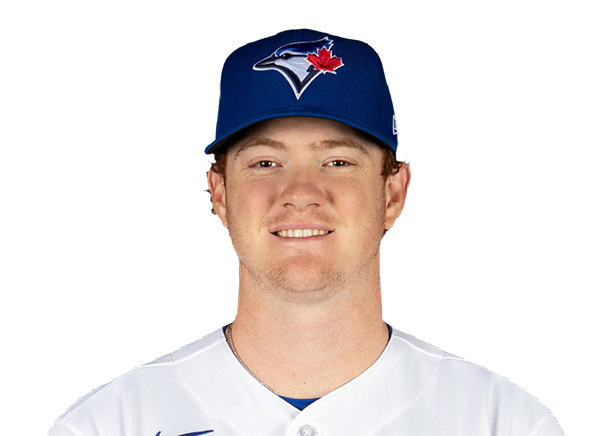 Braydon Fisher | 1.0 | 0 | 0 | 0 | 1 | 1 | 0 | 14-7 | 3.40 | 14 |
 Spencer Miles | 3.0 | 1 | 0 | 0 | 1 | 5 | 0 | 46-34 | 2.83 | 46 |
 Patrick Corbin | 5.0 | 4 | 3 | 3 | 0 | 5 | 2 | 73-48 | 5.11 | 73 |
H2H / Season Series
TOR9–3
NYM
TOR0–3
NYM
TOR2–1
NYM
NYM8–1
TOR
TOR3–4
NYM
Last 5 Games
| Date | Opponent | Result |
|---|---|---|
| Aug 22 |  @ CHW | W10–5 |
| Aug 21 | @ CHW | L4–6 |
| Aug 19 |  vs SD | W4–2 |
| Aug 18 | vs SD | L2–5 |
| Aug 17 | vs SD | W2–1 |
| Date | Opponent | Result |
|---|---|---|
| Aug 22 |  @ NYY | W4–3 |
| Aug 21 | @ NYY | L1–3 |
| Aug 20 |  @ TB | W5–1 |
| Aug 19 | @ TB | L6–7 |
| Aug 18 | @ TB | W10–5 |
Standings
American League
| Team | W | L | PCT | GB | DIFF | STRK |
|---|---|---|---|---|---|---|
| 1Rays | 76 | 53 | .589 | - | +42 | L3 |
| 2White Sox | 67 | 62 | .519 | 9 | +42 | L1 |
3 Astros | 65 | 65 | .500 | 11.5 | -43 | L1 |
| 4Yankees | 73 | 56 | .566 | 3 | +95 | L1 |
5 Red Sox | 70 | 59 | .543 | 6 | +98 | W2 |
6 Rangers | 64 | 66 | .492 | 12.5 | -48 | L1 |
7 Guardians | 64 | 66 | .492 | 12.5 | -14 | W3 |
| 8Blue Jays | 64 | 67 | .489 | 13 | -50 | W1 |
9 Twins | 63 | 67 | .485 | 13.5 | -47 | L2 |
10 Orioles | 63 | 67 | .485 | 13.5 | -33 | W2 |
11 Mariners | 62 | 68 | .477 | 14.5 | -44 | W2 |
12 Tigers | 61 | 68 | .473 | 15 | +77 | L4 |
13 Royals | 57 | 74 | .435 | 20 | -95 | W7 |
14 Angels | 52 | 78 | .400 | 24.5 | -68 | W1 |
15 Athletics | 50 | 80 | .385 | 26.5 | -188 | W1 |
National League
| Team | W | L | PCT | GB | DIFF | STRK |
|---|---|---|---|---|---|---|
1 Brewers | 81 | 49 | .623 | - | +163 | W3 |
2 Dodgers | 79 | 51 | .608 | 2 | +147 | W5 |
3 Braves | 75 | 55 | .577 | 6 | +108 | L2 |
4 Cubs | 74 | 56 | .569 | 7 | +98 | L3 |
5 Phillies | 72 | 58 | .554 | 9 | +25 | W8 |
| 6Padres | 70 | 60 | .538 | 11 | +9 | W2 |
7 Diamondbacks | 68 | 62 | .523 | 13 | +7 | L1 |
8 Marlins | 66 | 64 | .508 | 15 | +17 | W2 |
9 Cardinals | 66 | 65 | .504 | 15.5 | 0 | L2 |
10 Pirates | 63 | 68 | .481 | 18.5 | +29 | L2 |
11 Reds | 62 | 68 | .477 | 19 | -92 | W1 |
12 Nationals | 61 | 70 | .466 | 20.5 | +14 | L3 |
| 13Mets | 59 | 71 | .454 | 22 | -39 | W1 |
14 Giants | 52 | 77 | .403 | 28.5 | -79 | L3 |
15 Rockies | 50 | 79 | .388 | 30.5 | -131 | L5 |
NYM
VS
TOR
Pitchers
Freddy Peralta
Joey Gerber
Cionel Perez
A.J. Minter
Catchers
Francisco Alvarez
Infielders
Bo Bichette
Ronny Mauricio
Francisco Lindor
Jared Young
Brett Baty
Outfielders
Carson Benge
A.J. Ewing
Tyrone Taylor
Designated Hitters
Juan Soto
Pitchers
Braydon Fisher
Spencer Miles
Patrick Corbin
Catchers
Alejandro Kirk
Infielders
Vladimir Guerrero Jr.
Kazuma Okamoto
Ernie Clement
Luis Urias
Andres Gimenez
Outfielders
Nathan Lukes
Daulton Varsho
Yohendrick Pinango
Myles Straw
Designated Hitters
Sean Keys
Mets
VS
Blue Jays
Batting
130
Team Games Played
131
4370
At Bats
4423
1033
Hits
1087
522
Runs Batted In
495
161
Home Runs
124
68
Stolen Bases
65
.236
Batting Average
.246
545
Runs
518
163
Doubles
207
17
Triples
8
1713
Total Bases
1682
417
Walks
360
1102
Strikeouts
956
.307
On Base Percentage
.307
.392
Slugging Percentage
.380
.699
OBP Pct + SLG Pct
.687
130
Games Played
131
130
Games Started
131
42
Hit By Pitch
46
0.0
Wins Above Replacement
0.0
0.0
Offensive Wins Above Replacement
0.0
28
Caught Stealing
14
1
Is Qualified
1
529.2
Runs Created
518.7
4.1
Runs Created Per 27 Outs
4.0
.085
Walks Per Plate Appearance
.074
0.38
Walk To Strikeout Ratio
0.38
.156
Isolated Power
.135
.260
Secondary Average
.227
3.93
Pitches Per Plate Appearance
3.80
341
Extra Base Hits
339
4880
Plate Appearances
4892
27.1
At Bats Per Home Run
35.7
16
Sacrifice Hit
21
31
Sacrifice Flies
39
Pitching
130
Team Games Played
131
37
Quality Starts
40
59
Wins
64
71
Losses
67
25
Saves
44
57
Holds
85
1040
Hits
1040
525
Earned runs
512
144
Home Runs
134
465
Walks
479
1173
Strikeouts
1139
9.1
Strikeouts Per 9 Innings
8.8
148.8
Pitches Per Start
148.9
1.30
Walks Plus Hits Per Inning Pitched
1.30
4.08
Earned Run Average
3.95
71
Losses
67
1157.1
Innings pitched
1166.1
.454
Win Percentage
.489
39
Save Opportunities
59
.237
Opponent Batting Average
.238
.318
Opponent's On-base pct.
.315
.394
Opponent's Slugging pct.
.374
.712
Opponent's OPB Pct + SLG Pct
.690
4380
At Bats
4367
216
Doubles
174
19
Triples
9
65
Batters Hit
33
56
Stolen Bases
126
130
Games Played
131
0
Complete Games
1
5
Shutouts
8
32
Wild Pitches
41
558
Runs Batted In
540
3
Balks
5
1157.1
Innings pitched
1166.1
9.1
Strikeouts Per 9 Innings
8.8
27
Caught Stealing
39
130
Games Started
131
0.0
Wins Above Replacement
0.0
1
Is Qualified
1
584
Runs
568
525
Earned Runs
512
1726
Total Bases
1634
Fielding
130
Team Games Played
131
1157
Full Innings
1166
4577
Total Chances
4696
3472
Putouts
3499
1023
Assists
1118
82
Errors
79
163
Double Plays
207
0.982
Fielding Percentage
0.983
35.0
Range Factor
35.6
0.0
Zone Rating
0.0
130
Games Played
131
0
Games Started
0
0.0
Defensive Wins Above Replacement
0.0
1
Qualified
1