

Mets vs Pirates Live Score (8 Aug, 2026)
Game Information
Stage
Standard
Season
2026
First Pitch
Sat, Aug 8, 6:40 pm
Venue
PNC Park
Location
Pittsburgh, Pennsylvania
Attendance
30,121
Home Runs
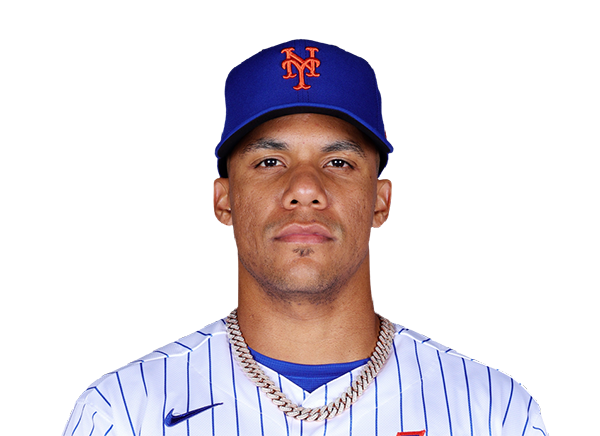
Juan Soto
21 HR
.283 AVG
52 RBI
Brandon Lowe
24 HR
.254 AVG
73 RBI

Batting Average
Carson Benge
.270 AVG
.330 OBP
.412 SLG

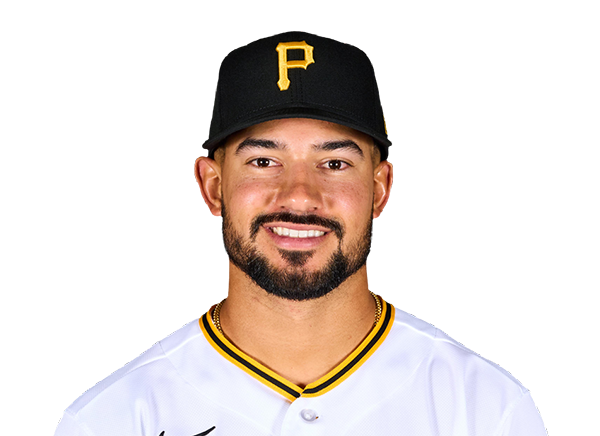
Nick Gonzales
.311 AVG
.364 OBP
.402 SLG
Runs Batted In
Bo Bichette
56 RBI
11 HR
.256 AVG
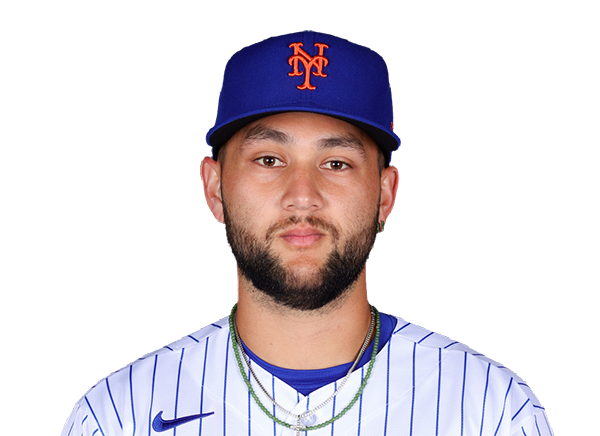
Brandon Lowe
73 RBI
24 HR
.254 AVG
Earned Run Average
Nolan McLean
3.51 ERA
8 W
156 K

Paul Skenes
3.96 ERA
9 W
162 K

Wins
Nolan McLean
8 W
3.51 ERA
156 K
Braxton Ashcraft
11 W
4.08 ERA
145 K

Strikeouts
Nolan McLean
156 K
8 W
3.51 ERA
Paul Skenes
162 K
9 W
3.96 ERA
Injury Report

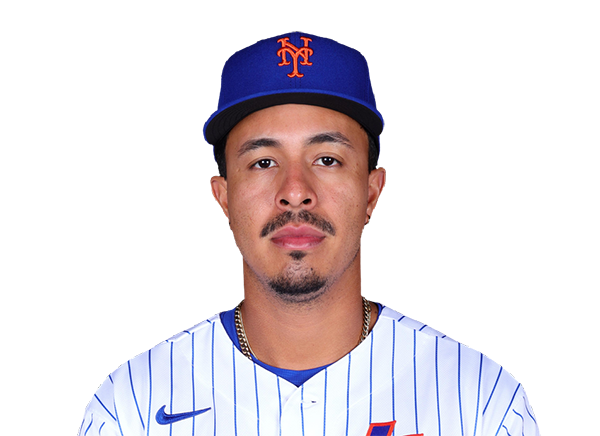
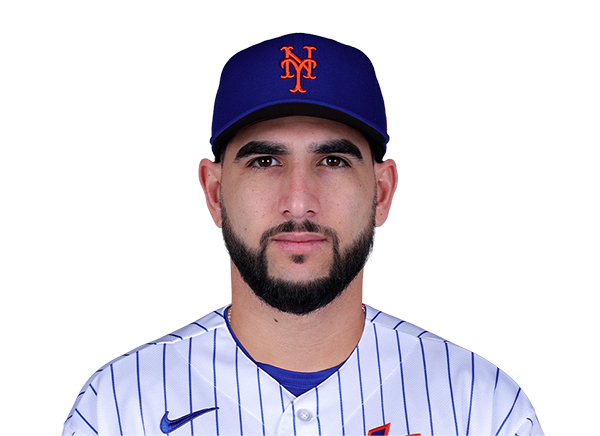
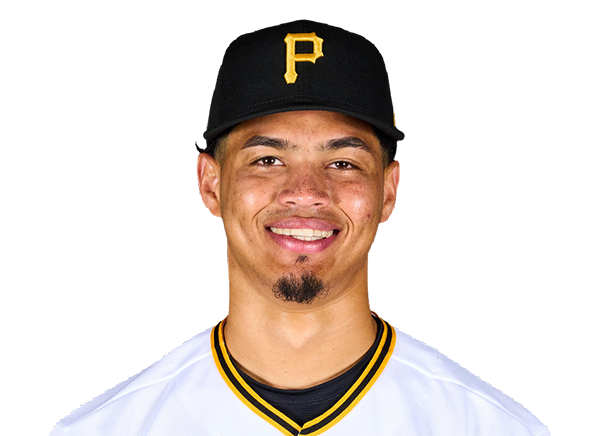

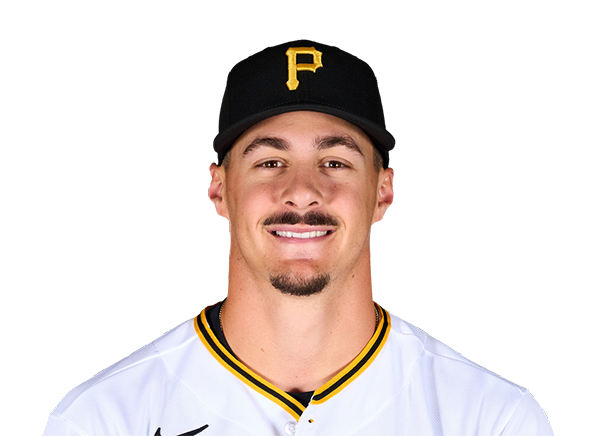


Team Stats
 NYM
PIT


Array
Runs
Array
3
Hits
12
1
Errors
0
—
Home Runs
—
—
Walks
—
—
Strikeouts
—
Standings
American League
| Team | W | L | PCT | GB | DIFF | STRK |
|---|---|---|---|---|---|---|
1 Rays | 77 | 53 | .592 | - | +44 | W1 |
2 White Sox | 68 | 62 | .523 | 9 | +43 | W1 |
3 Astros | 65 | 66 | .496 | 12.5 | -44 | L2 |
4 Yankees | 74 | 56 | .569 | 3 | +100 | W1 |
5 Red Sox | 71 | 59 | .546 | 6 | +99 | W3 |
6 Rangers | 65 | 66 | .496 | 12.5 | -46 | W1 |
7 Guardians | 65 | 66 | .496 | 12.5 | -9 | W4 |
8 Blue Jays | 64 | 68 | .485 | 14 | -55 | L1 |
9 Twins | 63 | 68 | .481 | 14.5 | -54 | L3 |
10 Orioles | 63 | 68 | .481 | 14.5 | -35 | L1 |
11 Mariners | 62 | 68 | .477 | 15 | -44 | W2 |
12 Tigers | 61 | 69 | .469 | 16 | +73 | L5 |
13 Royals | 58 | 74 | .439 | 20 | -91 | W8 |
14 Angels | 52 | 79 | .397 | 25.5 | -70 | L1 |
15 Athletics | 51 | 80 | .389 | 26.5 | -187 | W2 |
National League
| Team | W | L | PCT | GB | DIFF | STRK |
|---|---|---|---|---|---|---|
1 Brewers | 81 | 49 | .623 | - | +163 | W3 |
2 Dodgers | 80 | 51 | .611 | 1.5 | +151 | W6 |
3 Braves | 75 | 55 | .577 | 6 | +108 | L2 |
4 Cubs | 74 | 56 | .569 | 7 | +98 | L3 |
5 Phillies | 73 | 58 | .557 | 8.5 | +27 | W9 |
6 Padres | 71 | 60 | .542 | 10.5 | +16 | W3 |
7 Diamondbacks | 69 | 62 | .527 | 12.5 | +9 | W1 |
8 Marlins | 67 | 64 | .511 | 14.5 | +21 | W3 |
9 Cardinals | 66 | 66 | .500 | 16 | -2 | L3 |
| 10Pirates | 63 | 69 | .477 | 19 | +25 | L3 |
11 Reds | 62 | 69 | .473 | 19.5 | -94 | L1 |
12 Nationals | 61 | 71 | .462 | 21 | +10 | L4 |
| 13Mets | 59 | 72 | .450 | 22.5 | -40 | L1 |
14 Giants | 52 | 78 | .400 | 29 | -80 | L4 |
15 Rockies | 50 | 80 | .385 | 31 | -136 | L6 |
NYM
VS
PIT
Pitchers
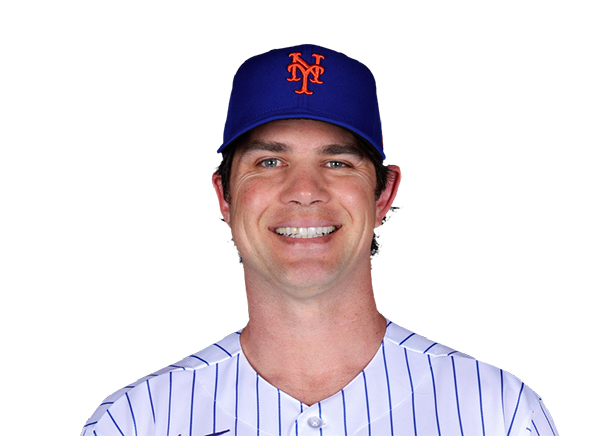
Robert Stock
Catchers
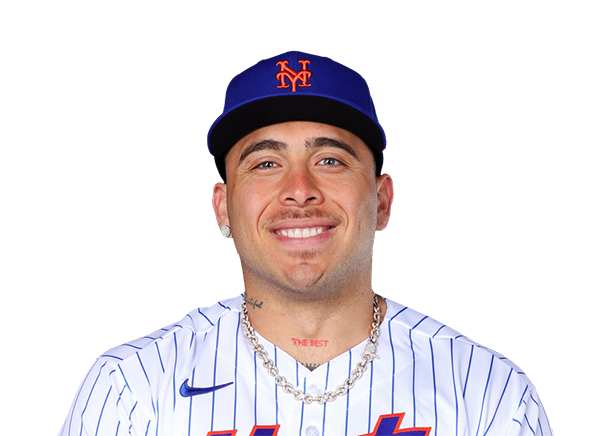
Francisco Alvarez
Infielders
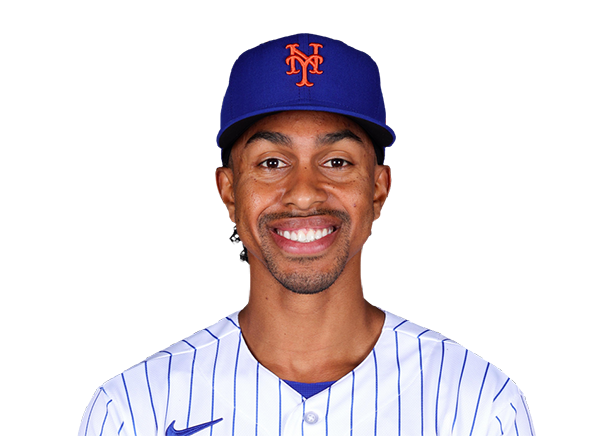
Francisco Lindor
Bo Bichette

Jared Young

Marcus Semien
Outfielders

A.J. Ewing
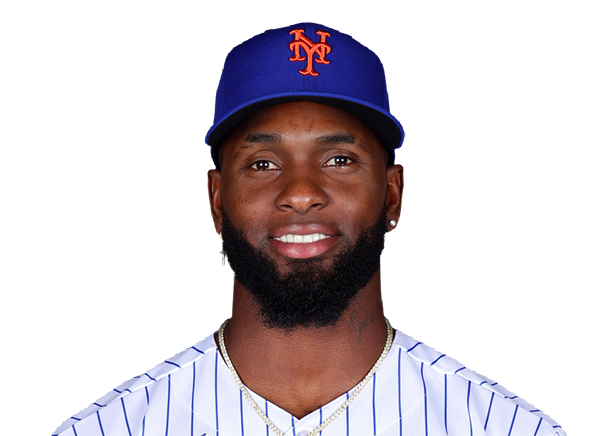
Luis Robert Jr.

Brett Baty
Designated Hitters
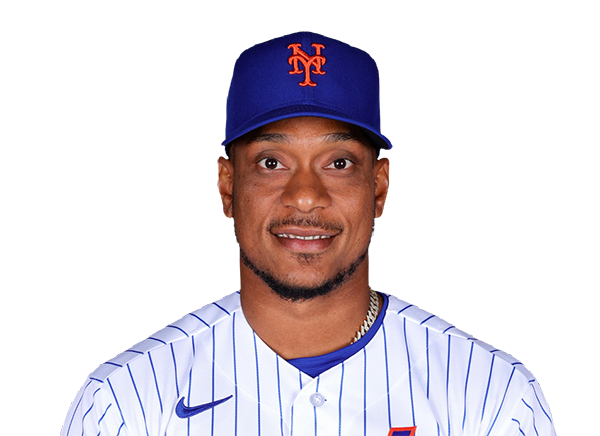
Jorge Polanco
Pitchers

Bubba Chandler
Catchers
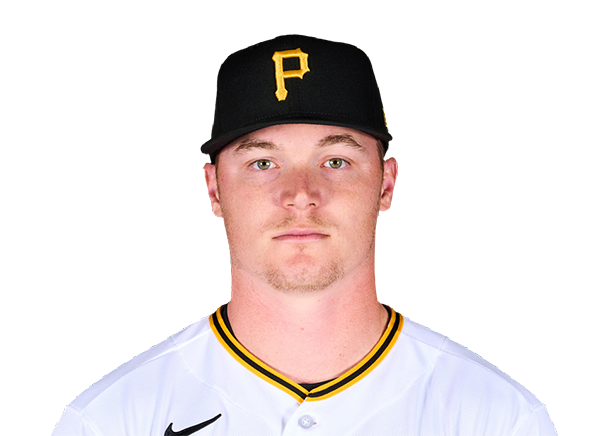
Henry Davis
Infielders
Brandon Lowe

Spencer Horwitz
Nick Gonzales
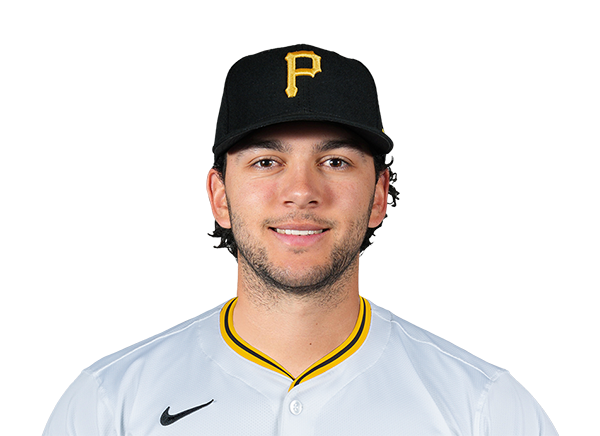
Jacob Gonzalez
Outfielders

Jake Mangum

Ronny Simon
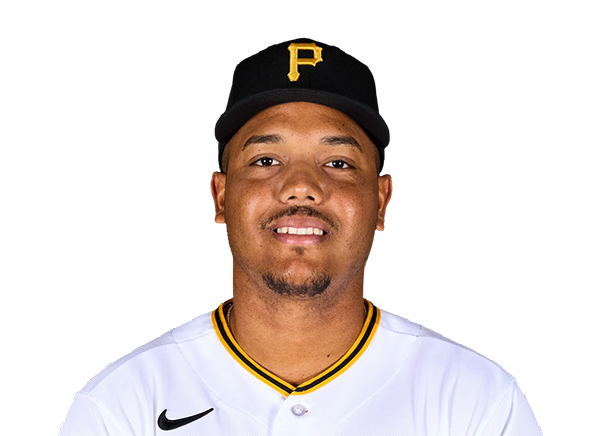
Esmerlyn Valdez
Designated Hitters

Bryan Reynolds
Mets
VS
Pirates
Batting
118
Team Games Played
119
3969
At Bats
4119
928
Hits
1060
465
Runs Batted In
575
141
Home Runs
144
63
Stolen Bases
103
.234
Batting Average
.257
488
Runs
601
147
Doubles
186
15
Triples
12
1528
Total Bases
1702
375
Walks
436
1005
Strikeouts
1122
.304
On Base Percentage
.335
.385
Slugging Percentage
.413
.689
OBP Pct + SLG Pct
.749
118
Games Played
119
118
Games Started
119
39
Hit By Pitch
62
0.0
Wins Above Replacement
0.0
0.0
Offensive Wins Above Replacement
0.0
25
Caught Stealing
20
1
Is Qualified
1
467.7
Runs Created
584.1
4.0
Runs Created Per 27 Outs
4.9
.085
Walks Per Plate Appearance
.094
0.37
Walk To Strikeout Ratio
0.39
.151
Isolated Power
.156
.255
Secondary Average
.282
3.93
Pitches Per Plate Appearance
3.91
303
Extra Base Hits
342
4431
Plate Appearances
4654
28.1
At Bats Per Home Run
28.6
16
Sacrifice Hit
6
28
Sacrifice Flies
28
Pitching
118
Team Games Played
119
32
Quality Starts
37
51
Wins
58
67
Losses
61
20
Saves
23
48
Holds
51
958
Hits
971
483
Earned runs
506
126
Home Runs
123
421
Walks
430
1062
Strikeouts
1103
9.1
Strikeouts Per 9 Innings
9.3
149.7
Pitches Per Start
151.1
1.31
Walks Plus Hits Per Inning Pitched
1.32
4.13
Earned Run Average
4.29
67
Losses
61
1051.2
Innings pitched
1062.2
.432
Win Percentage
.487
34
Save Opportunities
43
.240
Opponent Batting Average
.240
.319
Opponent's On-base pct.
.321
.394
Opponent's Slugging pct.
.392
.713
Opponent's OPB Pct + SLG Pct
.713
3999
At Bats
4042
205
Doubles
221
18
Triples
12
56
Batters Hit
64
55
Stolen Bases
77
118
Games Played
119
0
Complete Games
0
5
Shutouts
7
28
Wild Pitches
43
517
Runs Batted In
534
3
Balks
4
1051.2
Innings pitched
1062.2
9.1
Strikeouts Per 9 Innings
9.3
25
Caught Stealing
24
118
Games Started
119
0.0
Wins Above Replacement
0.0
1
Is Qualified
1
541
Runs
570
483
Earned Runs
506
1577
Total Bases
1585
Fielding
118
Team Games Played
119
1052
Full Innings
1063
4179
Total Chances
4189
3155
Putouts
3188
945
Assists
931
79
Errors
70
147
Double Plays
186
0.981
Fielding Percentage
0.983
35.1
Range Factor
34.9
0.0
Zone Rating
0.0
118
Games Played
119
0
Games Started
0
0.0
Defensive Wins Above Replacement
0.0
1
Qualified
1