

Orioles vs Blue Jays Live Score (11 Sep, 2026)
Game Information
Stage
STD
Season
2026
First Pitch
Fri, Sep 11, 7:07 pm
Venue
Rogers Centre
Location
Toronto, Ontario
Venue Type
Indoor
Broadcast
MLB.TV
Attendance
42,111
Live Situation
1Balls
2Strikes
0Outs
—Pitcher
—At Bat
Pitch Sequence
1
STRIKE FOUL
Curve
88 MPH
2
STRIKE FOUL
Curve
88 MPH
3
STRIKE FOUL
Curve
89 MPH
4
BALL
Curve
89 MPH
5
STRIKE FOUL
Slider
91 MPH
6
BALL IN PLAY
Curve
90 MPH
Injury Report



Team Stats
 BAL
TOR


7
Runs
4
11
Hits
10
1
Errors
0
2
Home Runs
2
2
Walks
3
12
Strikeouts
9
Player Box Score
Baltimore Orioles
| Player | H-AB | AB | R | H | RBI | HR | BB | K | #P | AVG | OBP | SLG |
|---|---|---|---|---|---|---|---|---|---|---|---|---|
 Dylan Beavers | 2-5 | 5 | 1 | 2 | 3 | 1 | 0 | 1 | 16 | .246 | .321 | .391 |
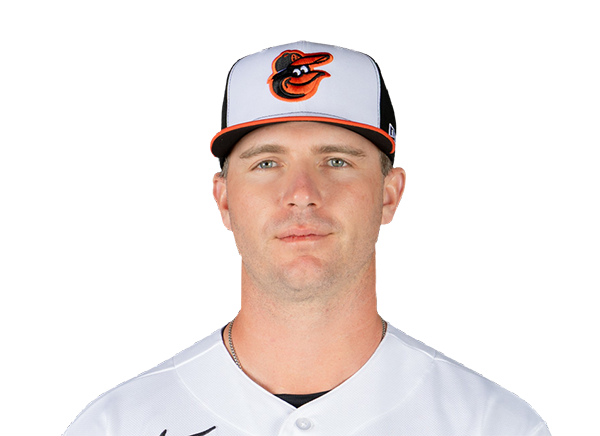 Pete Alonso | 0-5 | 5 | 0 | 0 | 0 | 0 | 0 | 2 | 27 | .266 | .360 | .494 |
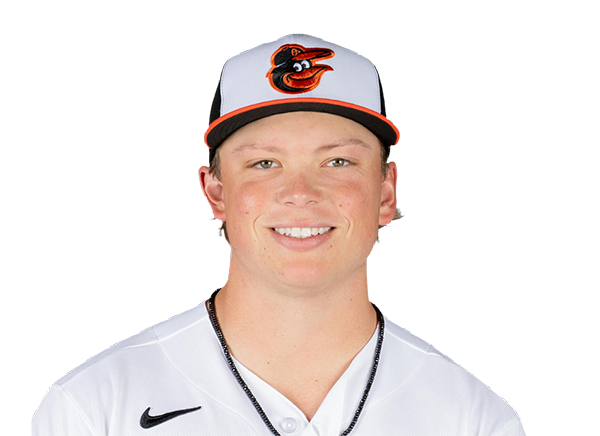 Jackson Holliday | 0-5 | 5 | 0 | 0 | 0 | 0 | 0 | 2 | 23 | .231 | .305 | .347 |
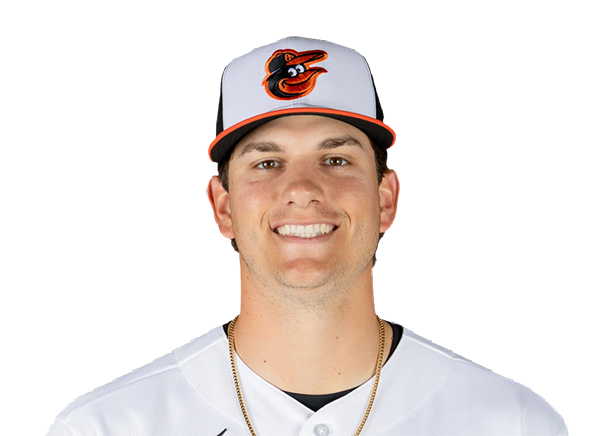 Coby Mayo | 1-5 | 5 | 1 | 1 | 1 | 1 | 0 | 1 | 13 | .223 | .289 | .468 |
 Gunnar Henderson | 2-4 | 4 | 1 | 2 | 0 | 0 | 0 | 1 | 20 | .221 | .304 | .396 |
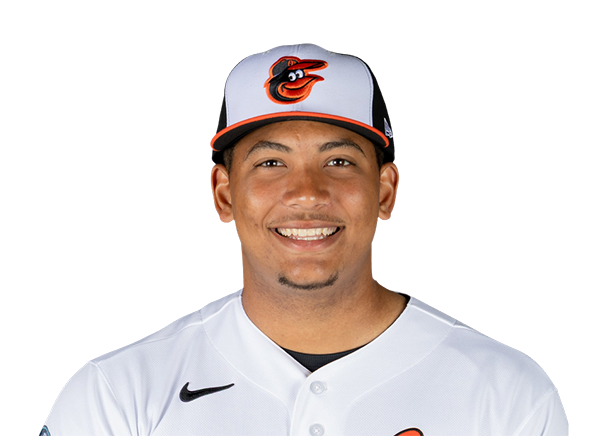 Samuel Basallo | 1-3 | 3 | 1 | 1 | 0 | 0 | 1 | 0 | 13 | .228 | .299 | .414 |
 Christian Encarnacion-Strand | 3-4 | 4 | 1 | 3 | 0 | 0 | 0 | 1 | 17 | .268 | .319 | .484 |
 Heston Kjerstad | 1-2 | 2 | 1 | 1 | 1 | 0 | 0 | 1 | 4 | .222 | .222 | .222 |
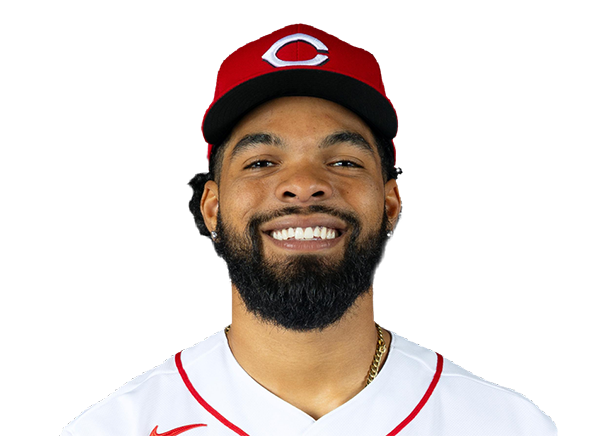 Rece Hinds | 0-1 | 1 | 0 | 0 | 0 | 0 | 0 | 1 | 5 | .163 | .224 | .256 |
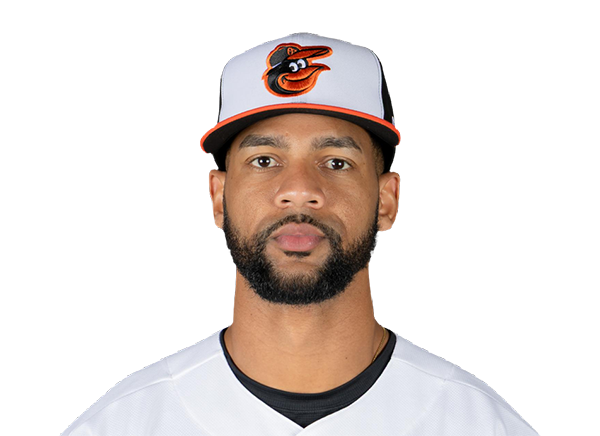 Leody Taveras | 0-1 | 1 | 0 | 0 | 0 | 0 | 0 | 0 | 2 | .219 | .291 | .348 |
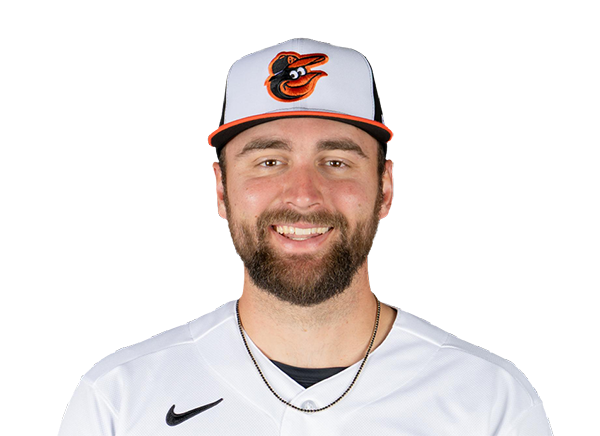 Colton Cowser | 1-3 | 3 | 1 | 1 | 2 | 0 | 1 | 2 | 20 | .214 | .308 | .367 |
Toronto Blue Jays
| Player | H-AB | AB | R | H | RBI | HR | BB | K | #P | AVG | OBP | SLG |
|---|---|---|---|---|---|---|---|---|---|---|---|---|
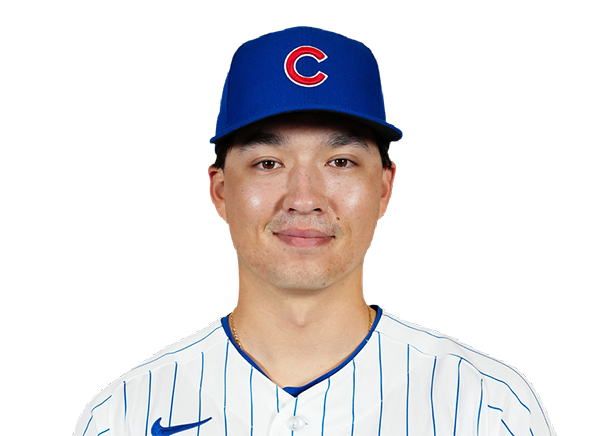 Brett Bateman | 3-5 | 5 | 1 | 3 | 2 | 1 | 0 | 1 | 24 | .339 | .402 | .424 |
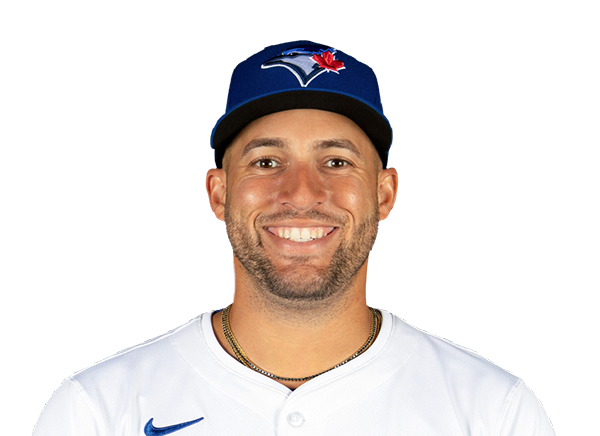 George Springer | 2-5 | 5 | 0 | 2 | 0 | 0 | 0 | 0 | 15 | .248 | .321 | .408 |
 Rudy Martin | 0-0 | 0 | 0 | 0 | 0 | 0 | 0 | 0 | 0 | .000 | .000 | .000 |
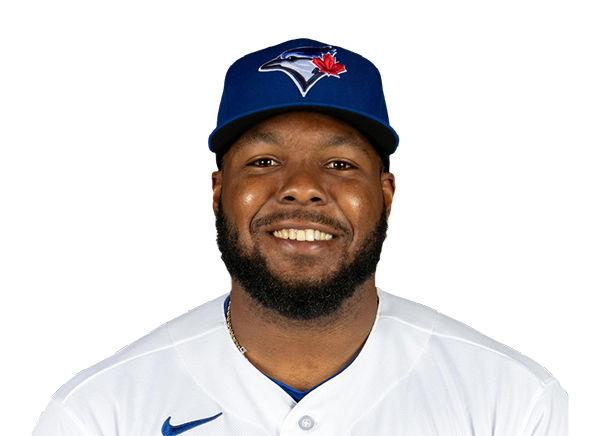 Vladimir Guerrero Jr. | 1-4 | 4 | 0 | 1 | 0 | 0 | 1 | 2 | 26 | .259 | .330 | .351 |
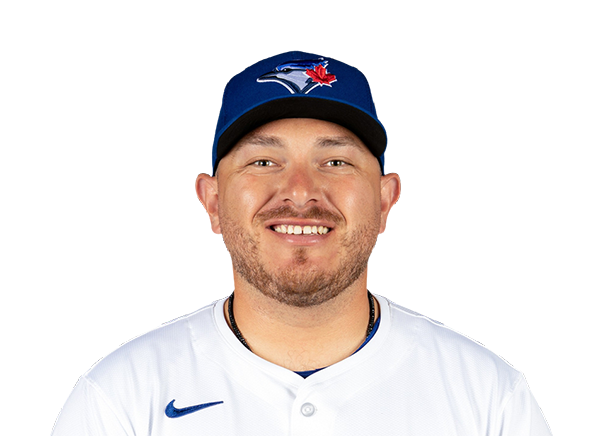 Alejandro Kirk | 0-3 | 3 | 0 | 0 | 0 | 0 | 2 | 1 | 24 | .273 | .347 | .413 |
 Nathan Lukes | 1-4 | 4 | 1 | 1 | 0 | 0 | 0 | 1 | 9 | .274 | .322 | .390 |
 Kazuma Okamoto | 2-4 | 4 | 1 | 2 | 1 | 1 | 0 | 1 | 15 | .234 | .307 | .459 |
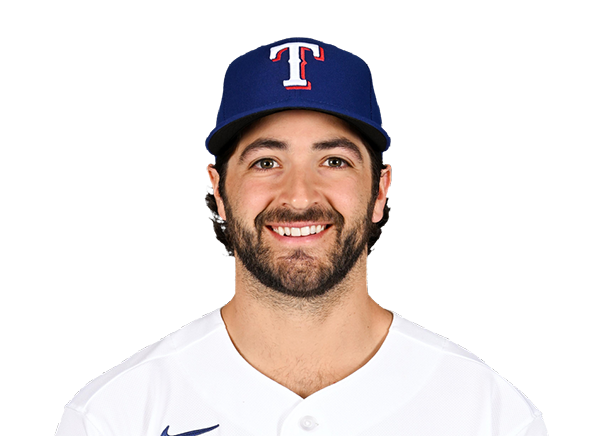 Josh Smith | 0-2 | 2 | 0 | 0 | 0 | 0 | 0 | 1 | 6 | .223 | .312 | .352 |
 Charles McAdoo | 0-1 | 1 | 0 | 0 | 0 | 0 | 0 | 1 | 8 | .247 | .295 | .346 |
 Sean Keys | 0-1 | 1 | 0 | 0 | 0 | 0 | 0 | 1 | 6 | .200 | .234 | .356 |
 Andres Gimenez | 0-4 | 4 | 0 | 0 | 1 | 0 | 0 | 0 | 20 | .242 | .288 | .358 |
 Ernie Clement | 1-4 | 4 | 1 | 1 | 0 | 0 | 0 | 0 | 9 | .273 | .300 | .383 |
Baltimore Orioles
| Player | IP | H | R | ER | BB | K | HR | PC-ST | ERA | PC |
|---|---|---|---|---|---|---|---|---|---|---|
 Chris Bassitt | 5.0 | 6 | 2 | 2 | 3 | 5 | 1 | 95-64 | 4.88 | 95 |
 Josh Walker | 1.1 | 0 | 0 | 0 | 0 | 1 | 0 | 15-9 | 1.80 | 15 |
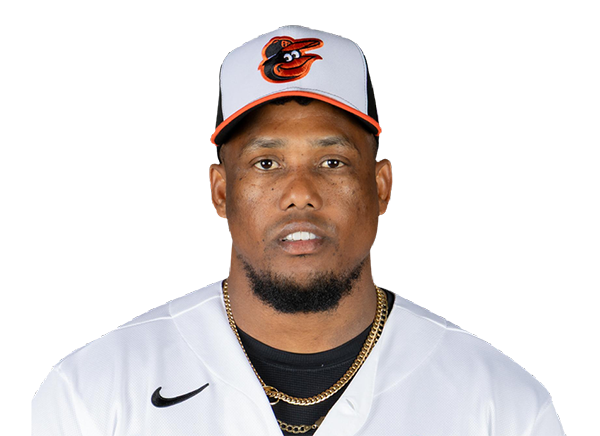 Yennier Cano | 0.2 | 0 | 0 | 0 | 0 | 1 | 0 | 5-4 | 3.15 | 5 |
 Andrew Kittredge | 1.0 | 0 | 0 | 0 | 0 | 1 | 0 | 9-6 | 3.74 | 9 |
 Alex Hoppe | 0.2 | 4 | 2 | 2 | 0 | 1 | 1 | 32-22 | 4.54 | 32 |
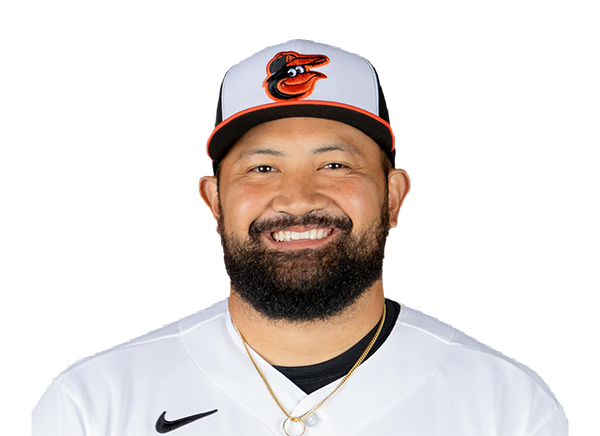 Rico Garcia | 0.1 | 0 | 0 | 0 | 0 | 0 | 0 | 6-5 | 3.02 | 6 |
Toronto Blue Jays
| Player | IP | H | R | ER | BB | K | HR | PC-ST | ERA | PC |
|---|---|---|---|---|---|---|---|---|---|---|
 Max Scherzer | 5.0 | 7 | 6 | 6 | 1 | 3 | 1 | 83-57 | 6.38 | 83 |
 Ricky Tiedemann | 1.0 | 1 | 0 | 0 | 1 | 3 | 0 | 25-17 | 1.69 | 25 |
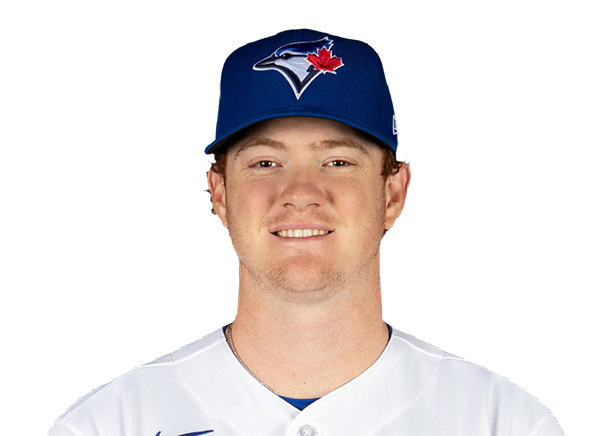 Braydon Fisher | 1.0 | 2 | 1 | 1 | 0 | 2 | 1 | 24-14 | 3.24 | 24 |
 Paul Sewald | 1.0 | 1 | 0 | 0 | 0 | 1 | 0 | 14-10 | 4.99 | 14 |
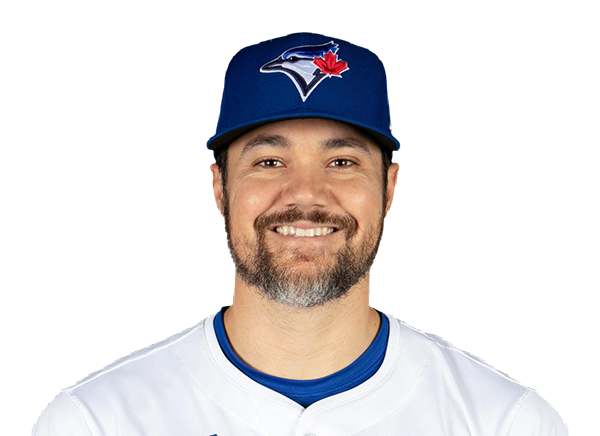 Brendon Little | 1.0 | 0 | 0 | 0 | 0 | 3 | 0 | 14-11 | 6.93 | 14 |
H2H / Season Series
TOR4–7
BAL
TOR6–4
BAL
TOR6–4
BAL
TOR3–13
BAL
BAL9–5
TOR
BAL6–5
TOR
BAL5–6
TOR
BAL1–2
TOR
TOR2–3
BAL
BAL0–1
TOR
Last 5 Games
| Date | Opponent | Result |
|---|---|---|
| Sep 11 | @ TOR | W7–4 |
| Sep 9 |  vs CLE | W9–5 |
| Sep 8 | vs CLE | L5–9 |
| Sep 7 | vs CLE | W6–4 |
| Sep 6 |  vs BOS | L1–3 |
| Date | Opponent | Result |
|---|---|---|
| Sep 11 | vs BAL | L4–7 |
| Sep 9 |  @ ATH | L0–2 |
| Sep 8 | @ ATH | W4–2 |
| Sep 7 | @ ATH | L5–6 |
| Sep 6 |  @ KC | L1–6 |
Standings
American League
| Team | W | L | PCT | GB | DIFF | STRK |
|---|---|---|---|---|---|---|
1 Rays | 88 | 59 | .599 | - | +58 | W1 |
2 White Sox | 75 | 72 | .510 | 13 | +35 | L4 |
3 Astros | 75 | 73 | .507 | 13.5 | -42 | L1 |
4 Yankees | 85 | 62 | .578 | 3 | +133 | W4 |
| 5Red Sox | 80 | 68 | .541 | 8.5 | +81 | L3 |
| 6Guardians | 75 | 73 | .507 | 13.5 | -13 | W1 |
| 7Blue Jays | 73 | 75 | .493 | 15.5 | -42 | L2 |
8 Rangers | 72 | 76 | .486 | 16.5 | -49 | L3 |
| 9Orioles | 72 | 76 | .486 | 16.5 | -24 | W2 |
10 Twins | 69 | 78 | .469 | 19 | -56 | L2 |
11 Mariners | 69 | 79 | .466 | 19.5 | -75 | L1 |
12 Tigers | 68 | 79 | .463 | 20 | +59 | W2 |
| 13Royals | 66 | 82 | .446 | 22.5 | -87 | W2 |
| 14Athletics | 60 | 88 | .405 | 28.5 | -186 | W2 |
15 Angels | 56 | 91 | .381 | 32 | -74 | L1 |
National League
| Team | W | L | PCT | GB | DIFF | STRK |
|---|---|---|---|---|---|---|
1 Brewers | 92 | 56 | .622 | - | +192 | W4 |
2 Dodgers | 90 | 57 | .612 | 1.5 | +173 | W8 |
3 Braves | 87 | 61 | .588 | 5 | +111 | W2 |
4 Cubs | 82 | 66 | .554 | 10 | +138 | W1 |
5 Phillies | 82 | 66 | .554 | 10 | +36 | L2 |
6 Padres | 79 | 68 | .537 | 12.5 | +19 | W5 |
7 Diamondbacks | 79 | 69 | .534 | 13 | +7 | W1 |
8 Pirates | 74 | 74 | .500 | 18 | +26 | L1 |
9 Cardinals | 73 | 75 | .493 | 19 | -8 | W1 |
10 Marlins | 72 | 76 | .486 | 20 | +3 | L4 |
11 Reds | 69 | 78 | .469 | 22.5 | -142 | L4 |
12 Mets | 68 | 79 | .463 | 23.5 | -42 | L1 |
13 Nationals | 68 | 81 | .456 | 24.5 | +1 | W1 |
14 Giants | 62 | 86 | .419 | 30 | -74 | L1 |
15 Rockies | 55 | 92 | .374 | 36.5 | -158 | L5 |
BAL
VS
TOR
Pitchers
Chris Bassitt
Catchers
Samuel Basallo
Infielders
Pete Alonso
Jackson Holliday
Gunnar Henderson
Christian Encarnacion-Strand
Outfielders
Dylan Beavers
Heston Kjerstad
Colton Cowser
Designated Hitters
Coby Mayo
Pitchers
Max Scherzer
Catchers
Alejandro Kirk
Infielders
Vladimir Guerrero Jr.
Kazuma Okamoto
Andres Gimenez
Ernie Clement
Outfielders
Brett Bateman
Nathan Lukes
Josh Smith
Designated Hitters
George Springer
Orioles
VS
Blue Jays
Batting
148
Team Games Played
148
4931
At Bats
4997
1157
Hits
1239
645
Runs Batted In
564
178
Home Runs
142
74
Stolen Bases
72
.235
Batting Average
.248
668
Runs
593
217
Doubles
235
19
Triples
8
1946
Total Bases
1916
546
Walks
410
1373
Strikeouts
1062
.316
On Base Percentage
.309
.395
Slugging Percentage
.383
.711
OBP Pct + SLG Pct
.693
148
Games Played
148
148
Games Started
148
58
Hit By Pitch
53
0.0
Wins Above Replacement
0.0
0.0
Offensive Wins Above Replacement
0.0
32
Caught Stealing
16
1
Is Qualified
1
624.5
Runs Created
595.1
4.3
Runs Created Per 27 Outs
4.1
.098
Walks Per Plate Appearance
.074
0.40
Walk To Strikeout Ratio
0.39
.160
Isolated Power
.135
.279
Secondary Average
.229
3.98
Pitches Per Plate Appearance
3.80
414
Extra Base Hits
385
5589
Plate Appearances
5531
27.7
At Bats Per Home Run
35.2
17
Sacrifice Hit
23
35
Sacrifice Flies
45
Pitching
148
Team Games Played
148
57
Quality Starts
45
72
Wins
73
76
Losses
75
42
Saves
50
79
Holds
93
1282
Hits
1163
608
Earned runs
574
159
Home Runs
155
488
Walks
537
1191
Strikeouts
1280
8.1
Strikeouts Per 9 Innings
8.8
146.3
Pitches Per Start
148.5
1.34
Walks Plus Hits Per Inning Pitched
1.29
4.15
Earned Run Average
3.93
76
Losses
75
1319.1
Innings pitched
1315.0
.486
Win Percentage
.493
63
Save Opportunities
65
.253
Opponent Batting Average
.236
.322
Opponent's On-base pct.
.314
.407
Opponent's Slugging pct.
.373
.729
Opponent's OPB Pct + SLG Pct
.686
5059
At Bats
4928
250
Doubles
191
26
Triples
9
47
Batters Hit
40
78
Stolen Bases
137
148
Games Played
148
1
Complete Games
1
2
Shutouts
11
43
Wild Pitches
48
663
Runs Batted In
602
3
Balks
8
1319.1
Innings pitched
1315.0
8.1
Strikeouts Per 9 Innings
8.8
34
Caught Stealing
42
148
Games Started
148
0.0
Wins Above Replacement
0.0
1
Is Qualified
1
692
Runs
635
608
Earned Runs
574
2061
Total Bases
1837
Fielding
148
Team Games Played
148
1319
Full Innings
1315
5312
Total Chances
5275
3958
Putouts
3945
1264
Assists
1244
90
Errors
86
217
Double Plays
235
0.983
Fielding Percentage
0.984
35.6
Range Factor
35.5
0.0
Zone Rating
0.0
148
Games Played
148
0
Games Started
0
0.0
Defensive Wins Above Replacement
0.0
1
Qualified
1